Category: AWS Cost Explorer
New – Cost Allocation for EBS Snapshots
Amazon Elastic Block Store (EBS) allows you to create persistent block storage volumes for your Amazon EC2 instances. The volumes offer consistent, low-latency performance and a choice of volume types. You can take snapshot backups of your EBS volumes, keep them for as long as you would like, and then restore them to a fresh volume.
AWS Billing and Cost Management provide you with tools and reports that you can use to track your spending. You can use Cost Allocation Tags to assign costs to your customers, applications, teams, departments, or billing codes at the level of individual resources.
Cost Allocation for Snapshots
Today we are adding cost allocation for EBS snapshots. While I expect AWS customers of all shapes and sizes to make good use of this feature, I know that enterprises will find it particularly interesting. They’ll be able to assign costs to the proper project, department, or entity. Similarly, Managed Service Providers, some of whom manage AWS footprints that encompass thousands of EBS volumes and many more EBS snapshots, will be able to map snapshot costs back to customer accounts and applications.
Tagging Snapshots and Generating Reports
Let’s walk through the process of tagging snapshots and allocating costs.
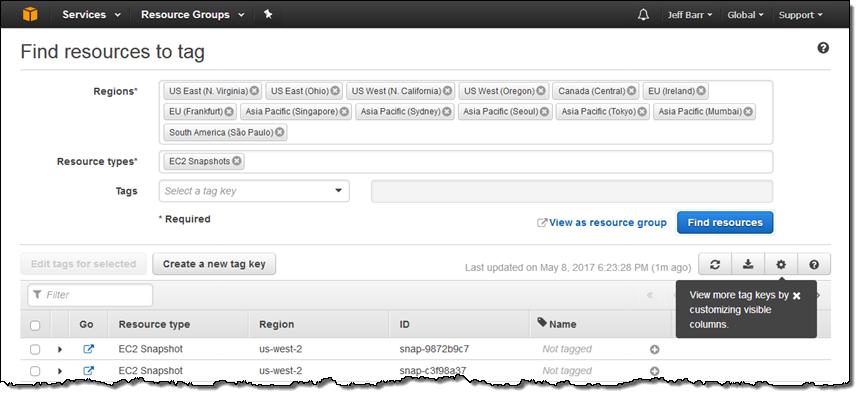
The first step is to implement a tagging regimen for your existing snapshots. You can create a script that calls the create-tags command or write code that calls the TagResources function. You can also use the Console’s Tag Editor to find the snapshots of interest across any number of AWS Regions:
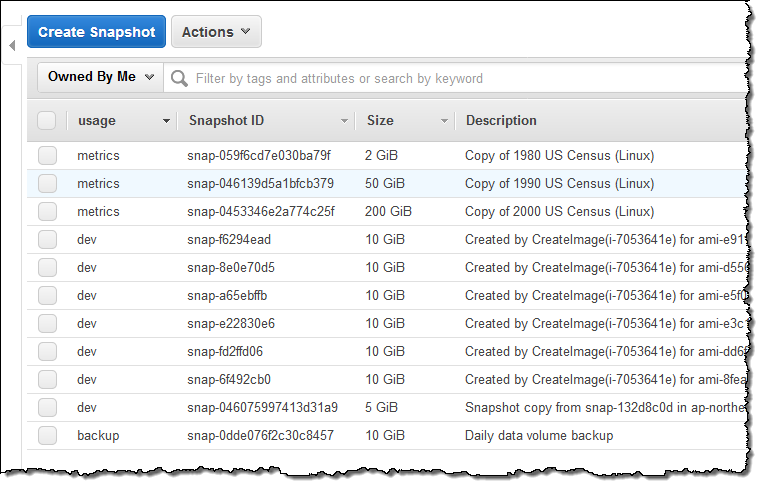
I have a handful of snapshots and simply tagged some them by hand. My tag key is usage and the values are backup, dev, and metrics. Here are my snapshots:
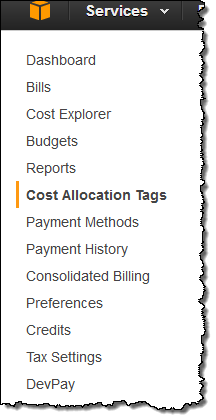
Next, I need to tell AWS that the new tag key is being used for cost allocation. I open up the Billing Dashboard and click on Cost Allocation Tags:
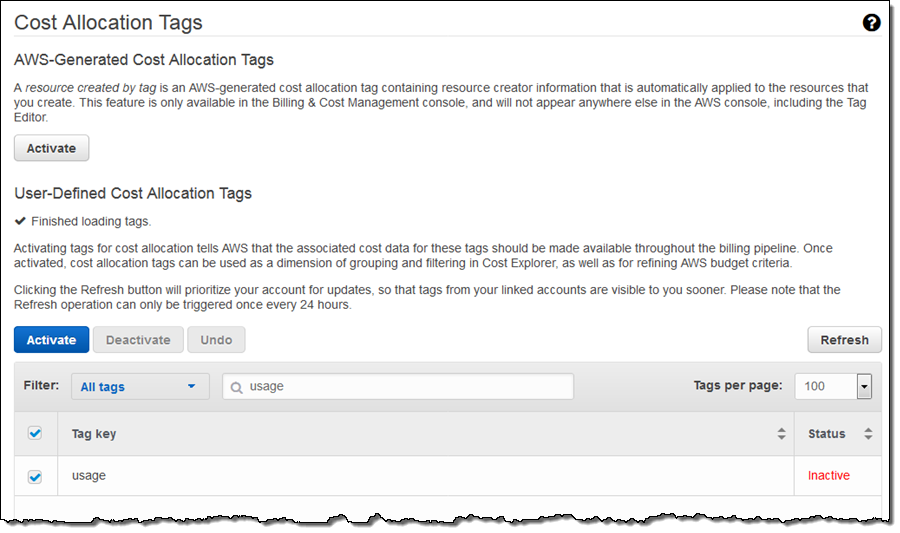
Then I locate my tag in the list of user-defined tags, select it, and clicked on Activate:
AWS will deliver the first updated report within 24 hours, and will update Cost Explorer at least once per day after that (read Understanding Your Usage with Billing Reports to learn more).
I have two options. I can use Cost Explorer to explore the data visually, or I can create a usage report, download it into Excel and analyze it on my desktop. I’ll show you both!
Using Cost Explorer
I open up Cost Explorer, select the time range of interest, and filter by Usage Type Group, selecting EC2: EBS – Snapshots. Then I set the Group by option to Tag and choose my tag (usage) from the drop-down:
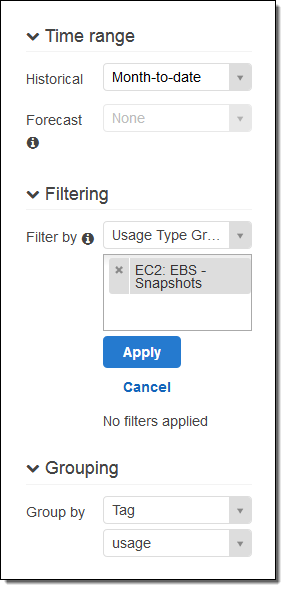
Then I click on Apply and inspect the report:
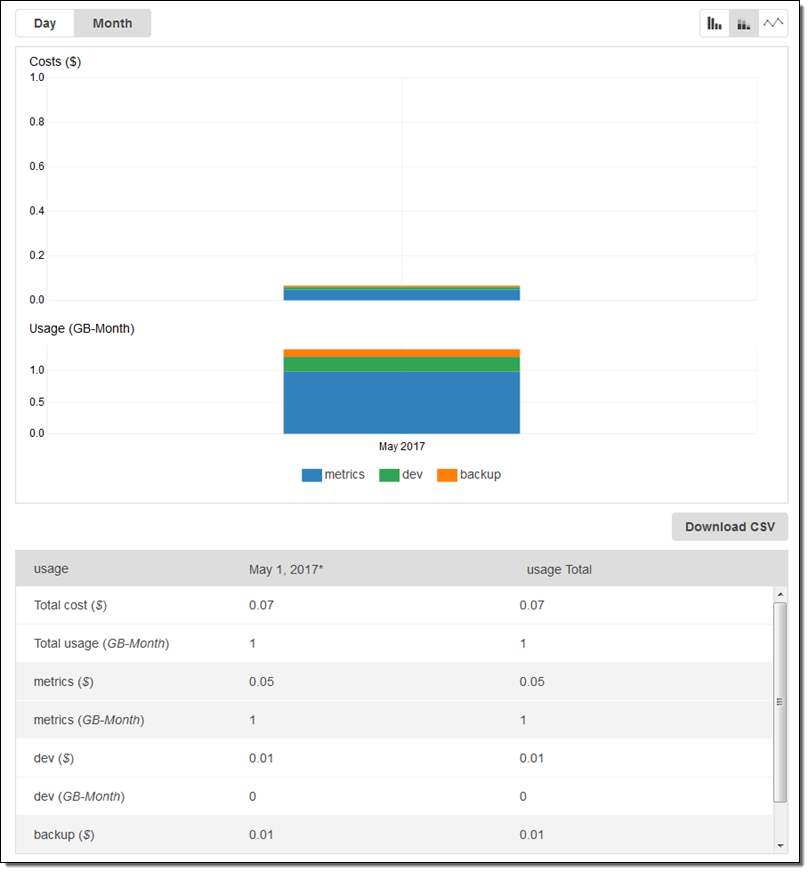
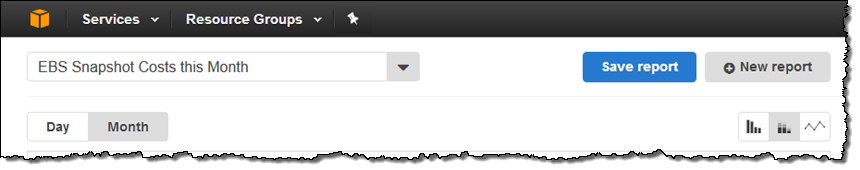
I can see my costs and my usage (measured in gigabyte-months) at a glance. I can also click on New report, enter a name, and save the report for reuse:
Creating a Cost & Usage Report
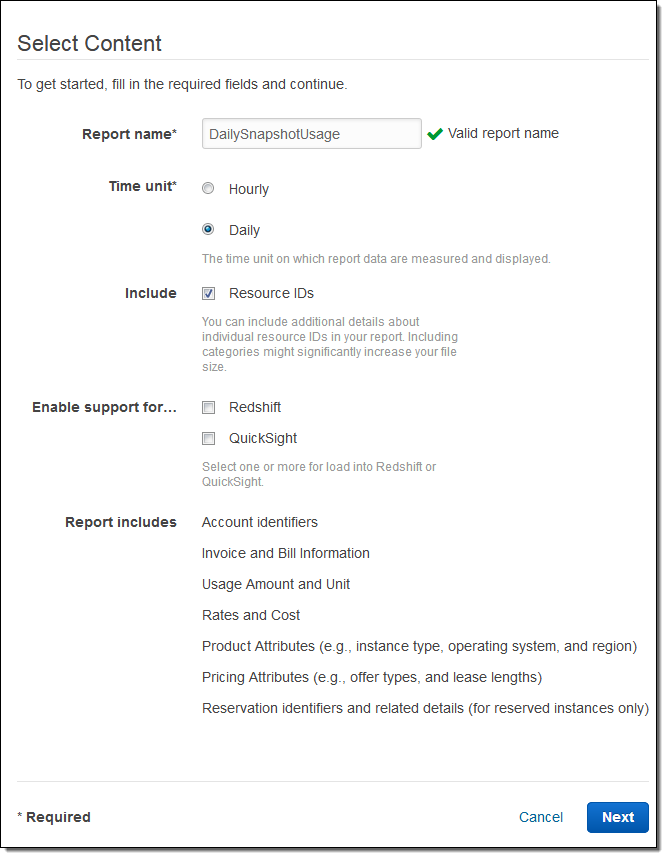
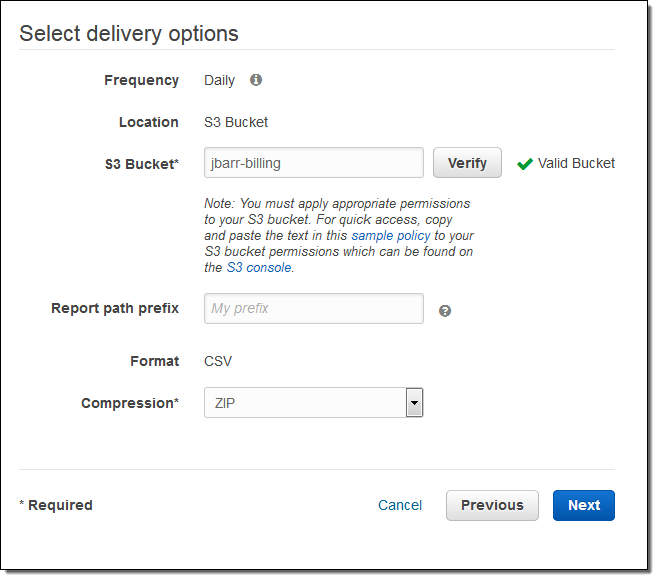
I click on Reports and Create Report, to create a report. I named it DailySnapshotUsage and set the Time unit to be Daily:
Then I point it at my jbarr-billing bucket, select ZIP compression, and click on Next:
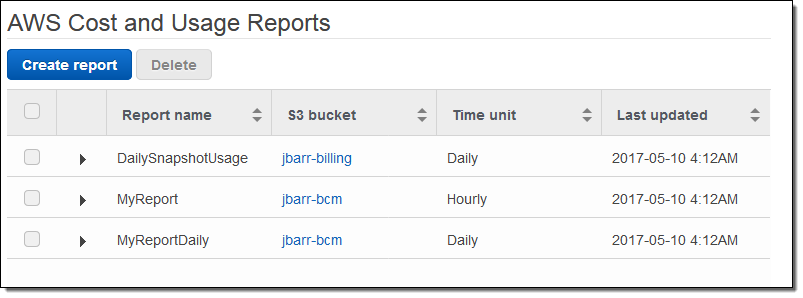
I confirm my settings on the next page and click on Review and Complete to finalize my report. I check back the next day and my report is ready:
Analyzing the Cost & Usage Report Using Excel
I can also download the cost and and usage report and analyze it using Excel.
I switch to the S3 Console, open up the jbarr-billing bucket, and descend in to the folder structure to find my report:
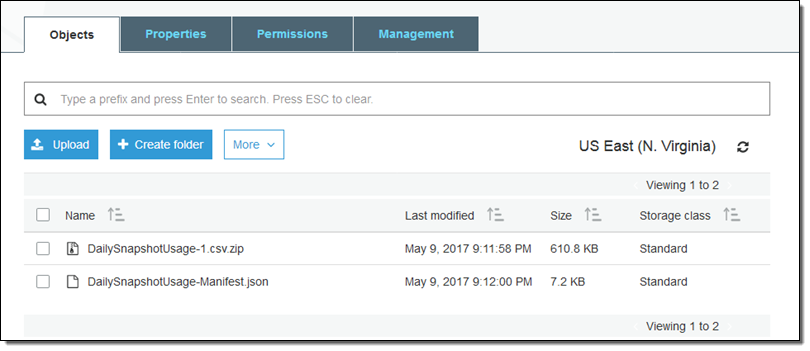
Then I download and unzip the file, and open it in Excel:
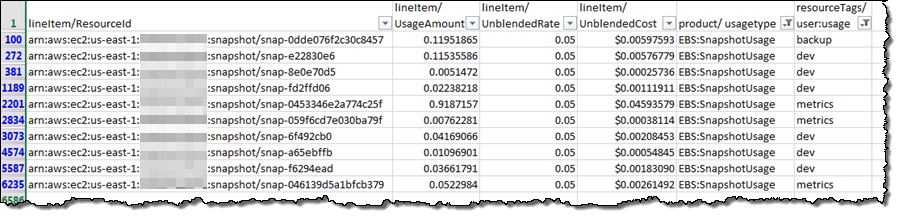
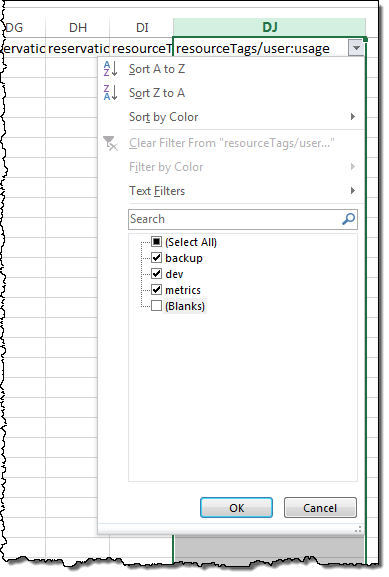
I want to see only the tagged usage, so I scroll over to column DJ (resourceTags/user:usage) and use Excel’s Filter operation to choose the tags of interest:
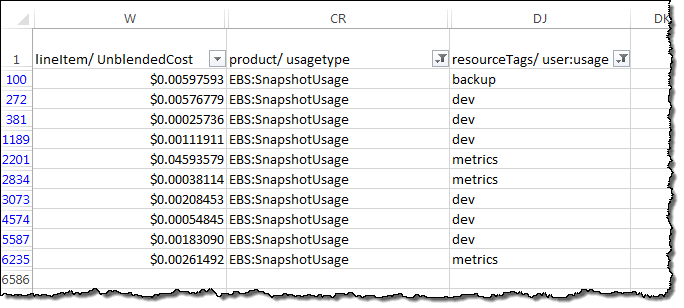
Then I hide most of the columns and end up with line item costs:
I’m highly confident that your Excel skills are better than mine, and that you can do a far better job of analyzing the data!
Understanding Snapshot Costs
As you create your reports and analyze your EBS snapshot costs and usage, keep in mind that snapshots are created incrementally and that the first snapshot will generally appear to be the most expensive one. If you delete a snapshot that contains blocks that are being used by a later snapshot, the space referenced by the blocks will now be attributed to the later snapshot. Therefore, with respect to a particular EBS volume, deleting the snapshot with the highest cost may simply move some of the costs to a more recent snapshot. Read Deleting an Amazon EBS Snapshot to learn more.
Available Now
This new feature is available now in all commercial AWS regions and you can start using it today.
— Jeff;
AWS Cost Explorer Update – Reserved Instance Utilization Report
Cost Explorer is a tool that helps you to manage your AWS spending using reporting and analytics tools (read The New Cost Explorer for AWS to learn more). You can sign up with a single click and then visualize your AWS costs, analyze trends, and look at spending patterns. You can look at your spending through a set of predefined views (by service, by linked account, daily, and so forth). You can drill in to specific areas of interest and you can also set up custom filters.
Enterprise-scale AWS customers invariably take advantage of the cost savings (up to 75% when compared to On-Demand) provided by Reserved Instances. These customers commonly have thousands of Reserved Instance (RI) subscriptions and want to make sure that they are making great use of them.
New Reserved Instance Utilization Report
Today we are adding a new Reserved Instance Utilization report to Cost Explorer. It gives you the power to track and manage aggregate RI utilization across your entire organization, even as your usage grows to thousands of subscriptions spread across linked accounts. You can also look at aggregate usage or individual RI usage going back up to one year. You can also look at aggregate usage or individual RI usage going back up to one year and define an RI utilization threshold to monitor your actual usage against it. If you find an RI subscription that is tracking below your predefined utilization target, you can drill down and find the account owner, instance type, and unused hours. You also have access to all of the existing filtering functions provided by Cost Explorer.
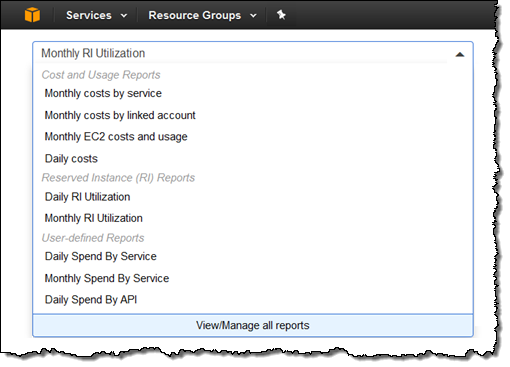
I don’t happen to own thousands of Reserved Instances, so I’ll use some sample screen shots and test data to show you what the report looks like and how you can use it! The new report is available in daily and monthly flavors from the Cost Explorer menu (this menu includes three reports that I defined myself):
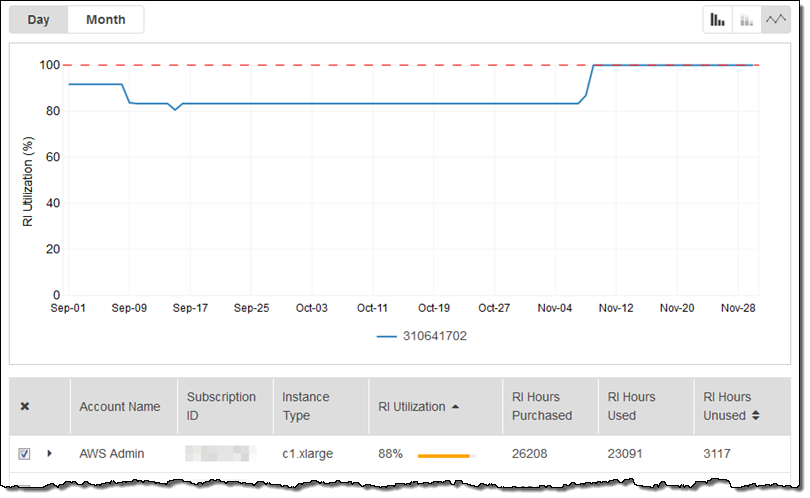
Here’s the Daily RI Utilization report:
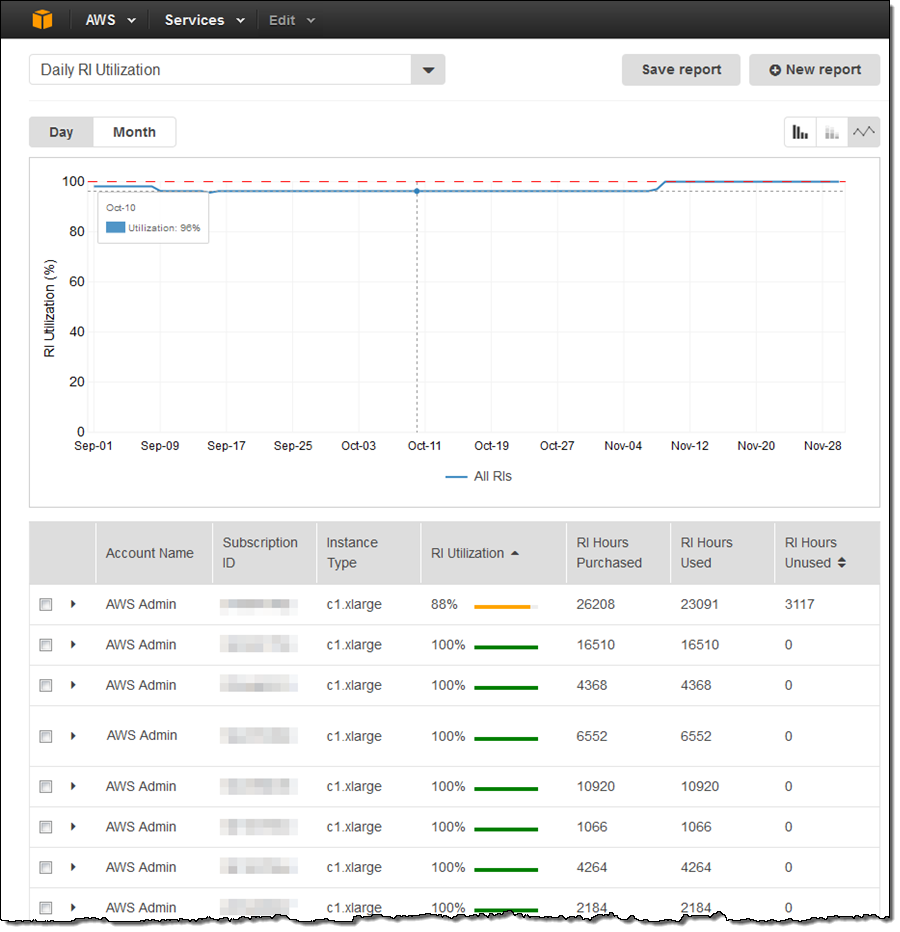
The RI are displayed in descending order of RI Utilization; the least-used RI’s are at the top of the list by default. I can see utilization over time and detailed information about the RI with a click:
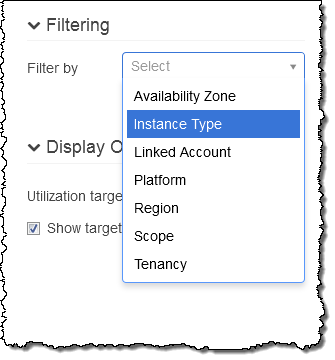
I can filter by instance type or other attributes in order to focus on particular RI’s:
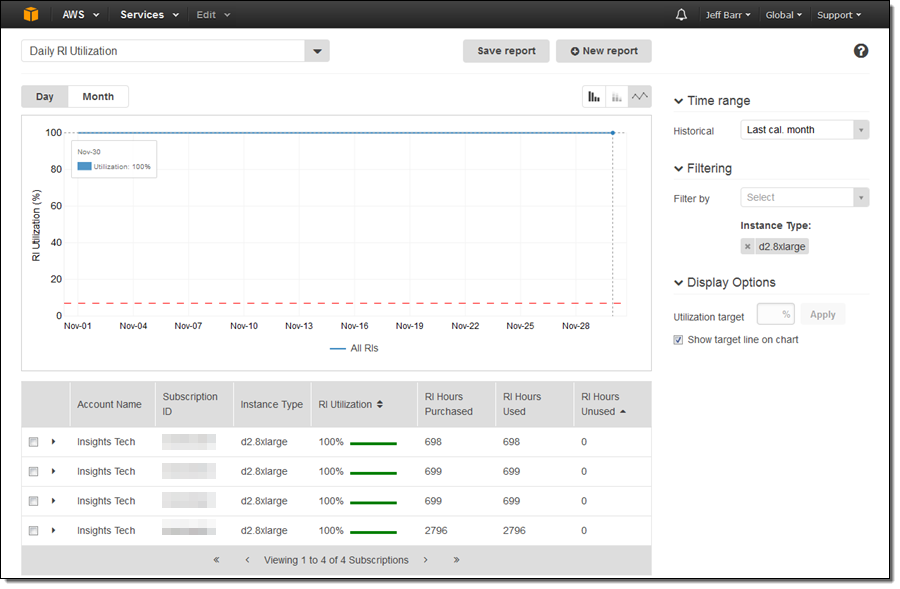
I can also set the desired time range. Here’s how I can verify that I made good use of my d2.8xlarge RI’s last month by filtering on an instance type and setting the time range:
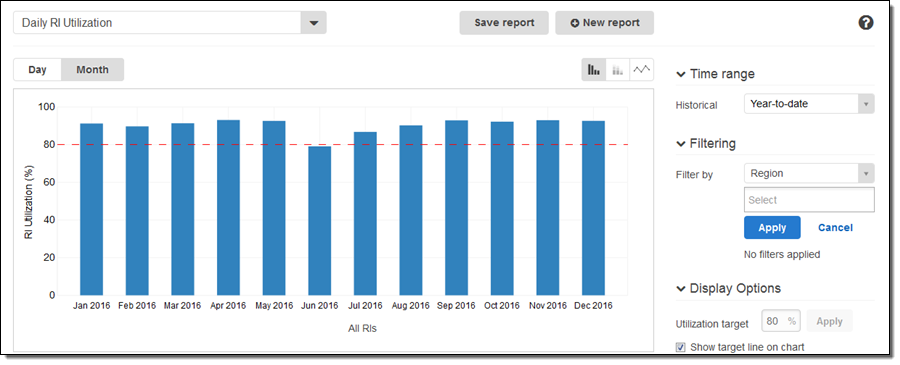
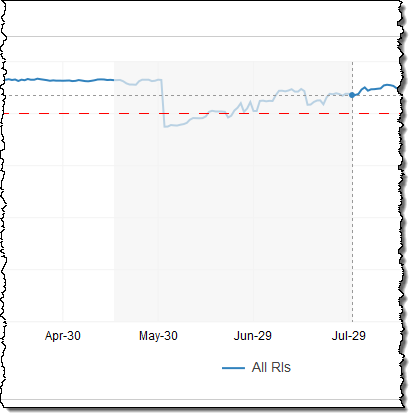
I can set the Utilization Target to any desired percentage and it will be shown on the graph as a reference line. Here, I can see that utilization dipped below 80% in June:
From there I can switch to the daily view and zoom in (click and drag) to learn more:
As I mentioned earlier, you can also filter on linked accounts, regions, and other aspects of each RI.
Now Available
This report is available now and you can start using it today!
— Jeff;
AWS Budgets Update – Track Cloud Costs and Usage
As Spider-Man and others before him have said, “with great power comes great responsibility.” In the on-demand, pay-as-you-go cloud world, this means that you need to be an informed, responsible consumer. In a corporate environment, this means that you need to pay attention to budgets and to spending, and to make sure that your actual spend is in line with your projections. With AWS in use across multiple projects and departments, tracking and forecasting becomes more involved.
Today we are making some important upgrades to the AWS Budgets feature (read New – AWS Budgets and Forecasts for background information). This feature is designed to be used by Finance Managers, Project Managers, and VP-level DevOps folks (please feel free to share this post with similarly-titled members of your organization if you are not directly responsible for your cloud budget). You can use AWS Budgets to maintain a unified view of your costs and usage for specific categories that you define, and you can sign up for automated notifications that provide you with detailed status information (over or under budget) so that you can identify potential issues and take action to prevent undesired actual or forecasted overruns.
AWS Budgets Updates
You can create up to 20,000 budgets per payer account. In order to allow you to stay on top of your spending in environments where costs and resource consumption are changing frequently, the budgets are evaluated four times per day. Notifications are delivered via email or programmatically (an Amazon Simple Notification Service (SNS) message), so that you can take manual, semi-automated, or fully automated corrective action. This gives you the power to address all of the following situations, along with others that may arise withing your organization:
VP – Optimize your overall cloud spend, with budgets for each business unit and for the company as a whole, tracking spending by region and other dimensions and comparing actual usage against budgets.
Project Manager – Manage costs within your department, watching multiple services, tags, and regions. Alert stakeholders when thresholds have been breached, and ask them to take action. When necessary, give resource budgets to individual team members to encourage adoption and experimentation.
Finance Manager – Analyze historical costs for your organization and use your insight into future plans to develop suitable budgets. Examine costs across the entire company, or on a per-account, per-service, business unit, or project team level.
Creating a Budget
Let’s create a budget or two!
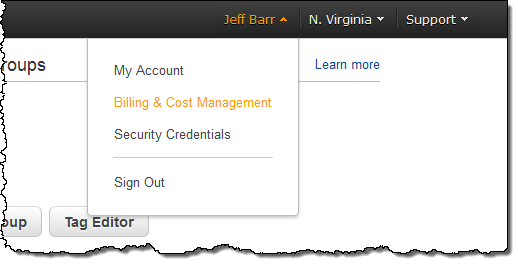
Start by opening up Billing and Cost Management:
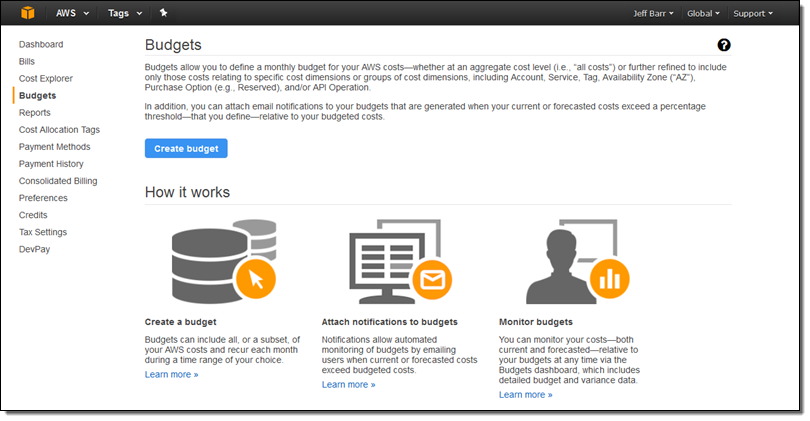
And then click on Budgets:
If you are new to AWS Budgets, you may have to wait up to 24 hours after clicking Create budget before you can proceed to the next step. During this time, we’ll prepare the first set of Detailed Billing Reports for your account.
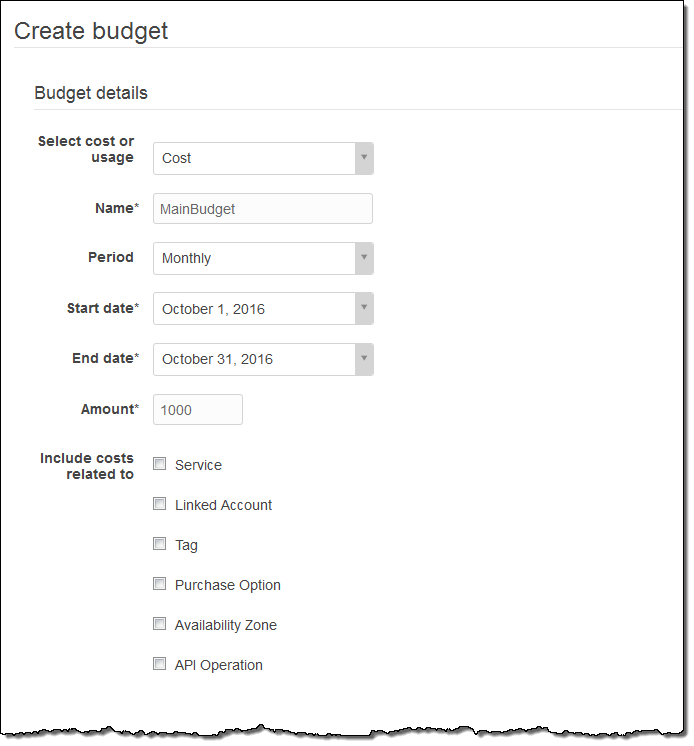
Click on Create budget, decide whether you want the budget to be based on costs or usage, and give your budget a name. Then select Monthly, Quarterly, or Annual. I’ll go for a cost-based ($1000) monthly budget named MainBudget to get started:
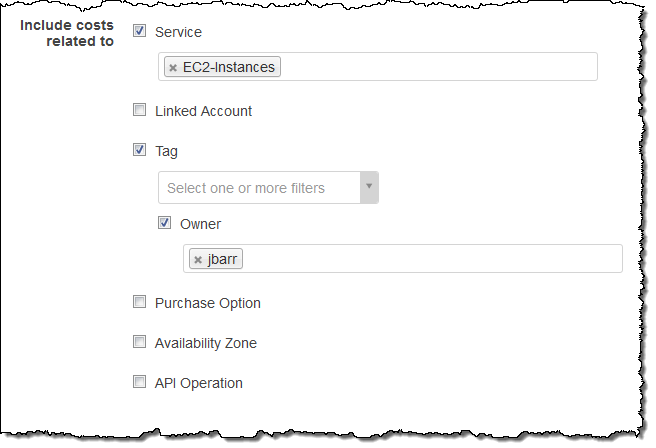
By not checking any of the options next to Include costs related to, my budget will apply to my entire account. Checking a box opens the door to all sorts of additional options that give you a lot of flexibility. Here’s how I could create a budget for usage of EC2 instances where the Owner tag is set to jbarr:
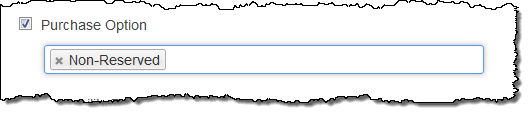
I could be even more specific, and choose to set a very modest budget for usage that is on Non-Reserved instances. This would be a great way to make sure that I am making good use of any Reserved Instances that my organization owns.
The next step is to set up email or programmatic notifications:
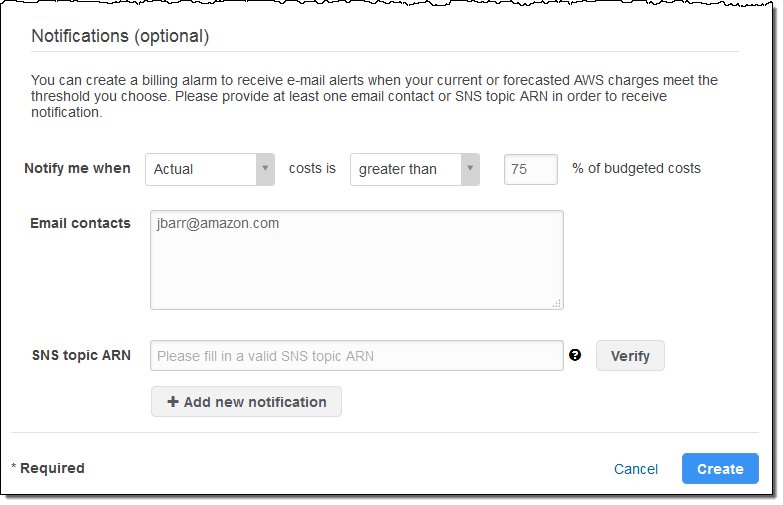
The programmatic notification option can be used in many different ways. I could create a new web app with a fixed budget, and then invoke a AWS Lambda function if costs are approaching the budgeted amount. The app could take corrective action to ensure that the budget is not exceeded. For example, it could temporarily disable some of the more computationally intensive features, or it could switch over to a statically hosted alternative site.
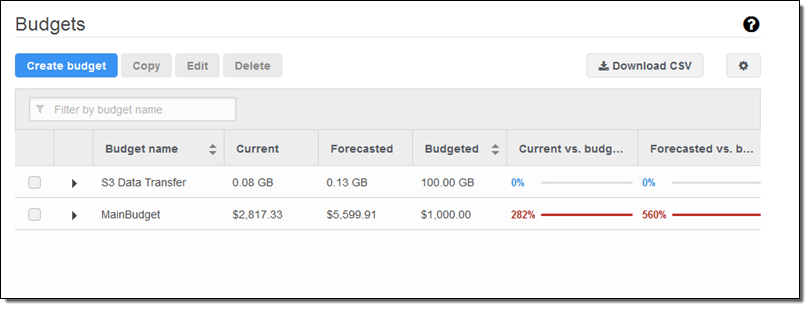
With everything set up as desired I simply click on Create. My budget is visible right away (I clicked on the triangle in order to display the details before I took this screen shot):
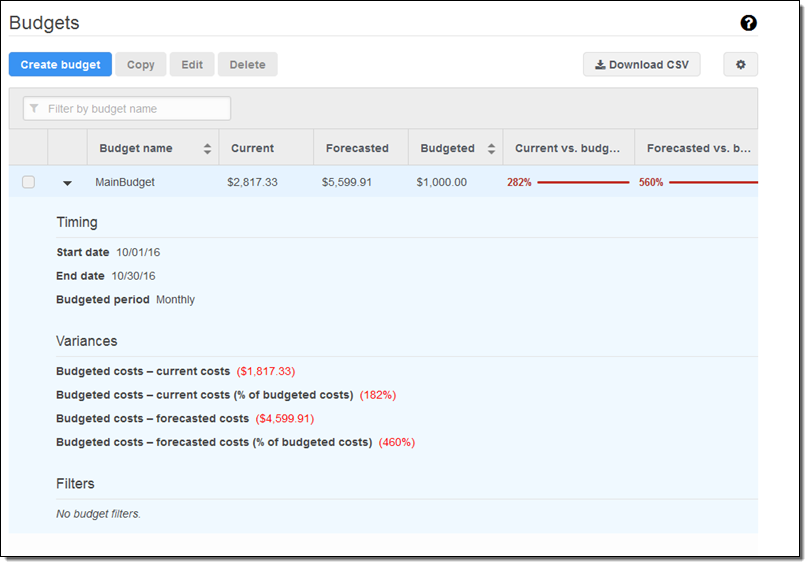
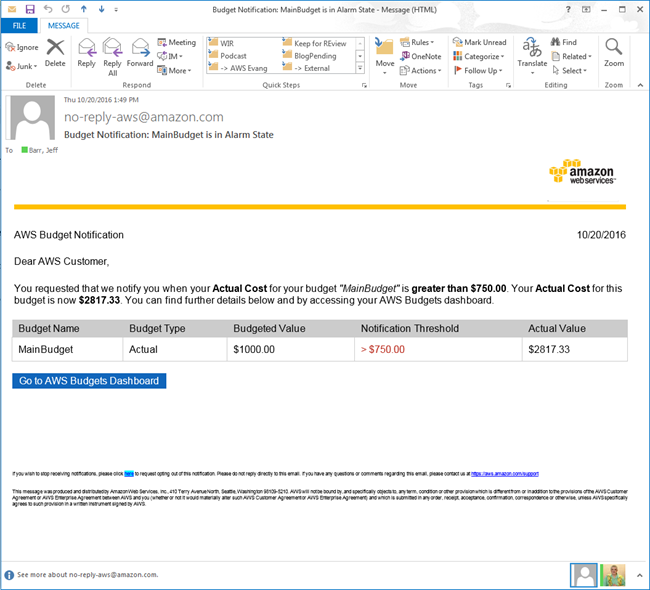
As you can can see, I have already overspent my $1000 budget, with a forecast of almost $5,600 for the month. Given that we are a frugal company (read our leadership principles to learn more), I really need to see what’s going on and clean up some of my extra instances! Because I had opted for email notification, I received the following message not too long after I created my budget:
Suppose that my data transfer budget is separate from my compute budget, and that I am allowed to transfer up to 100 GB of data out of S3 every month, regardless of the cost at the time. I can create a budget that looks like this:
![]()
And I can see at a glance that I am in no danger of exceeding my data transfer budget:
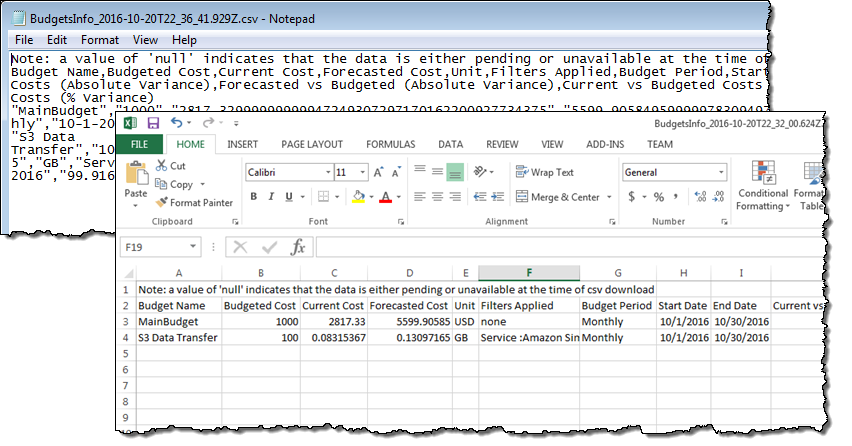
I can also download the on-screen information in CSV form for further inspection or as input to another part of my budgeting process:
As you can see, this new feature gives you the power to set up very detailed budgets. Although I have introduced this feature using the AWS Management Console, you can also set up budgets by making calls to the new Budget API or by using the AWS Command Line Interface (CLI). This API includes functions like CreateBudget, DescribeBudget, and UpdateBudget that you can use from within your own applications.
Available Now
This new feature is available now and you can start using it today! You can create two budgets per account at no charge; additional budgets cost $0.02 per day (again, you can have up to 20,000 budgets per account).
To learn more, read Managing Your Costs with Budgets.
— Jeff;
AWS Cost Explorer Update – Access to EC2 Usage Data
The AWS Cost Explorer (read The New Cost Explorer for AWS to learn more) is a set of a tools that help you to track and manage your AWS costs. Last year we added saved reports, budgets & forecasts, and additional filtering & grouping dimensions.
Today we are adding EC2 usage data to Cost Explorer, along with additional dimensions for filtering and grouping:
- The EC2 cost data is now broken down into three elements: EC2 instances (EC2-Instances), Elastic Load Balancing (ELB), and Elastic Block Store (EBS).
- You can now filter, group, and view costs on additional dimensions, including Instance Type and Region.
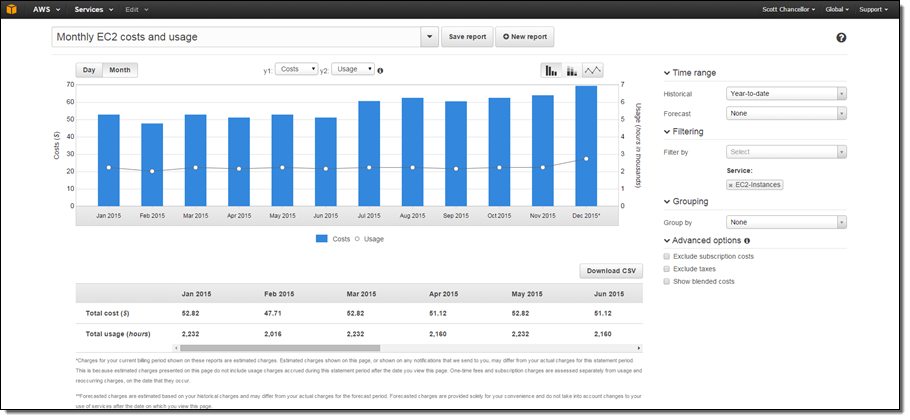
Here’s a screen shot of the new usage data and dimensions:
The new features are available now and you can start using them today. To learn more, read about Analyzing Your Costs with Cost Explorer.
— Jeff;
AWS Cost Explorer Update – More Filtering and Grouping Dimensions
AWS Cost Explorer is a spend management tool that lets you analyze, visualize and allocate your AWS spend to internal teams or projects. Using Cost Explorer, you can visualize your daily or monthly spend in easy-to-read bar and line charts or simple downloadable data tables. You can also choose to see your spend only for specific service types, linked account and tags and group the spend by both service types and linked accounts. Since the first launch of Cost Explorer in April 2014, thousands of customers have signed up to use Cost Explorer and have provided us with feedback about how easy and convenient it has become to analyze their AWS spend. They have also provided us with many suggestions for further improvements!
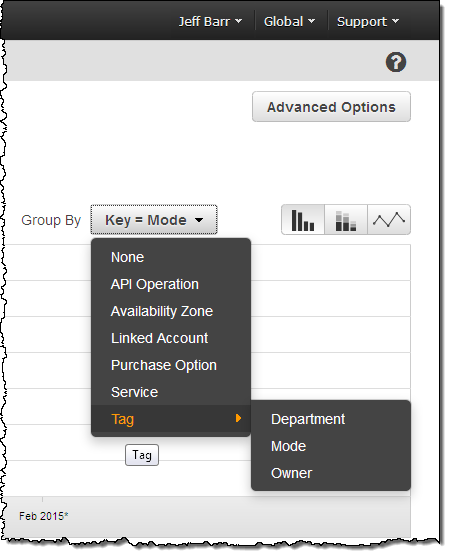
Group Spend By Tags
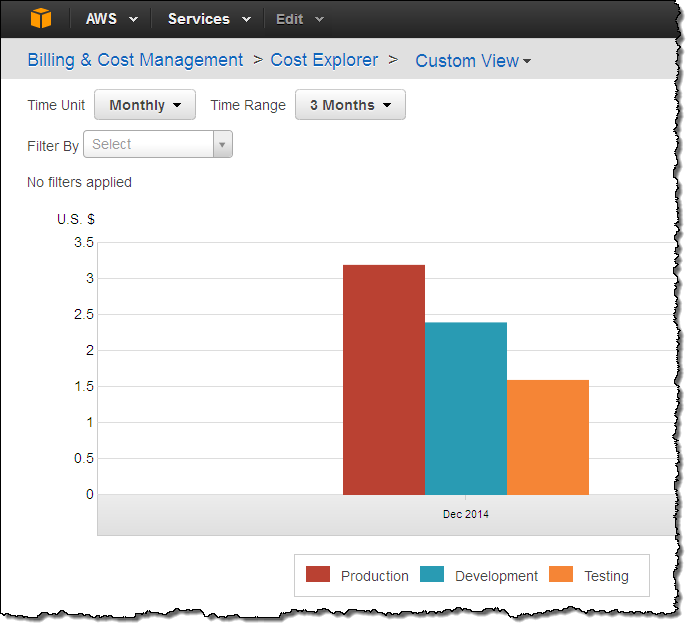
Last summer we added the ability to group your AWS spending by tag (this was a frequently requested feature, but one that I neglected to blog about at the time). Many of our customers attach tags to resources to track usage by internal departments or groups (such as setting the Environment tag to either Development or Production to allow separation of development and operational costs) and want to group the billing data in the Cost Explorer with these name/value pairs to easily perform cost allocation. To take advantage of this feature, you simply select the tag key that you would like to group your costs by (Environment):
Cost Explorer interface then displays costs broken down by all values applicable for that tag key in one report:
More Filtering and Grouping Dimensions
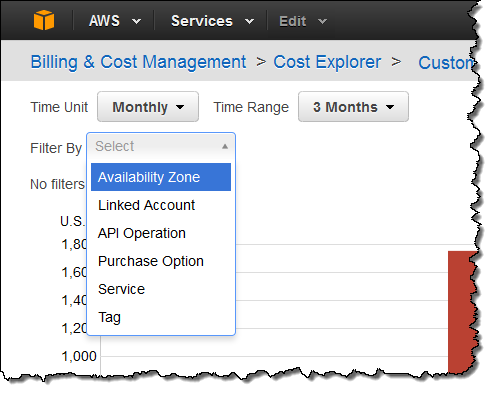
Today, based in large part on the response to last year’s launch, we are adding additional options for filtering and grouping your costs. In addition to the existing groupings (Service and Linked Account) you can now group by Availability Zone, Purchase Option (Reserved or Non-Reserved), and API Operation. You can also filter by multiple tag keys at the same time. You can use these new options to gain additional insights in to your AWS costs and the cost drivers behind them.
Here’s the newly updated Filter menu:
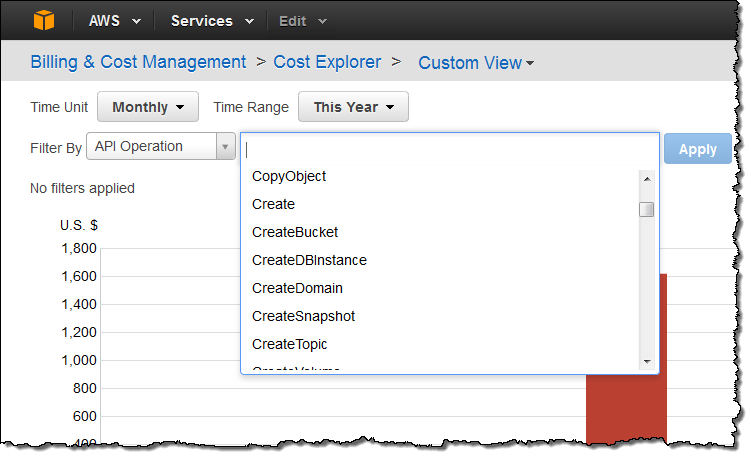
After you select a filtering option you can choose the value to show. For example, I can filter by API Operation and choose individual AWS API functions:
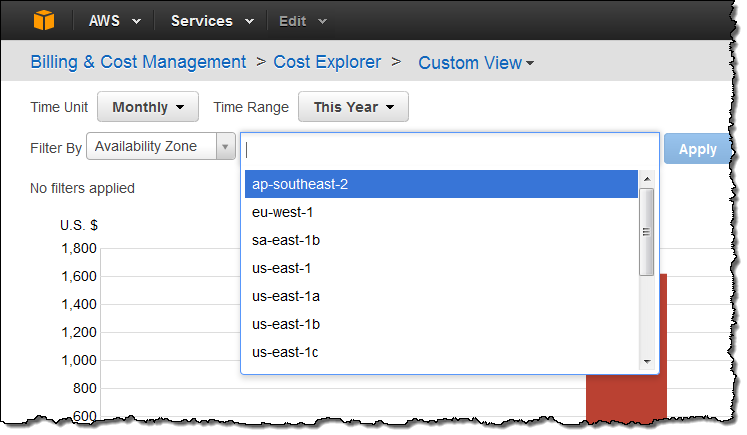
Or by Availability Zone:
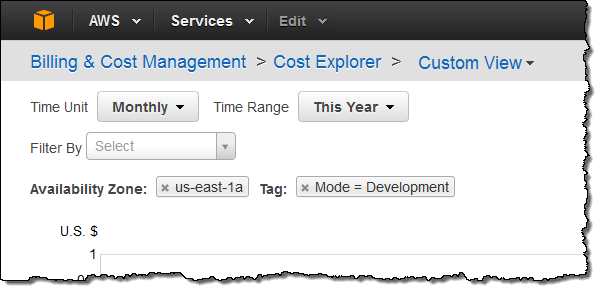
Multiple filters can be used to further control the display. For example, I can look at costs for all development resources in a single Availability Zone:
Available Now
These features are available now and you can start using them today!
— Jeff;