AWS Database Blog
Monitor Amazon QLDB query access patterns
Amazon Quantum Ledger Database (Amazon QLDB) is a purpose-built ledger database that provides a complete and cryptographically verifiable history of all changes made to your application data. Customers in regulated industries use the cryptographically verifiable history as part of meeting compliance and facilitating audits.
Similar to when working with traditional databases like MySQL or PostgreSQL, database administrators and security professionals also want to understand who accessed the Amazon QLDB ledger, when and from where they accessed it, and what transactions they ran. Unlike MySQL or PostgreSQL, which have a concept of a database user that allows for monitoring these access patterns at a user level, Amazon QLDB is a fully managed and serverless service. As with other Amazon serverless offerings, Amazon QLDB provides user-level security by integration with AWS Identity and Access Management (IAM). Given that IAM is a service in its own right, this has implications for how Amazon QLDB facilitates user-level access logging.
Access to Amazon QLDB is enabled over HTTPS and secured via IAM users and roles. A common Amazon QLDB application architecture is to provide application-level APIs via Amazon API Gateway, servicing those API requests with AWS Lambda, and using an Amazon QLDB driver within the Lambda function to access Amazon QLDB. For richer application routing capabilities, such as routing based on HTTP headers or query string parameters, you can use an Application Load Balancer in place of API Gateway, with requests still being serviced by Lambda.
In this post, we show how to associate Amazon QLDB transactions with the API requests received via an API Gateway. We use this to identify the PartiQL statement that was run within the Amazon QLDB transaction, and associate it with the caller’s IP address and location.
Amazon QLDB journal
In Amazon QLDB, you start by creating a ledger. Within the ledger you can create many tables. At the core of the ledger there is an immutable transactional log called the journal. The journal stores the complete and verifiable history of all the changes to the data in the tables. Every committed transaction in Amazon QLDB, such as creating a new document in a table, gets stored as a block in the journal. The journal contains several important pieces of data, including Amazon QLDB system-generated metadata, the data that was inserted or modified in the tables, and the verbatim PartiQL statements that were run as part of the transaction.
An example of the contents of an Amazon QLDB journal block is shown below. Although it doesn’t tell us who ran transactions against Amazon QLDB, it does offer sufficient information that can be used by security teams. Notice that the full PartiQL statement and data are included in the block contents.
Custom application logging
Although the Amazon QLDB journal provides a useful starting point, it doesn’t provide all the insight security teams need to understand access patterns such as who read or modified data, from where they accessed Amazon QLDB, and by what means did they access Amazon QLDB. To answer these questions, it’s important to understand the overall application architecture, and to gather additional data through logging from our application tier.
To achieve this, we gather log files from Amazon CloudWatch that capture the activity from API Gateway and Lambda. We also retrieve journal entries from the Amazon QLDB ledger that contain the exact PartiQL statement that was issued.
Solution overview
We begin by deploying the components we need. We deploy an API Gateway that uses Lambda proxy integration to service the API requests. The Lambda function uses the Python QLDB driver to run transactions on Amazon QLDB.
To map a block from the Amazon QLDB journal to its corresponding entries in the Lambda function and API logs, we need to log specific information about all Amazon QLDB transactions. To do this, we use the transaction ID and document ID, which is always a unique pair for all committed transactions to Amazon QLDB. We then query the Amazon QLDB history with the document ID as the index value and filter with the transaction ID to identify the Amazon QLDB blockAddress of this transaction. The blockAddress provides the location of where the block is in the journal. We can then use the Amazon QLDB GetBlock API to get the details of the block contents, which include the PartiQL statement that was run and the data that was stored in the Amazon QLDB immutable journal.
We test our solution by issuing an HTTPS request to API Gateway. Although we don’t cover it in this post, API Gateway supports multiple mechanisms for controlling and managing access to your API.
We enable API Gateway and Lambda logging to Amazon CloudWatch Logs to connect the TransactionId back to the originating request.
Prerequisites
You need AWS account-level access for API logging to run this solution. For instructions on setting up appropriate access, see Setting up CloudWatch logging for a REST API in API Gateway.
Deploy the solution
The solution is contained within a single AWS Serverless Application Model (AWS SAM) template, which creates all the required components. You can deploy this in any Region where Amazon QLDB is available. The following architecture diagram illustrates what is deployed.

To deploy this in your account, complete the following steps:
- First, clone this post’s GitHub repo. From a terminal window, run the following code:
This directory contains a template.yaml file, which is the AWS SAM template file that describes all the resources we deploy. It also contains folders named lambdaCode and layers, which contain the code that is deployed with the Lambda functions.
- Next, deploy the AWS SAM template:
- For the stack name, enter
qldb-monitor-access-patterns-blog-post. - Enter your preferred AWS Region and accept the other defaults.
When the deployment is complete, continue to the next steps in this post.
Insert a new document
Now that we have deployed our solution, it’s time to see it in action.
- On the Amazon QLDB console, open the ledger
shipments, which you just created.
We can see the table Shipments listed on the Tables tab.
- Choose the table to view its details.

We can see that one index is created, with the field name id.
Next, we need to insert data into Amazon QLDB so we can link the API caller to the contents in the Amazon QLDB journal. To do this, we issue a curl command to insert the data into Amazon QLDB via API Gateway, using data located on the AWS CloudFormation console.
- On the CloudFormation console, open the Outputs tab for the
qldb-monitor-access-patterns-blog-poststack. - Copy the output value for
apiGatewayInvokeURLForAddEvent, which we use to add a document into our Shipments table. - Enter the following curl command in any terminal window to write a single document to Amazon QLDB:
You should receive an output similar to the following:
- Copy this output and enter it into a local document to use in a later step.
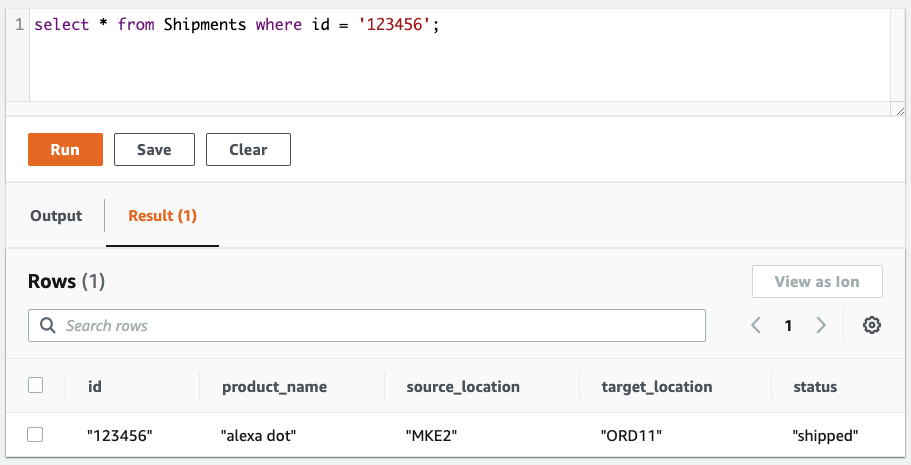
Before moving on, let’s use the built-in query editor to verify the data has been added to Amazon QLDB.
- From the Amazon QLDB query editor, issue the following query to retrieve the document we just inserted:
In the results pane, we can see the document we just inserted.
Identify the API caller
If we open the CloudWatch logs for the API Gateway endpoint we deployed, we can see a variety of information about the caller, including their IP address, the time of the request, and information about the client that issued the request.

Of particular interest is the field apigw.aws_endpoint_request_id, which uniquely identifies this API request. We look for this value when we inspect the Lambda logs to identify the Lambda function invocation that was initiated by this request.
Identify the Lambda function invocation
Next, we look at the CloudWatch logs and find the log group for our AddEvent Lambda function. A simple way to do this is to search by lambdaAddFunction, and then open the latest log stream. When you have found the log stream, filter again by the apigw.aws_endpoint_request_id we obtained from the API Gateway logs, making sure to enclose the ID in double quotes.
This narrows down the results to the Lambda function invocation we’re interested in. We can now see the Lambda function invocation response logged, and most importantly the transaction_id and the document_id.

These values are printed from within the code we deployed to the Lambda function. The transactionId is created when the Amazon QLDB driver creates the transaction. Within the transaction run, the request to create or modify the document returns the documentId of the document. We need both the transactionID and the documentID to find the exact statement that was run in Amazon QLDB. To enhance security, you can use AWS Signer with Lambda to make sure this logging statement isn’t removed from the code.
Retrieve the PartiQL statement using a journal blockAddress
Now that we have the transactionId and documentId, we can retrieve the blockAddress, which we can then query for details of the transaction we ran. To get the blockAddress, open the Amazon QLDB query editor, and query the history function:
Replace XXXXXXXX and YYYYYYYY with the documentId and transactionId, respectively, that you retrieved from the Lambda function logs. The query response returns the blockAddress:
You can retrieve the contents of that block using the Amazon QLDB GetBlock API. The response from this includes all the transactions and their associated documents and PartiQL statements. For convenience, we included an API route in our API Gateway that calls our GetBlock Lambda function, and returns this block information for a specified documentId and transactionId.
To get this route, on the AWS CloudFormation console, open the Outputs tab for the qldb-monitor-access-patterns-blog-post stack we deployed. Copy the value for apiGatewayInvokeURLForGetBlock into your terminal, and replace XXXXXXXX and YYYYYYYY with the document_id and transaction_id that was returned in the prior curl command. Run the curl command and you should see an output like the following:
The output of the GetBlock Lambda function shows the statements that ran without returning any potentially sensitive data. To see the entire contents of the block information, including the values that were inserted into the parameterized statement, you can run the same curl command but change the response from statement_summary to full.
Looking at this response, we can see the exact data that was inserted into Amazon QLDB, which was the data we submitted when creating this document in the initial step. Note that, because this Lambda function can expose sensitive data, access should be locked down following security best practices.
Clean up
To clean up the resources created by the AWS SAM template, run the following command:
You can also delete the stack through the AWS CloudFormation console.
Conclusion
In this post, we showed how to associate an HTTPS request that is sent to API Gateway to the PartiQL statement that was run in the Amazon QLDB ledger. Doing this gives us insight into access patterns, and associates client requests to the ledger modifications they are making.
As a next step, we can also send PartiQL statement statistics to CloudWatch logs to help identify inefficient and expensive queries. The code in the lambdaAddFunction includes an example of how to do this.
About the Author
 Emile Baizel is a Senior Blockchain Architect on the AWS Professional Services team. He has been working with blockchain technology since 2018 and is excited by its potential across a wide range of industries and use cases. In his free time he enjoys trail running, and spending tech-free time with his wife and two young children.