AWS News Blog
New – Amazon CloudWatch Anomaly Detection

|
Amazon CloudWatch launched in early 2009 as part of our desire to (as I said at the time) “make it even easier for you to build sophisticated, scalable, and robust web applications using AWS.” We have continued to expand CloudWatch over the years, and our customers now use it to monitor their infrastructure, systems, applications, and even business metrics. They build custom dashboards, set alarms, and count on CloudWatch to alert them to issues that affect the performance or reliability of their applications.
If you have used CloudWatch Alarms, you know that there’s a bit of an art to setting your alarm thresholds. You want to make sure to catch trouble early, but you don’t want to trigger false alarms. You need to deal with growth and with scale, and you also need to make sure that you adjust and recalibrate your thresholds to deal with cyclic and seasonal behavior.
Anomaly Detection
 Today we are enhancing CloudWatch with a new feature that will help you to make more effective use of CloudWatch Alarms. Powered by machine learning and building on over a decade of experience, CloudWatch Anomaly Detection has its roots in over 12,000 internal models. It will help you to avoid manual configuration and experimentation, and can be used in conjunction with any standard or custom CloudWatch metric that has a discernible trend or pattern.
Anomaly Detection analyzes the historical values for the chosen metric, and looks for predictable patterns that repeat hourly, daily, or weekly. It then creates a best-fit model that will help you to better predict the future, and to more cleanly differentiate normal and problematic behavior. You can adjust and fine-tune the model as desired, and you can even use multiple models for the same CloudWatch metric.
Using Anomaly Detection
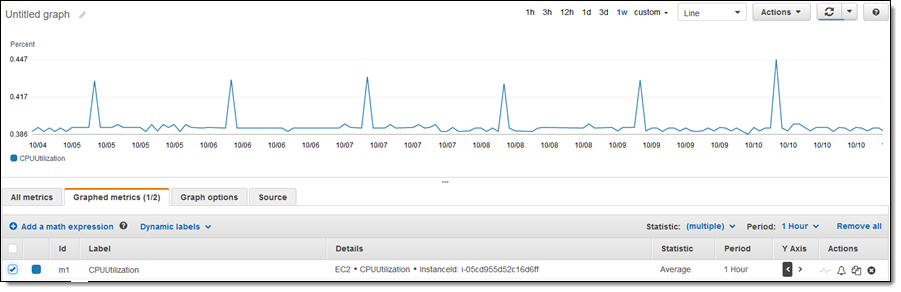
I can create my own models in a matter of seconds! I have an EC2 instance that generates a spike in CPU Utilization every 24 hours:
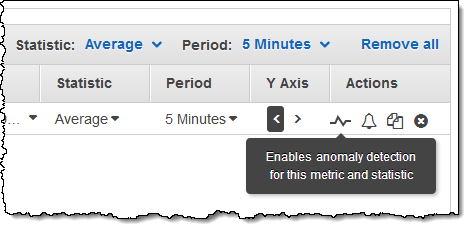
I select the metric, and click the “wave” icon to enable anomaly detection for this metric and statistic:
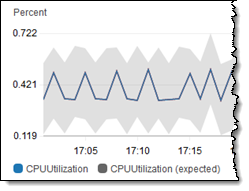
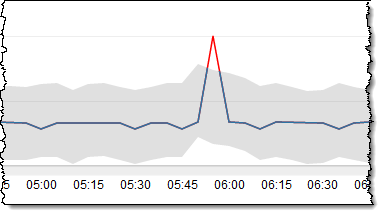
This creates a model with default settings. If I select the model and zoom in to see one of the utilization spikes, I can see that the spike is reflected in the prediction bands:
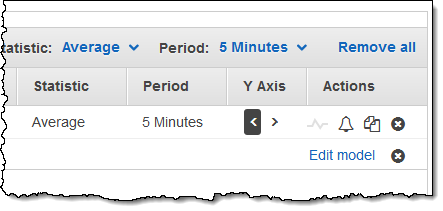
I can use this model as-is to drive alarms on the metric, or I can select the model and click Edit model to customize it:
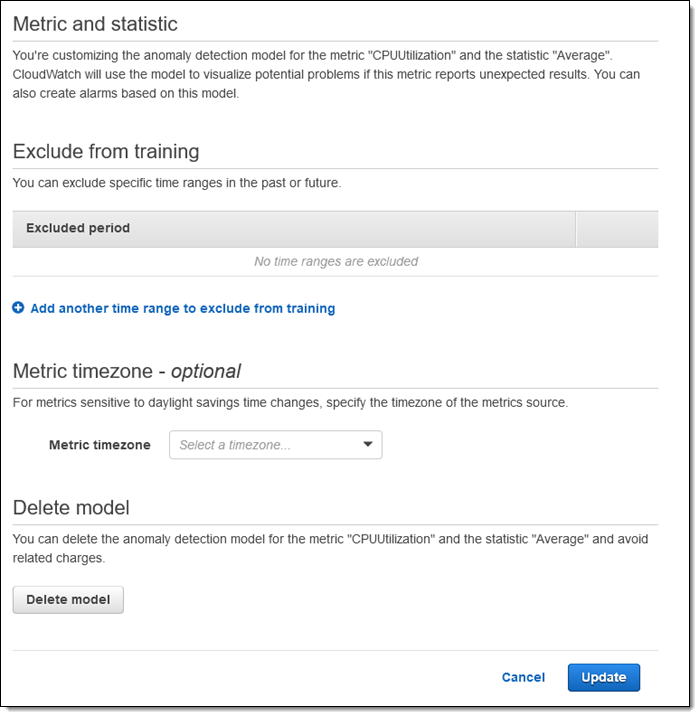
I can exclude specific time ranges (past or future) from the data that is used to train the model; this is a good idea if the data reflects a one-time event that will not happen again. I can also specify the timezone of the data; this lets me handle metrics that are sensitive to changes in daylight savings time:
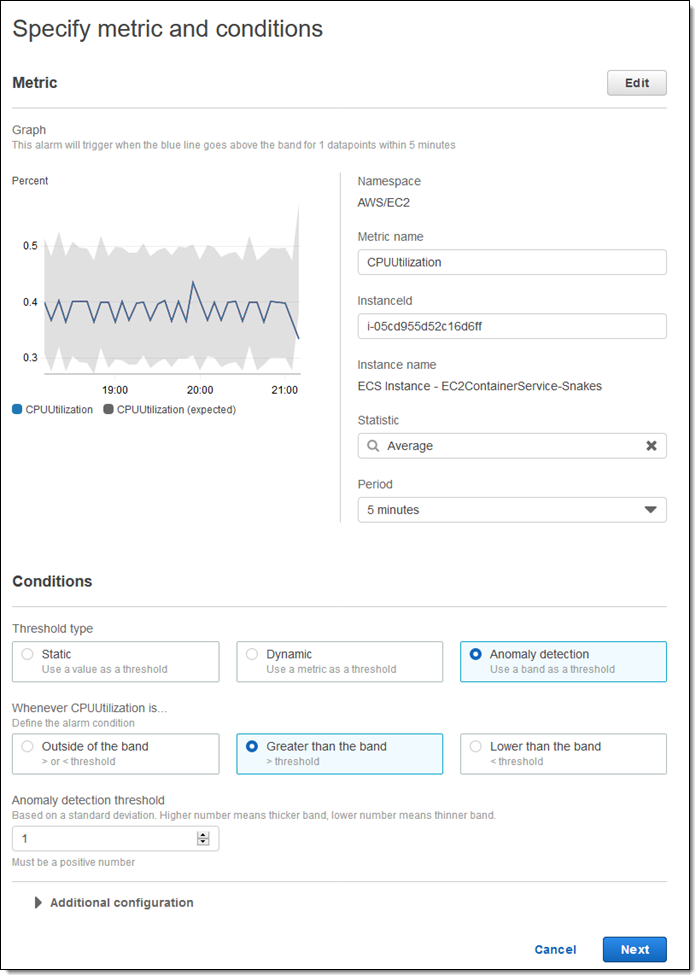
After I have set this up, the anomaly detection model goes in to effect and I can use to create alarms as usual. I choose Anomaly detection as my Threshold type, and use the Anomaly detection threshold to control the thickness of the band. I can raise the alarm when the metric is outside of, great than, or lower than the band:
The remaining steps are identical to the ones that you already use to create other types of alarms.
Things to Know
Here are a couple of interesting things to keep in mind when you are getting ready to use this new CloudWatch feature:
Suitable Metrics – Anomaly Detection works best when the metrics have a discernible pattern or trend, and when there is a minimal number of missing data points.
Updates – Once the model has been created, it will be updated every five minutes with any new metric data.
One-Time Events – The model cannot predict one-time events such as Black Friday or the holiday shopping season.
API / CLI / CloudFormation – You can create and manage anomaly models from the Console, the CloudWatch API (PutAnomalyDetector) and the CloudWatch CLI. You can also create AWS::CloudWatch::AnomalyDetector resources in your AWS CloudFormation templates.
Now Available
You can start creating and using CloudWatch Anomaly Detection today in all commercial AWS regions. To learn more, read about CloudWatch Anomaly Detection in the CloudWatch Documentation.
— Jeff;