AWS Big Data Blog
Create cross-account, custom Amazon Managed Grafana dashboards for Amazon Redshift
Amazon Managed Grafana recently announced a new data source plugin for Amazon Redshift, enabling you to query, visualize, and alert on your Amazon Redshift data from Amazon Managed Grafana workspaces. With the new Amazon Redshift data source, you can now create dashboards and alerts in your Amazon Managed Grafana workspaces to analyze your structured and semi-structured data across data warehouses, operational databases, and data lakes. The Amazon Redshift plugin also comes with default out-of-the-box dashboards that make it simple to get started monitoring the health and performance of your Amazon Redshift clusters.
In this post, we present a step-by-step tutorial to use the Amazon Redshift data source plugin to visualize metrics from your Amazon Redshift clusters hosted in different AWS accounts using AWS Single Sign-On (AWS SSO) as well as how to create custom dashboards visualizing data from Amazon Redshift system tables in Amazon Managed Grafana.
Solution overview
Let’s look at the AWS services that we use in our tutorial:
Amazon Managed Grafana is a fully managed service for open-source Grafana developed in collaboration with Grafana Labs. Grafana is a popular open-source analytics platform that enables you to query, visualize, alert on, and understand your operational metrics. You can create, explore, and share observability dashboards with your team, and spend less time managing your Grafana infrastructure and more time improving the health, performance, and availability of your applications. Amazon Managed Grafana natively integrates with AWS services (like Amazon Redshift) so you can securely add, query, visualize, and analyze operational and performance data across multiple accounts and Regions for the underlying AWS service.
Amazon Redshift is a fully managed, petabyte-scale data warehouse service in the cloud. You can start with just a few hundred gigabytes of data and scale to a petabyte or more. This enables you to use your data to acquire new insights for your business and customers. Today, tens of thousands of AWS customers from Fortune 500 companies, startups, and everything in between use Amazon Redshift to run mission-critical business intelligence (BI) dashboards, analyze real-time streaming data, and run predictive analytics jobs. With the constant increase in generated data, Amazon Redshift customers continue to achieve successes in delivering better service to their end-users, improving their products, and running an efficient and effective business.
AWS SSO is where you create or connect your workforce identities in AWS and manage access centrally across your AWS organization. You can choose to manage access just to your AWS accounts or cloud applications. You can create user identities directly in AWS SSO, or you can bring them from your Microsoft Active Directory or a standards-based identity provider, such as Okta Universal Directory or Azure AD. With AWS SSO, you get a unified administration experience to define, customize, and assign fine-grained access. Your workforce users get a user portal to access all their assigned AWS accounts, Amazon Elastic Compute Cloud (Amazon EC2) Windows instances, or cloud applications. AWS SSO can be flexibly configured to run alongside or replace AWS account access management via AWS Identity and Access Management (IAM).
The following diagram illustrates the solution architecture.
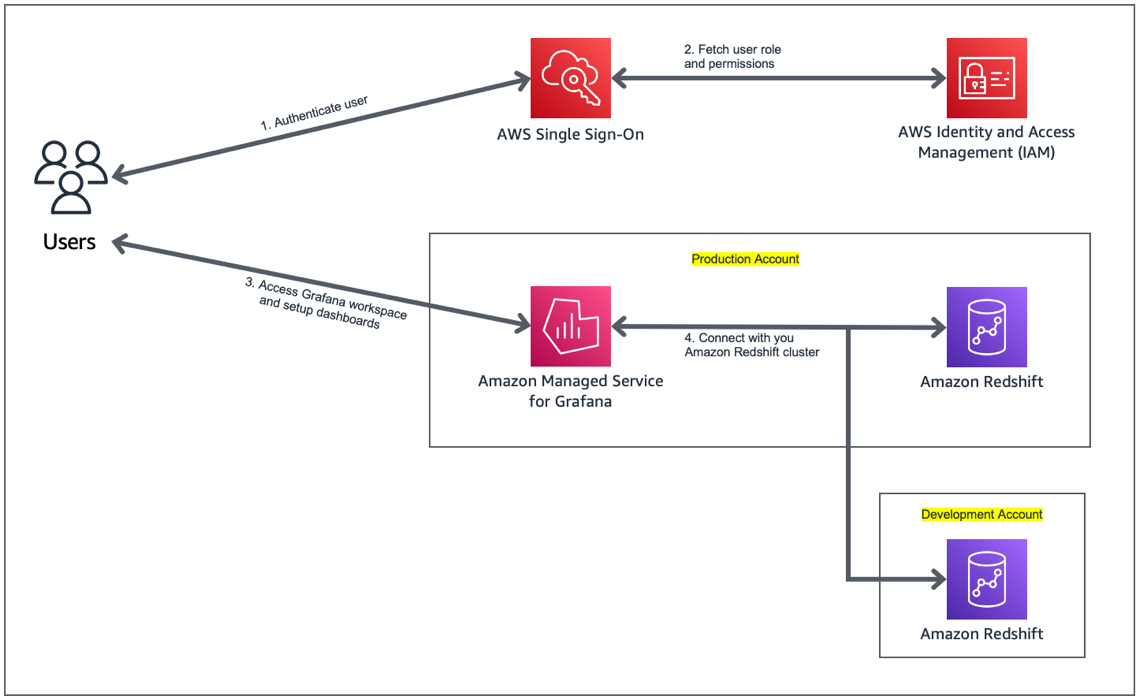
The solution includes the following components:
- Captured metrics from the Amazon Redshift clusters in the development and production AWS accounts.
- Amazon Managed Grafana, with the Amazon Redshift data source plugin added to it. Amazon Managed Grafana communicates with the Amazon Redshift cluster via the Amazon Redshift Data Service API.
- The Grafana web UI, with the Amazon Redshift dashboard using the Amazon Redshift cluster as the data source. The web UI communicates with Amazon Managed Grafana via an HTTP API.
We walk you through the following steps in this post:
- Create a user in AWS SSO for Amazon Managed Grafana workspace access.
- Configure an Amazon Managed Grafana workspace.
- Set up two Amazon Redshift clusters as the data sources in Grafana.
- Import the Amazon Redshift dashboard supplied with the data source.
- Create a custom Amazon Redshift dashboard to visualize metrics from the Amazon Redshift clusters.
Prerequisites
To follow along with this post, you should have the following prerequisites:
- An AWS account
- An existing Amazon Redshift cluster; if not, you can create one
- The prerequisites to use Amazon Redshift as a data source for Amazon Managed Grafana
- The user created for the Grafana dashboard should have super user privileges
Set up AWS SSO
In this section, we set up AWS SSO and register users.
In addition to AWS SSO integration, Amazon Managed Grafana also supports direct SAML integration with SAML 2.0 identity providers.
- If you don’t have AWS SSO enabled, open the AWS SSO console and choose Enable AWS SSO.

- After AWS SSO is enabled, choose Users in the navigation pane.
- Choose Add user.

- Enter the user details and choose Next: Groups.

- Choose Add user.
Set up your Amazon Grafana workspace
In this section, we demonstrate how to set up a Grafana workspace using Amazon Managed Grafana. We set up authentication using AWS SSO, register data sources, and add administrative users for the workspace.
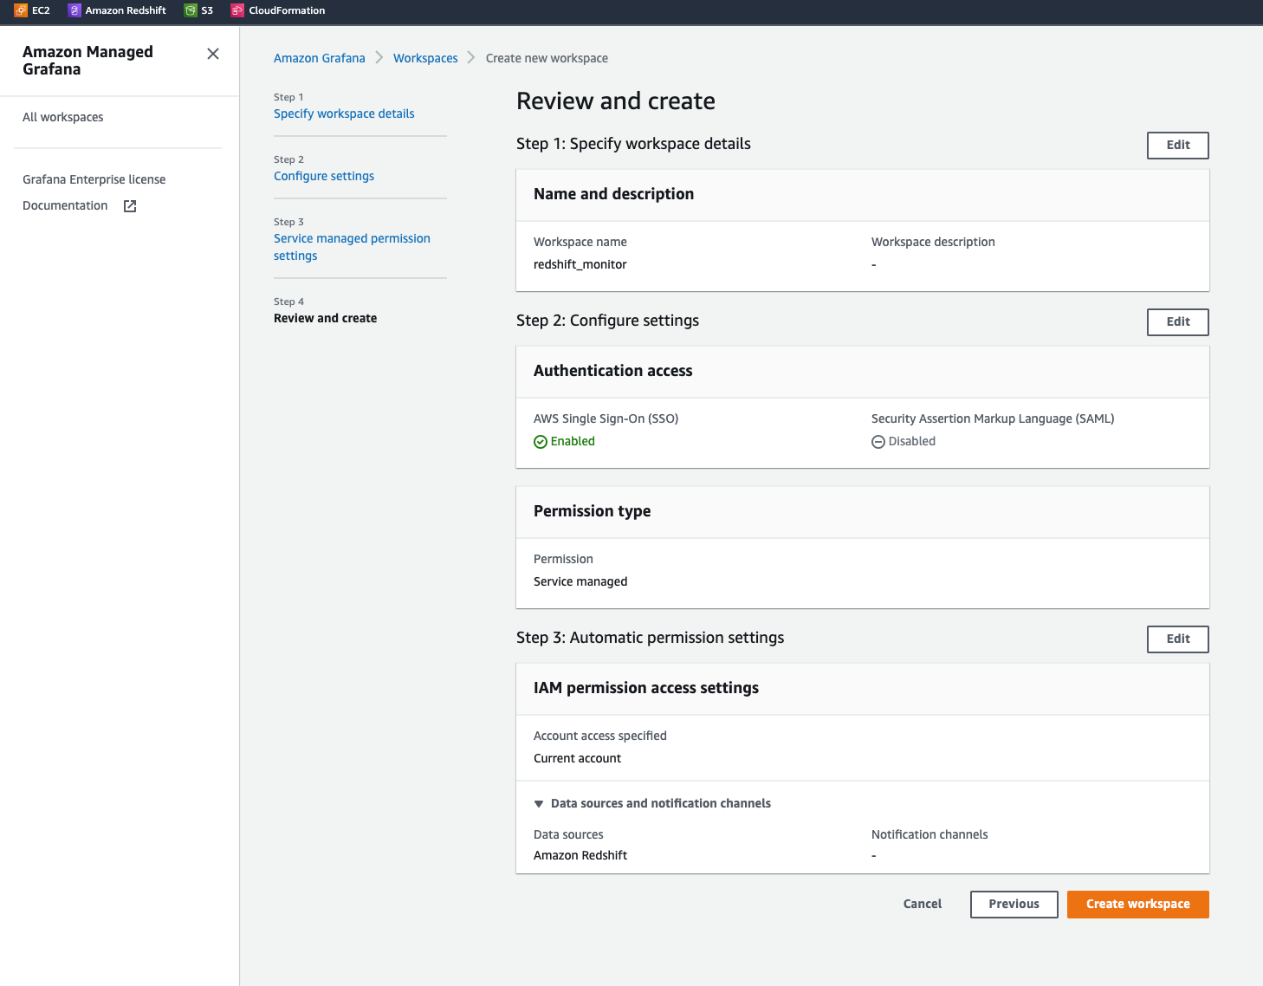
- On the Amazon Managed Grafana console, choose Create workspace.

- For Workspace name, enter a suitable name.
- Choose Next.

- For Authentication access, select AWS Single Sign-On.
- For Permission type, select Service managed.
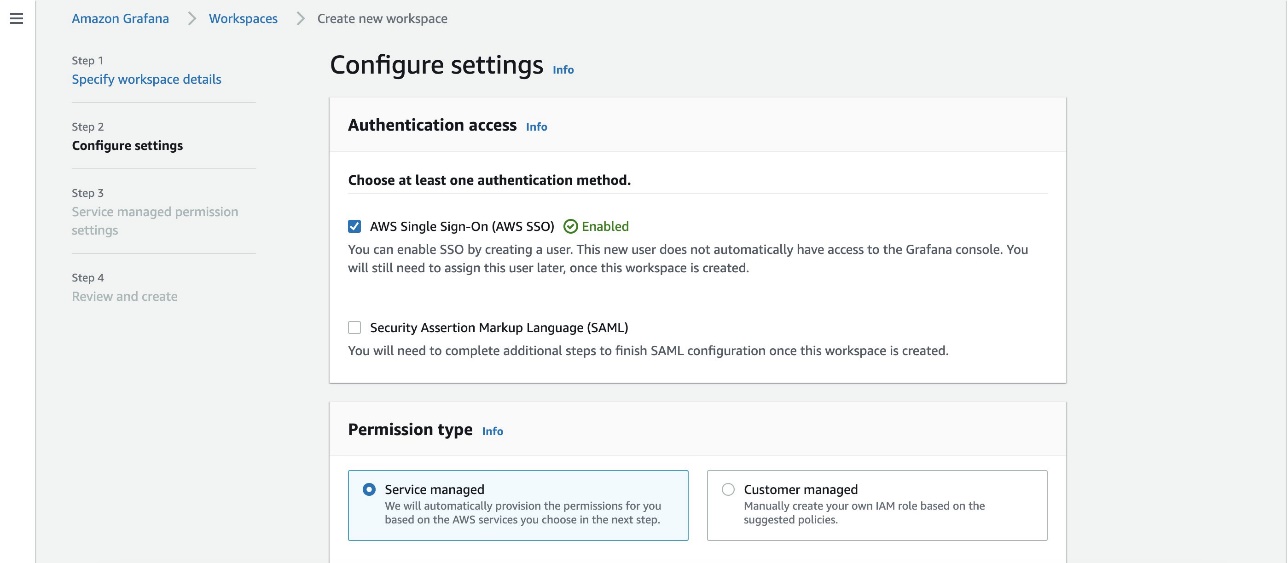
- Choose Next.
- Select Current account.
- For Data sources, select Amazon Redshift.

- Choose Next.
- Review the details and choose Create workspace.
Now we assign a user to the workspace. - On the Workspaces page, choose the workspace you created.
- Note the IAM role attached to your workspace.
- Choose Assign new user or group.
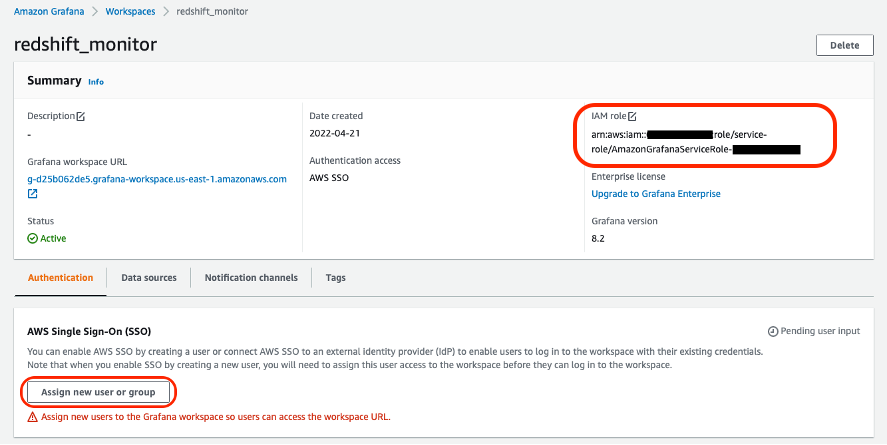
- Select the user to assign to the workspace.
- Choose Assign users and groups.

For the purposes of this post, we need an admin user. - To change the permissions of the user you just assigned, select the user name and choose Make admin.

For the cross-account setup, we use two Amazon Redshift clusters: production and development. In the next section, we configure IAM roles in both the production and development accounts so that the Grafana in the production account is able to connect to the Amazon Redshift clusters in the production account as well as in the development account.
Configure an IAM role for the development account
In this section, we set up the IAM role in the AWS account hosting the development environment. This role is assumed by the Amazon Managed Grafana service from the production AWS account to establish the connection between Amazon Managed Grafana and Amazon Redshift cluster in the development account.
- On the IAM console, choose Roles in the navigation pane.
- Choose Create role.
- Select Custom trust policy.
- Use the following policy code (update the account number for your production account and the Grafana service role attached to the workspace):
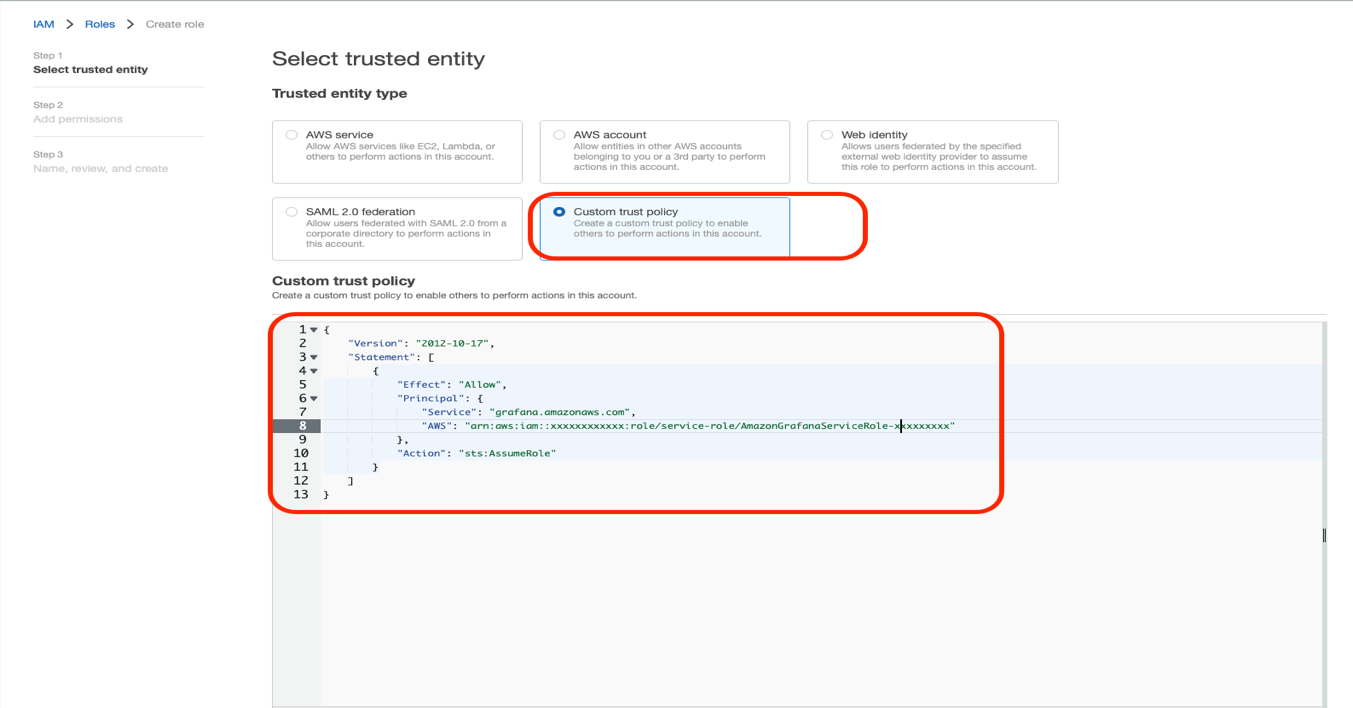
- Choose Next.
- Attach the managed IAM policy AmazonGrafanaRedshiftAccess to this role. For instructions, refer to Modifying a role permissions policy (console).
- Provide a role name, description, and tags (optional), and create the role.
Configure an IAM role for the production account
Next, we configure the IAM role created by the Amazon Managed Grafana service in order to establish the connection between Amazon Managed Grafana and the Amazon Redshift cluster in the production account.
- On the IAM console, choose Roles in the navigation pane.
- Search for the
AmazonGrafanaServiceRole-xxxxxxxrole attached to your Grafana workspace. - Create an inline IAM policy and attach it to this role with the following policy code:
- Provide a role name, description, and tags (optional), and create the role.
Import the default dashboard
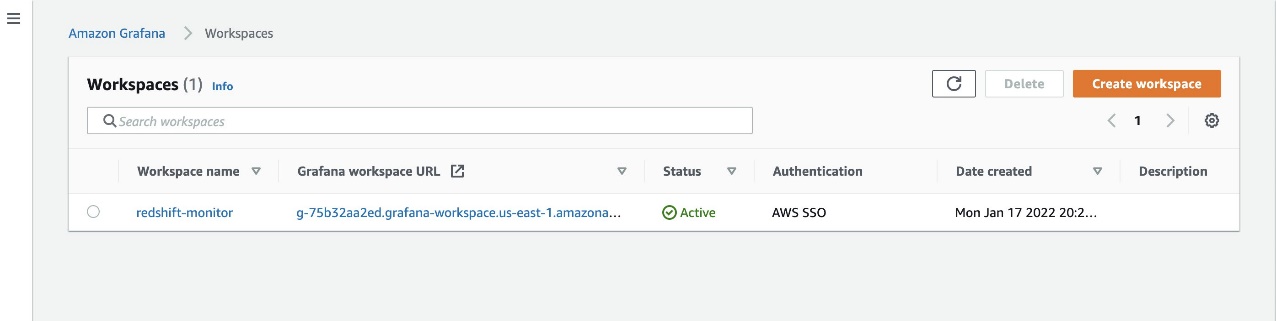
In this section, we connect to the Amazon Redshift clusters in the production and development accounts from the Amazon Managed Grafana console and import the default dashboard.
- On the Amazon Managed Grafana console, choose Workspaces in the navigation pane.
- Choose the workspace you just created (authenticate and sign in if needed).
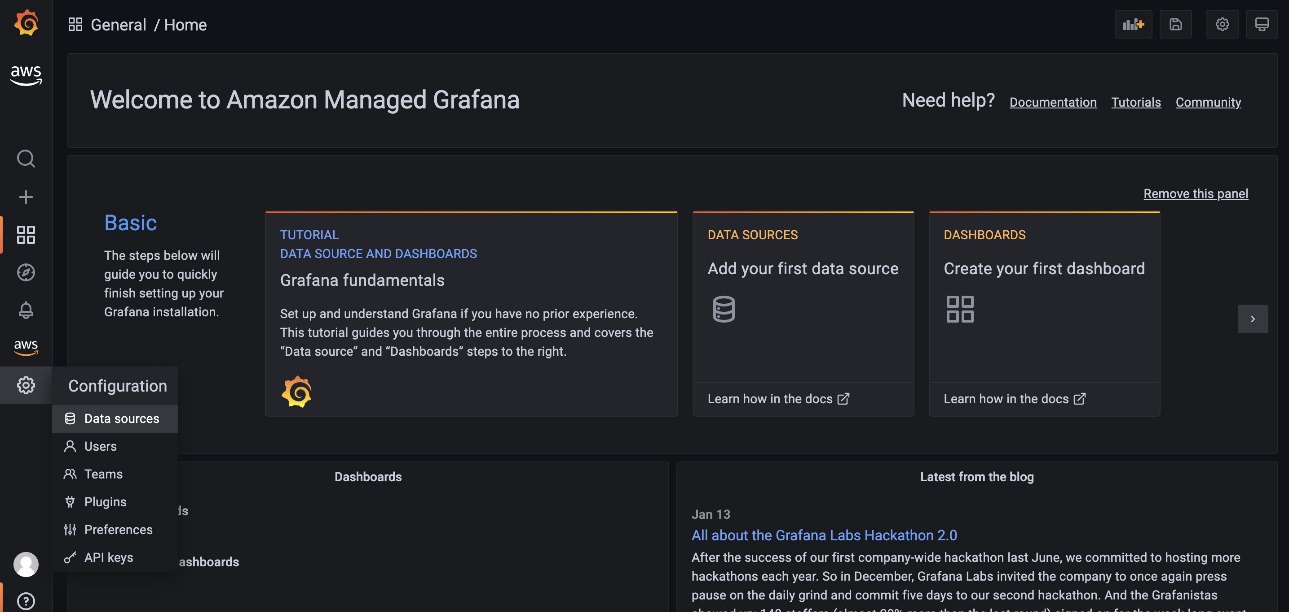
- In the navigation pane, choose Settings and on the Configuration menu, choose Data sources.
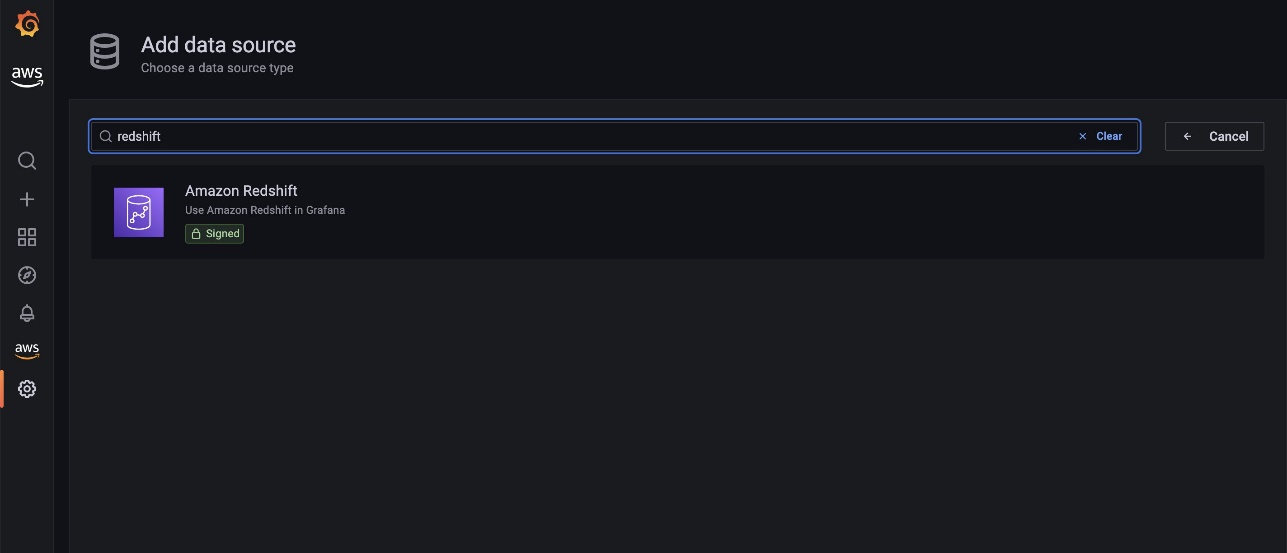
- Choose Add data source.

- Search for and choose Amazon Redshift.
- On the Settings tab, for Authentication provider, choose Workspace IAM role.
- For Default Region, choose us-east-1.
- Under Redshift Details, choose Temporary credentials.
- Enter the cluster identifier and database name for your Amazon Redshift cluster in the development account.
- For Database user, enter
redshift_data_api_user. - Choose Save & test.
When the connection is successfully established, a message appears that the data source is working. You can now move on to the next step.

- Repeat these steps to add another data source to connect to the Amazon Redshift cluster in the development account.
- On the Settings tab, for Authentication provider, choose Workspace IAM role.
- Enter the workspace role as the ARN of the IAM role you created earlier (
arn:aws:iam::dev-account-number:role/cross-account-role-name). - For Default Region, choose us-east-1.
- Under Redshift Details, choose Temporary credentials.
- Enter the cluster identifier and database name for your Amazon Redshift cluster in the development account.
- For Database user, enter
redshift_data_api_user. - Choose Save & test.
When the connection is successfully established, a message appears that the data source is working.

- On the Dashboards tab, choose Import next to Amazon Redshift.

On the dashboard page, you can change the data source between your production and development clusters on a drop-down menu.

The default Amazon Redshift dashboard, as shown in the following screenshot, makes it easy to monitor the overall health of the cluster by showing different cluster metrics, like total storage capacity used, storage utilization per node, open and closed connections, WLM mode, AQUA status, and more.
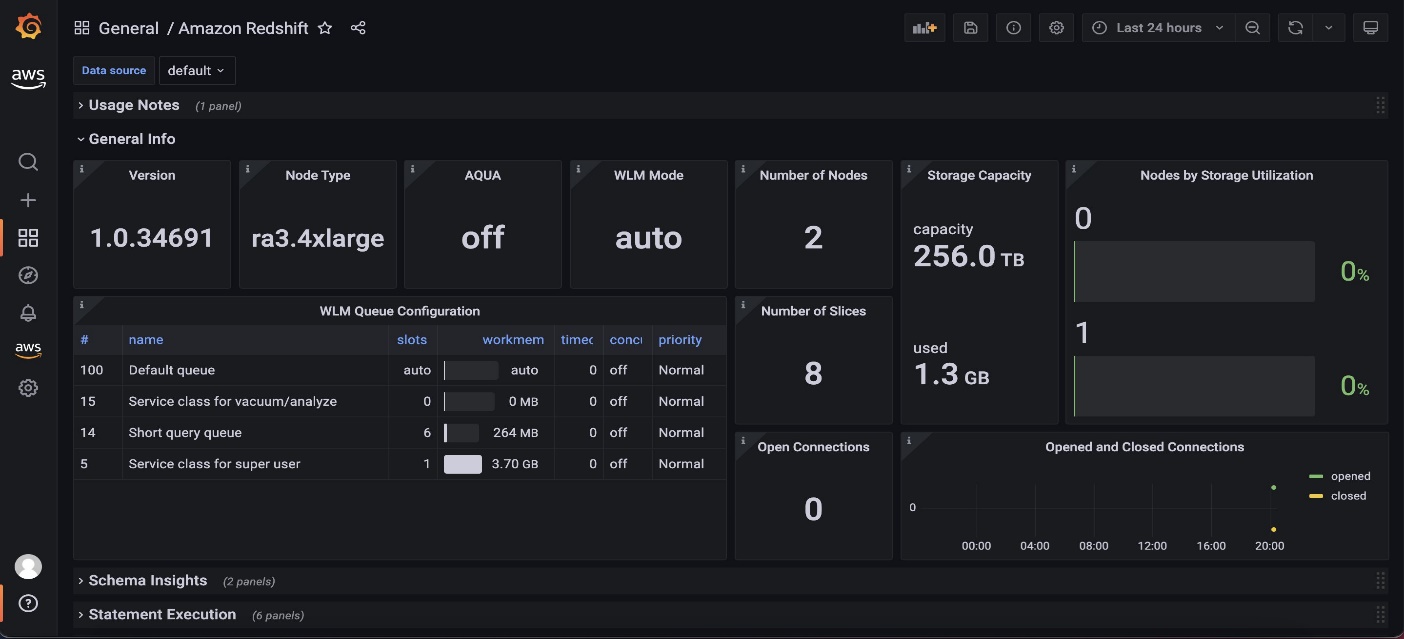
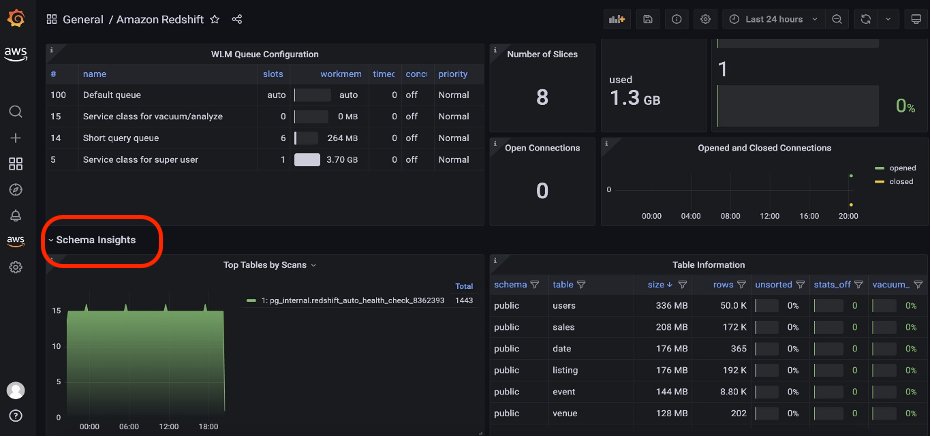
Additionally, the default dashboard displays several table-level metrics such as size of the tables, total number of rows, unsorted rows percentage, and more, in the Schema Insights section.
Add a custom dashboard for Amazon Redshift
The Amazon Redshift data source plugin allows you to query and visualize Amazon Redshift data metrics from within Amazon Managed Grafana. It’s preconfigured with general metrics. To add a custom metric from the Amazon Redshift cluster, complete the following steps:
- On the Amazon Managed Grafana console, choose All workspaces in the navigation pane.
- Choose the Grafana workspace URL for the workspace you want to modify.
- Choose Sign in with AWS SSO and provide your credentials.
- On the Amazon Managed Grafana workspace page, choose the plus sign and on the Create menu, choose Dashboard.
- Choose Add a new panel.

- Add the following custom SQL to get the data from the Amazon Redshift cluster:
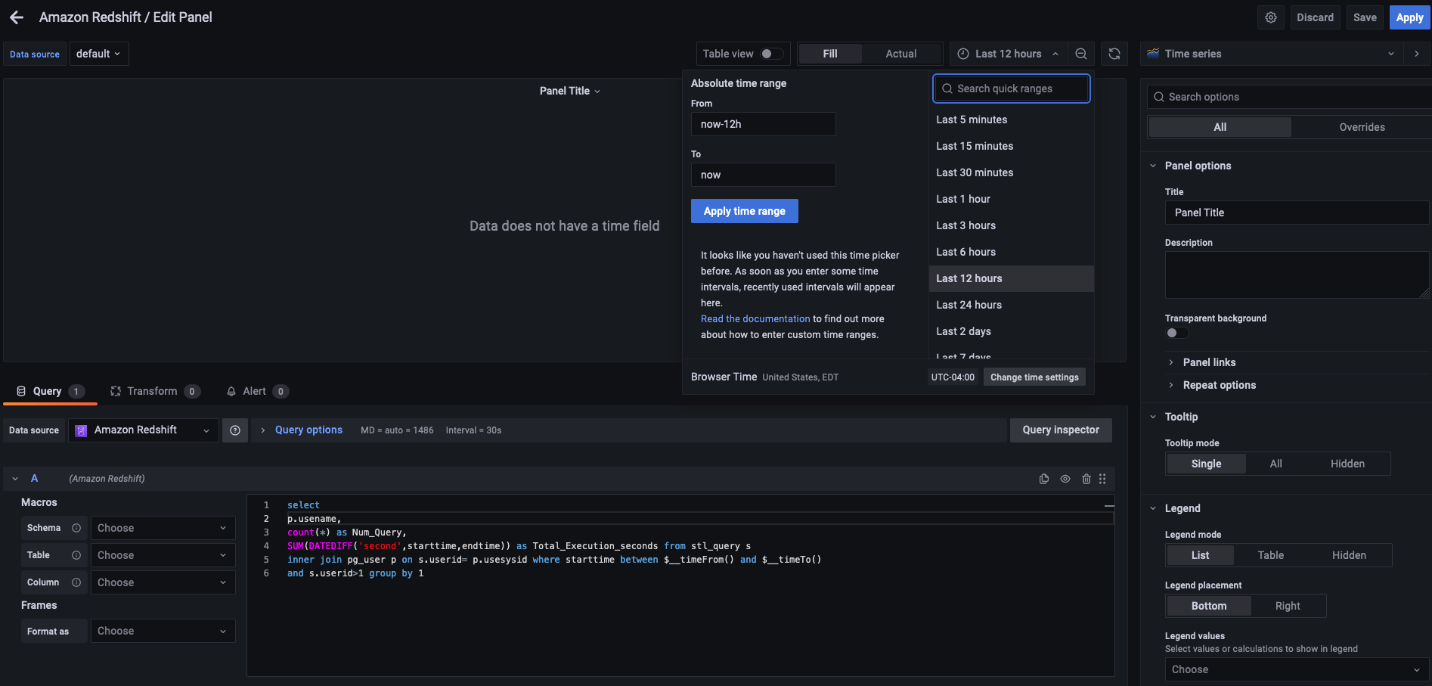
For this post, we use the default settings, but you can control and link the time range using the
$__timeFrom()and$__timeTo()macros; they’re bound with the time range control of your dashboard. For more information and details about the supported expressions, see Query Redshift data.
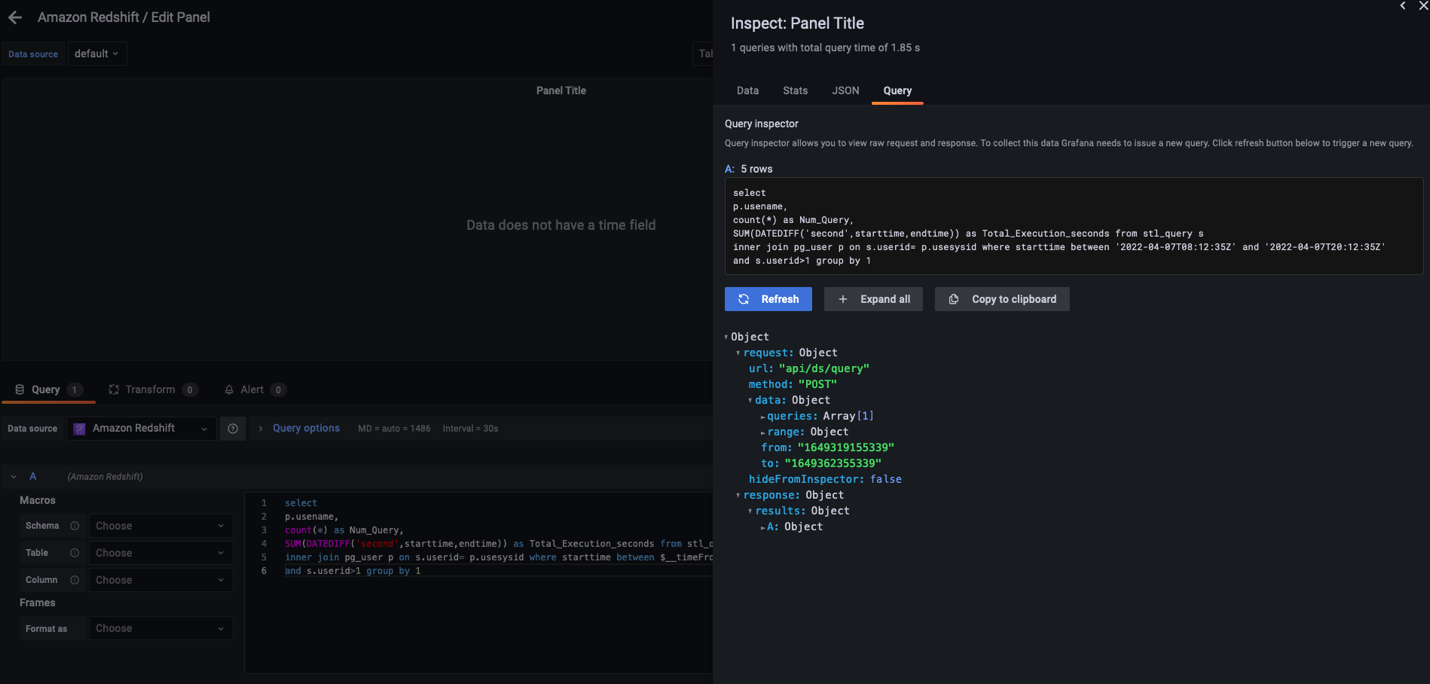
- To inspect the data, choose Query inspector to test the custom query outcome.
Amazon Managed Grafana supports a variety of visualizations. For this post, we create a bar chart. - On the Visualizations tab in the right pane, choose Bar chart.

- Enter a title and description for the custom chart, and leave all other properties as default.
For more information about supported properties, see Visualizations.

- Choose Save.
- In the pop-up window, enter a dashboard name and choose Save.
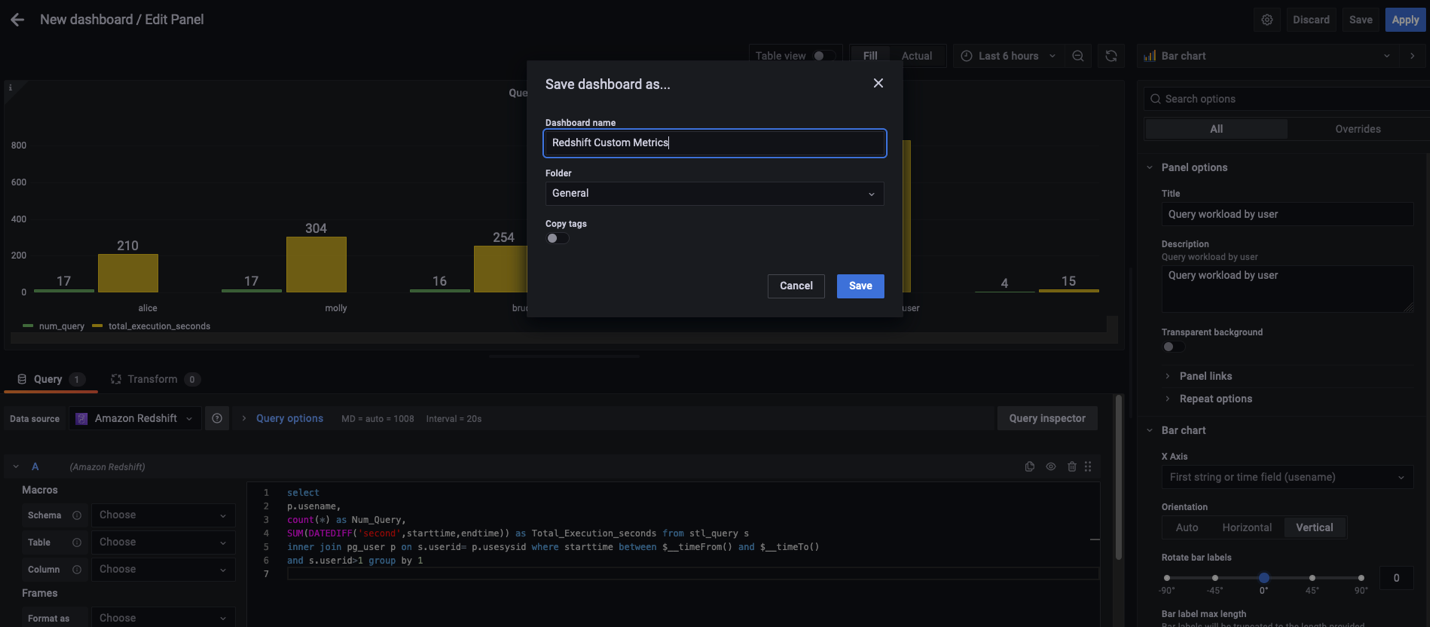
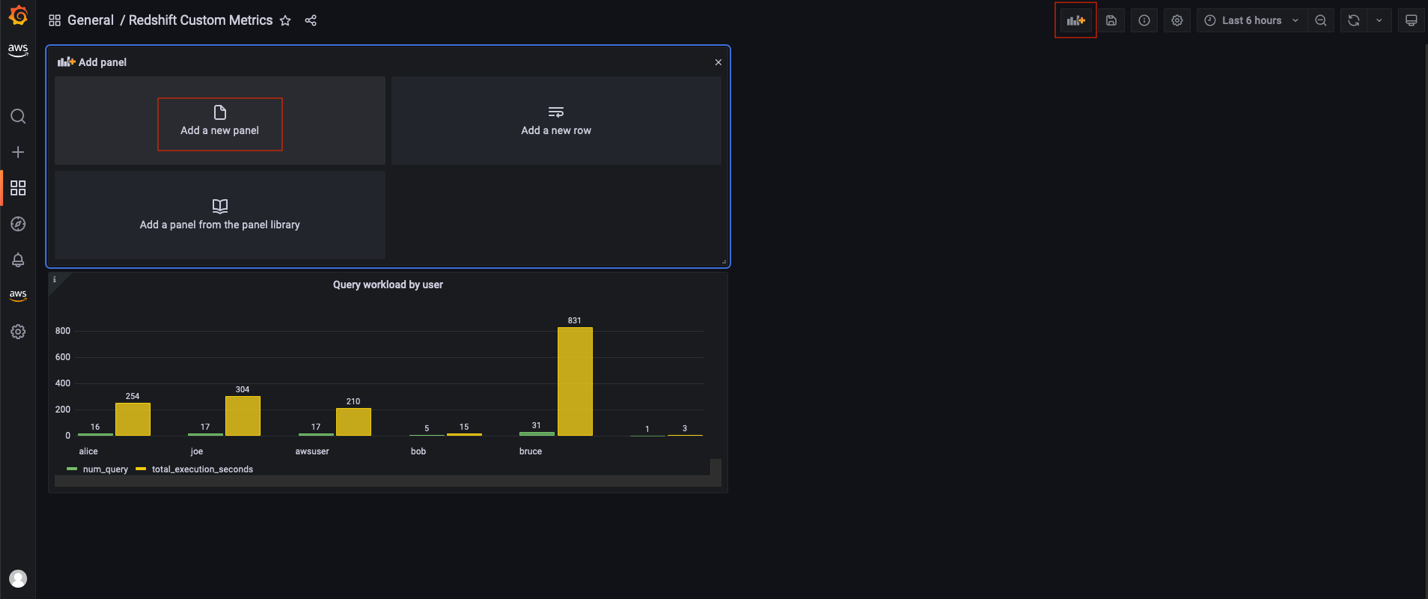
A new dashboard is created with a custom metric.

- To add more metrics, choose the Add panel icon, choose Add a new panel, and repeat the previous steps.
Clean up
To avoid incurring future charges, complete the following steps:
- Delete the Amazon Managed Grafana workspace.
- If you created a new Amazon Redshift cluster for this demonstration, delete the cluster.
Conclusion
In this post, we demonstrated how to use AWS SSO and Amazon Managed Grafana to create an operational view to monitor the health and performance of Amazon Redshift clusters. We learned how to extend your default dashboard by adding custom and insightful dashboards to your Grafana workspace.
We look forward to hearing from you about your experience. If you have questions or suggestions, please leave a comment.
About the Authors
 Tahir Aziz is an Analytics Solution Architect at AWS. He has worked with building data warehouses and big data solutions for over 13 years. He loves to help customers design end-to-end analytics solutions on AWS. Outside of work, he enjoys traveling and cooking.
 Shawn Sachdev is a Sr. Analytics Specialist Solutions Architect at AWS. He works with customers and provides guidance to help them innovate and build well-architected and high-performance data warehouses and implement analytics at scale on the AWS platform. Before AWS, he worked in several analytics and system engineering roles. Outside of work, he loves watching sports, and is an avid foodie and craft beer enthusiast.
 Ekta Ahuja is an Analytics Specialist Solutions Architect at AWS. She is passionate about helping customers build scalable and robust data and analytics solutions. Before AWS, she worked in several different data engineering and analytics roles. Outside of work, she enjoys baking, traveling, and board games.