AWS Big Data Blog
Create real-time clickstream sessions and run analytics with Amazon Kinesis Data Analytics, AWS Glue, and Amazon Athena
April 2024: The content of this post is no longer relevant and deprecated.
August 30, 2023: Amazon Kinesis Data Analytics has been renamed to Amazon Managed Service for Apache Flink. Read the announcement in the AWS News Blog and learn more.
Clickstream events are small pieces of data that are generated continuously with high speed and volume. Often, clickstream events are generated by user actions, and it is useful to analyze them.
For example, you can detect user behavior in a website or application by analyzing the sequence of clicks a user makes, the amount of time the user spends, where they usually begin the navigation, and how it ends. By tracking this user behavior in real time, you can update recommendations, perform advanced A/B testing, push notifications based on session length, and much more. To track and analyze these events, you need to identify and create sessions from them. The process of identifying events in the data and creating sessions is known as sessionization.
Capturing and processing data clickstream events in real time can be difficult. As the number of users and web and mobile assets you have increases, so does the volume of data. Amazon Kinesis provides you with the capabilities necessary to ingest this data in real time and generate useful statistics immediately so that you can take action.
When you run sessionization on clickstream data, you identify events and assign them to a session with a specified key and lag period. After each event has a key, you can perform analytics on them. The use cases for sessionization vary widely, and have different requirements. For example, you might need to identify and create sessions from events in web analytics to track user actions. Sessionization is also broadly used across many different areas, such as log data and IoT.
This blog post demonstrates how to identify and create sessions from real-time clickstream events and then analyze them using Amazon Kinesis Data Analytics.
Why did we choose Kinesis Data Analytics?
Clickstream data arrives continuously as thousands of messages per second receiving new events. When you analyze the effectiveness of new application features, site layout, or marketing campaigns, it is important to analyze them in real time so that you can take action faster.
To perform the sessionization in batch jobs, you could use a tool such as AWS Glue or Amazon EMR. But with daily schedules, queries and aggregation, it can take more resources and time because each aggregation involves working with large amounts of data. Performing sessionization in Kinesis Data Analytics takes less time and gives you a lower latency between the sessions generation. You can trigger real-time alerts with AWS Lambda functions based on conditions, such as session time that is shorter than 20 seconds, or a machine learning endpoint.
Identifying a session among thousands of clicks
A session is a short-lived and interactive exchange between two or more devices and/or users. For example, it can be a user browsing and then exiting your website, or an IoT device waking up to perform a job and then going back to sleep. These interactions result in a series of events that occur in sequence that start and end, or a session. A start and an end of a session can be difficult to determine, and are often defined by a time period without a relevant event associated with a user or device. A session starts when a new event arrives after a specified “lag” time period has passed without an event arriving. A session ends in a similar manner, when a new event does not arrive within the specified lag period.
This blog post relies on several other posts about performing batch analytics on SQL data with sessions. My favorite post on this subject is Finding User Session with SQL by Benn Stancil at Mode. This post takes advantage of SQL window functions to identify and build sessions from clickstream events.
ANSI added SQL window functions to the SQL standard in 2003 and has since expanded them. Window functions work naturally with streaming data and enable you to easily translate batch SQL examples to Kinesis Data Analytics.
In this use case, I group the events of a specific user as described in the following simplified example. In this example, I use distinct navigation patterns from three users to analyze user behavior. To begin, I group events by user ID to obtain some statistics from data, as shown following:

In this example, for “User ID 20,” the minimum timestamp is 2018-11-29 23:35:10 and the maximum timestamp is 2018-11-29 23:35:44. This provides a 34 seconds-long session, starting with action “B_10” and ending with action “A_02.” These “actions” are identification of the application’s buttons in this example.
Suppose that after several minutes, new “User ID 20” actions arrive. Would you consider them as running in the same session? A user can abort a navigation or start a new one. Also, applications often have timeouts. You have to decide what is the maximum session length to consider it a new session. A session can run anywhere from 20 to 50 seconds, or from 1 to 5 minutes.

There are other elements that you might want to consider, such as a client IP or a machine ID. These elements allow you to separate sessions that occur on different devices.
High-level solution overview
The end-to-end scenario described in this post uses Amazon Kinesis Data Streams to capture the clickstream data and Kinesis Data Analytics to build and analyze the sessions. The aggregated analytics are used to trigger real-time events on Lambda and then send them to Kinesis Data Firehose. Kinesis Data Firehose sends data to an Amazon S3 bucket, where it is ingested to a table by an AWS Glue crawler and made available for running queries with Amazon Athena. You can use this table for ad hoc analysis.
The following diagram shows an end-to-end sessionization solution.

- Data ingestion: You can use Kinesis Data Streams to build custom applications that process or analyze streaming data for specialized needs. Kinesis Data Streams can continuously capture and store terabytes of data per hour from hundreds of thousands of sources, such as website clickstreams, financial transactions, social media feeds, IT logs, and location-tracking events.
- Data sessionization: Kinesis Data Analytics is the easiest way to process streaming data in real time with standard SQL without having to learn new programming languages or processing frameworks. With Kinesis Data Analytics, you can query streaming data or build entire streaming applications using SQL, so that you can gain actionable insights and respond to your business and customer needs promptly.
- Data processing and storage: The sessionization stream is read from Kinesis Data Analytics using an AWS Lambda function. The function triggers two events: one real-time dashboard in Amazon CloudWatch and a second one to persist data with Kinesis Data Firehose.
- Data analysis: AWS Glue is used to crawl Amazon S3 and build or update metadata definition for Amazon Athena tables.
Amazon Athena is an interactive query service that makes it easy to analyze data in Amazon S3 using standard SQL. Athena provides connectivity to any application using JDBC or ODBC drivers.
- Data visualization: Amazon QuickSight is a visualization tool that is natively used to build dashboards over Amazon Athena data.
- Monitoring: Amazon CloudWatch is a tool that lets you monitor the streaming activities, such as the number of bytes processed or delivered per second, or the number of failures.
After you finish the sessionization stage in Kinesis Data Analytics, you can output data into different tools. For example, you can use a Lambda function to process the data on the fly and take actions such as send SMS alerts or roll back a deployment. To learn how to implement such workflows based on AWS Lambda output, see my other blog post Implement Log Analytics using Amazon Kinesis Data Analytics. In this post, we send data to Amazon CloudWatch, and build a real-time dashboard.
Lambda clickstream generator
To generate the workload, you can use a Python Lambda function with random values, simulating a beer-selling application.
The same user ID can have sessions on different devices, such as a tablet, a browser, or a phone application. This information is captured by the device ID. As a result, the data for the Lambda function payload has these parameters: a user ID, a device ID, a client event, and a client timestamp, as shown in the following example.
The following is the code for the Lambda function payload generator, which is scheduled using CloudWatch Events scheduled events:
As a result, the following payloads are sent to Kinesis Data Analytics:

Using window SQL functions in Kinesis Data Analytics
Grouping sessions lets us combine all the events from a given user ID or a device ID that occurred during a specific time period. Amazon Kinesis Data Analytics SQL queries in your application code execute continuously over in-application streams. You need to specify bounded queries using a window defined in terms of time or rows. These queries are called window SQL functions.
I had three available options for windowed query functions in Kinesis Data Analytics: sliding windows, tumbling windows, and stagger windows. I chose stagger window because it has some good features for the sessionization use case, as follows:
- Stagger windows open when the first event that matches a partition key condition arrives. So for each key, it evaluates its particular window as opposed to the other window functions that evaluate one unique window for all the partition keys matched.
- When dealing with clickstreams, you cannot rely on the order that events arrive in the stream, but when the stream was generated. Stagger windows handle the arrival of out-of-order events well. The time when the window is opened and when the window closes is considered based on the age specified, which is measured from the time when the window opened.
To partition by the timestamp, I chose to write two distinct SQL functions.
In Kinesis Data Analytics, SOURCE_SQL_STREAM_001 is by default the main stream from the source. In this case, it’s receiving the source payload from Kinesis Data Streams.
Kinesis Data Analytics SQL – Create a stream
The following function creates a stream to receive the query aggregation result:
Kinesis Data Analytics SQL – Using a SECOND interval “STEP” function
The following function creates the PUMP and inserts it as SELECT to STREAM:
Kinesis Data Analytics SQL – Using a MINUTE interval “FLOOR” function
The following code creates the PUMP and inserts as SELECT to STREAM:
Sessions
In Kinesis Data Analytics, you can view the resulting data transformed by the SQL, with the sessions identification and information. Session_ID is calculated by User_ID + (3 Chars) of DEVICE_ID + rounded Unix timestamp without the milliseconds.

Automated deployment with AWS CloudFormation
All the steps of this end-to-end solution are included in an AWS CloudFormation template. Fire up the template, add the code on your web server, and voilà, you get real-time sessionization.
This AWS CloudFormation template is intended to be deployed only in the us-east-1 Region.
Create the stack
Step 1: To get started, sign into the AWS Management Console, and then open the stagger window template.
Step 2: On the AWS CloudFormation console, choose Next, and complete the AWS CloudFormation parameters:
- Stack name: The name of the stack (blog-sessionization or sessions-blog)
- StreamName: sessionsblog
- Stream Shard Count: 1 or 2 (1 MB/s) per shard.
- Bucket Name: Change to a unique name, for example session-n-bucket-hhug123121.
- Buffer Interval: 60–900 seconds buffering hint for Kinesis Data Firehose before the data is send to Amazon S3 from Kinesis Data Firehose.
- Buffer Size: 1–128 MB per file, if the interval is not achieved first.
- Destination Prefix: Aggregated (internal folder of the bucket to save aggregated data).
- Base sessions on seconds or minutes: Choose which you want (minutes will start with 1 minute, seconds will start with 30 seconds).

Step 3: Check if the launch has completed, and if it has not, check for errors.
The most common error is when you point to an Amazon S3 bucket that already exists.

Process the data
Step 1: After the deployment, navigate to the solution on the Amazon Kinesis console.

Step 2: Go to the Kinesis Analytics applications page, and choose AnalyticsApp-blog-sessionizationXXXXX, as follows.

Step 3: Choose Run application to start the application.

Step 4: Wait a few seconds for the application to be available, and then choose Application details.

Step 5: On the Application details page, choose Go to SQL results.

Step 6: Examine the SQL code and SOURCE_SQL_STREAM, and change the INTERVAL if you’d like.

Step 7: Choose the Real-time analytics tab to check the DESTINATION_SQL_STREAM results.


Step 8: Check the Destination tab to view the AWS Lambda function as the destination to your aggregation.

Step 8: Check the CloudWatch real-time dashboard.
Open the Sessionization-<your cloudformation stack name> dashboard.
![]()
Check the number of “events” during the sessions, and the “session duration” behavior from a timeframe. Then you can make decisions, such as whether you need to roll back a new site layout or new features of your application.

Step 9: Open the AWS Glue console and run the crawler that the AWS CloudFormation template created for you.
Choose the crawler job, and then choose Run crawler.

Analyze the data
Step 1: After the job finishes, open the Amazon Athena console and explore the data.
On the Athena console, choose the sessionization database in the list. You should see two tables created based on the data in Amazon S3: rawdata and aggregated.

Step 2: Choose the vertical ellipsis (three dots) on the right side to explore each of the tables, as shown in the following screenshots.


Step 3: Create a view on the Athena console to query only today’s data from your aggregated table, as follows:
The successful query appears on the console as follows:

Step 4: Create a view to query only the current month data from your aggregated table, as in the following example:
The successful query appears as follows:

Step 5: Query data with the sessions grouped by the session duration ordered by sessions, as follows:
The query results appear as follows:

Visualize the data
Step 1: Open the Amazon QuickSight console.
If you have never used Amazon QuickSight, perform this setup first.
Step 2: Set up Amazon QuickSight account settings to access Athena and your S3 bucket.
First, select the Amazon Athena check box. Select the Amazon S3 check box to edit Amazon QuickSight access to your S3 buckets.

Choose the buckets that you want to make available, and then choose Select buckets.

Step 3: Choose Manage data.

Step 4: Choose NEW DATASET.
In the list of data sources, choose Athena.
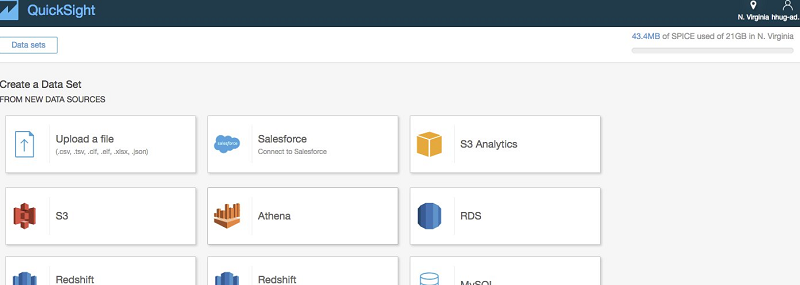
Step 5: Enter daily_session as your data source name.

Step 6: Choose the view that you created for daily sessions, and choose Select.

Step 7: Then you can choose to use either SPICE (cache) or direct query access.

Step 8: Choose beginnavigation and duration_sec as metrics.

Step 9: Choose +Add to add a new visualization.

Step 10: In Visual types, choose the Tree map graph type.
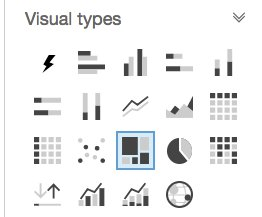
Step 11: For Group by, choose device_id; for Size, choose duration_sec (Sum); and for Color, choose events (Sum).

Summary
In this post, I described how to perform sessionization of clickstream events and analyze them in a serverless architecture. The use of a Kinesis Data Analytics stagger window makes the SQL code short and easy to write and understand. The integration between the services enables a complete data flow with minimal coding.
You also learned about ways to explore and visualize this data using Amazon Athena, AWS Glue, and Amazon QuickSight.
To learn more about the Amazon Kinesis family of use cases, check the Amazon Kinesis Big Data Blog page.
If you have questions or suggestions, please leave a comment below.
Do more with Amazon Kinesis Data Analytics
To explore other ways to gain insights using Kinesis Data Analytics, see Real-time Clickstream Anomaly Detection with Amazon Kinesis Analytics.
About the Author
 Hugo is an analytics and database specialist solutions architect at Amazon Web Services out of São Paulo (Brazil). He is currently engaged with several Data Lake and Analytics projects for customers in Latin America. He loves family time, dogs and mountain biking.
Audit History
Last reviewed and updated in April 2024 by Felix John| Associate Solutions Architect