AWS Big Data Blog
Gain insights into your Amazon Kinesis Data Firehose delivery stream using Amazon CloudWatch
February 9, 2024: Amazon Kinesis Data Firehose has been renamed to Amazon Data Firehose. Read the AWS What’s New post to learn more.
The volume of data being generated globally is growing at an ever-increasing pace. Data is generated to support an increasing number of use cases, such as IoT, advertisement, gaming, security monitoring, machine learning (ML), and more. The growth of these use cases drives both volume and velocity of streaming data and requires companies to capture, processes, transform, analyze, and load the data into various data stores in near-real time.
Amazon Kinesis Data Firehose is the easiest way to reliably load streaming data into data lakes, data stores, and analytics services. As the volume of the data you stream into Kinesis Data Firehose grows, you should gain insights and monitor the health of your data ingestion, transformation, and delivery.
In this post, we review the capabilities of using Firehose delivery stream metrics and the Amazon CloudWatch dashboard located on your Kinesis Data Firehose console. These capabilities allow you to create alerts when, for example, if the destination you configured in Kinesis Data Firehose has missing privileges, misconfigurations, or other issues, then Firehose will be able to detect it for you and report it as a failure. Other errors that might also occur are if you configured data transformation using Lambda and your Lambda function invocation failed, or if you have reached the Kinesis Firehose quota limits associated with your AWS account. In these cases, the data delivery from Kinesis Data Firehose to its destination may delay or fail. The CloudWatch alerts described in this post should help identify such cases in a timely manner.
This post also covers the different proactive actions that you can take when alarms are being triggered, such as submitting a request to increase quota or adding exponential backoff to your data producers.
Monitoring the delivery streams and taking these actions makes sure that data is delivered to your destinations without interruptions, enabling your business to gain insights in near-real time.
Monitor data ingestion to Kinesis Data Firehose
You can deliver data from your data producers to Kinesis Data Firehose through Amazon Kinesis Data Streams (as described later in this post), using Kinesis Agent, or directly using the Kinesis Data Firehose API operations PutRecord and PutRecordBatch. When you use Kinesis Data Streams as a data source, Kinesis Data Firehose scales automatically as your Kinesis Data Stream scales. When using the API operations for direct ingestion, you need to check the quota limits associated with your AWS account to avoid API requests throttling. Depending on your data producer behavior, this throttling can cause your data producers to retry the operation, which results in a delay of the data delivery to your destination. This throttling can also result in data loss if your data producers don’t implement a retry mechanism.
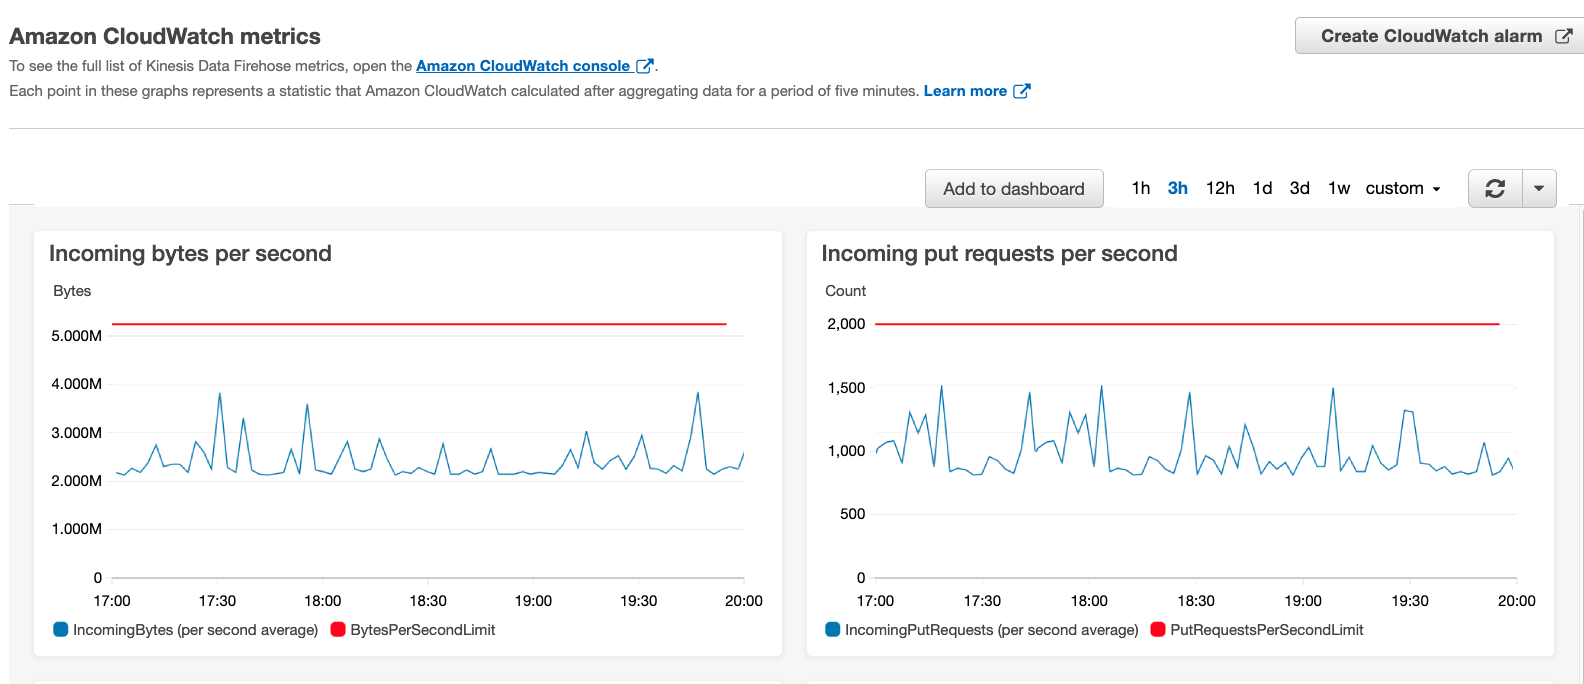
To gain deeper insights into Firehose delivery stream usage, we provide additional CloudWatch metrics that help you monitor and proactively scale quota limits: ThrottledRecords, RecordsPerSecondLimit, BytesPerSecondLimit, and PutRequestsPerSecondLimit. You can use the CloudWatch metrics dashboard (on the Monitoring tab on your Kinesis Data Firehose console) to easily visualize current usage and the quota limits.
When ingesting data directly to your delivery stream using PutRecord or PutRecordBatch, you should monitor the ThrottledRecords metric. This metric represents the number of records that were actually throttled because data ingestion exceeded one of the delivery stream limits. Kinesis Data Firehose calculates the throttling rates during the ingestion at a 1-second granularity, but the data ingestion metrics we mentioned are aggregated and emitted to CloudWatch every 5 minutes. Because of that, you can get throttled within that 5-minute window even if the data ingestion metrics don’t show that you reached the limit.
To receive alerts before your data producers are actually throttled, you can use additional CloudWatch metrics to alert you when you’re about to reach one of the delivery stream limits. You can achieve this by using the CloudWatch metrics IncomingRecords, IncomingBytes, and IncomingPutRequests. To check the limits of these metrics, refer to Amazon Kinesis Data Firehose Quota.
You can use the following ingestion metrics and their corresponding limit metrics to create a CloudWatch alarm:
- RecordsPerSecondLimit – The maximum number of records that can be ingested in a second (
IncomingRecords) - BytesPerSecondLimit – The maximum volume of data that can be ingested in a second (
IncomingBytes) - PutRequestsPerSecondLimit – The maximum number of successful
PutRecordandPutRecordBatchAPI requests that can be performed in a second (IncomingPutRequests)
To set up an alarm that alerts you when your ingestion rates are close to a quota, you should look for a percentage relationship between the ingestion rate and its corresponding limit. Because Kinesis Data Firehose emits metrics to CloudWatch every 5 minutes, you need to divide your metric with the 5-minute aggregation period, expressed as seconds (300). For example, to generate an alert when the incoming records per second rate is breaching 80% of your API operations quota, your CloudWatch alarm should be defined as follows:
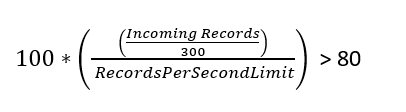
This gives you a way to proactively understand how close your ingestion rates are to your delivery stream limits, and the flexibility to modify the percentage levels based on your use case. To prevent a throttling bottleneck, you should separately monitor the three delivery stream ingestion rate metrics we discussed.
Define alerts using CloudWatch alarms
You can define CloudWatch alarms manually through the AWS Management Console or by using AWS CloudFormation. In this post we cover both methods, starting with the CloudFormation template.
The following template creates your CloudWatch alarms, which you can review and customize to suit your needs.
![]()
During the stack creation process, you provide the Firehose delivery stream name that you want to monitor, and the quota percentage where you want to be notified when it’s being breached, such as 80%. After the stack creation is successful, you have four CloudWatch alarms ready.
To create your CloudWatch alarms manually through the console, complete the following steps:
- On the Kinesis Data Firehose console, find your delivery stream.
- On the Monitoring tab, choose the more options icon of the metric you want to monitor (for this example, we monitor incoming records per second).
- On the options menu, choose View in metrics.
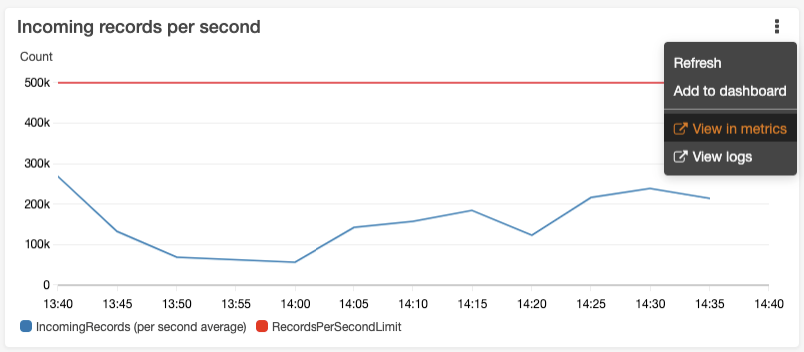
On the CloudWatch console, you can see a graph that represents your current API operations (blue line) and the quota limit (red line).
- To create an alarm, choose Math expression.
- Select Common and choose Percentage.
- For the metric name, enter
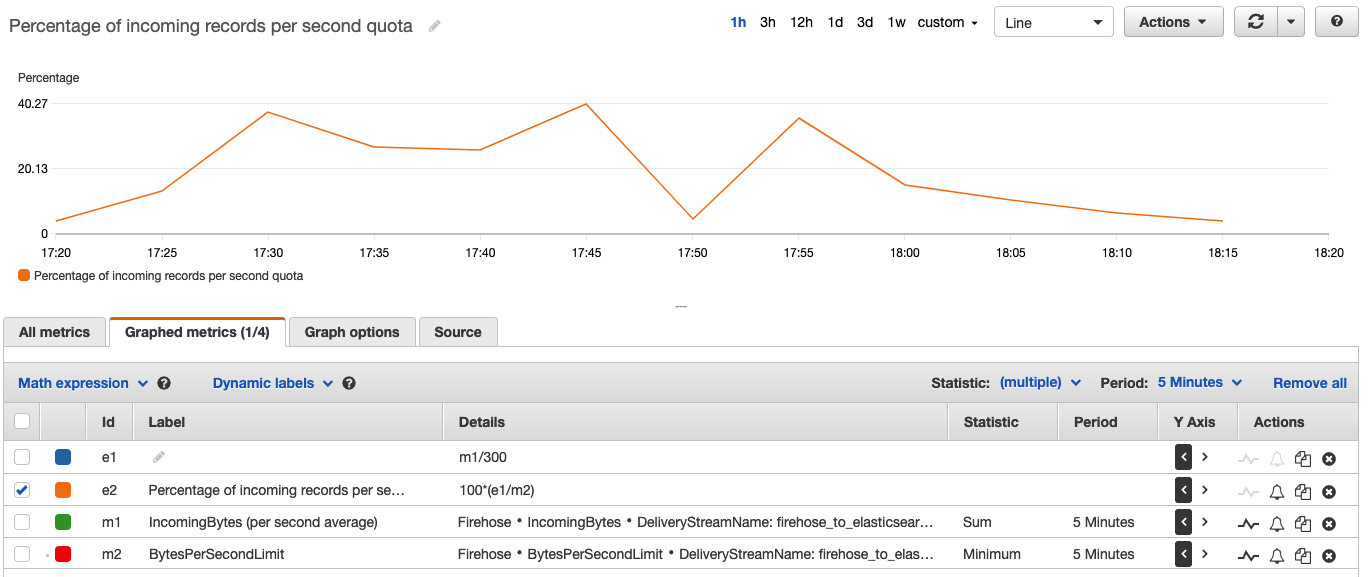
Percentage of records per second quota. - We use the metric expression
100*(e1/m2), which represents the formula 100*(BytesPerSecond/BytesPerSecondLimit) that was described earlier and reflects how close you are to your maximum in percentage. - Change the expression of the metric
e1fromMETRICS("m1")/300tom1/300.
You can also change the Y axis label.
- On the Graph options tab, under Left Y Axis, for Label, enter
Percentage.

- Now that you have the expression to use for the alarm, deselect every other expression and metric on the page.
The only expression selected should be the one you just created. You should now see the desired percentage, as in the following screenshot.
Create a CloudWatch alarm
You have now created an expression on your IncomingRecords and RecordsPerSecond quota, which you can use as a base for the alarm. With this, you can configure the tolerance level that your business use case requires.
- Choose the alarm icon next to your expression.
- In the Specify metric and conditions section, choose to receive an alert when the alarms breach the 75% limit.

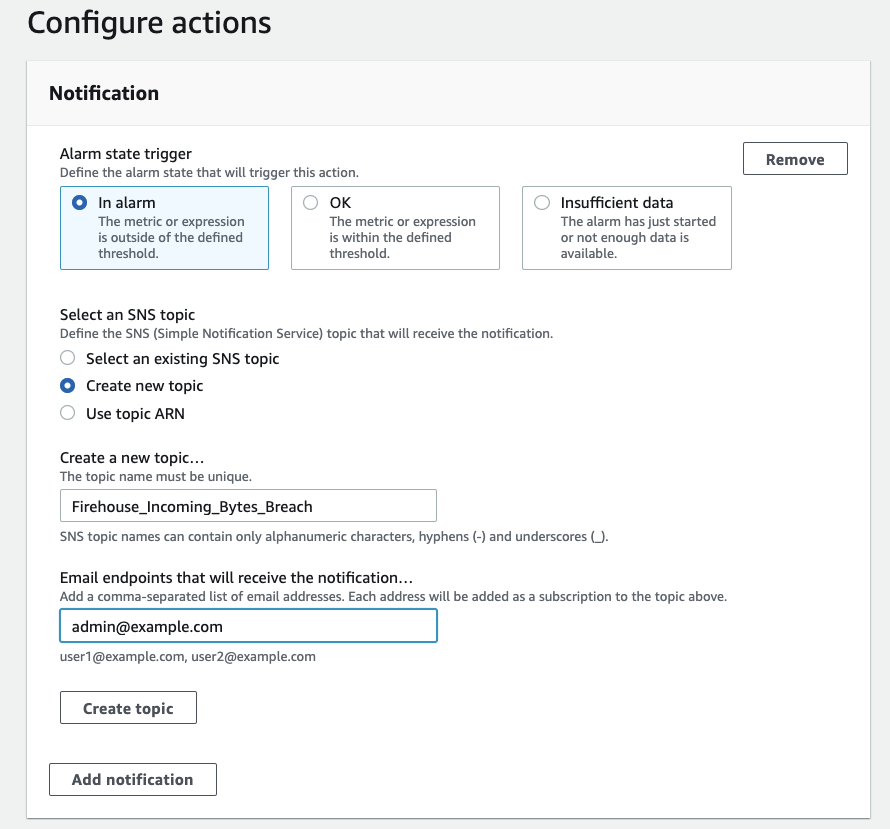
- In the Configure actions section, specify how to forward this alarm.
You can forward this alarm to your monitoring systems or to an email address through an Amazon Simple Notification Service (Amazon SNS) topic. For this post, we create a new SNS topic and subscribe admin@example.com to it.
Actions you can take when approaching the limits
When you’re getting close to your limits, you can take several different actions, which we describe in this section.
Request a service quota increase
One action you can take when seeing an alert is to request an increase in quota using the Amazon Kinesis Data Firehose Limits form. The three quotas scale proportionally, for example, if you increase the throughput quota in US East (N. Virginia), US West (Oregon), or Europe (Ireland) from 5 MiB/second to 10 MiB/second, the other two quotas increase from 2,000 requests/second to 4,000 requests/second and from 500,000 records/second to 1 million records/second. For more information about the service quota limits by AWS Region, see Amazon Kinesis Data Firehose Quota.
Use the PutRecordBatch API
If you use the API call PutRecord to deliver events to a Firehose data stream and you’re reaching the request/second quota limit, consider using the PutRecordBatch API operation. PutRecordBatch writes multiple data records into a delivery stream in a single call to achieve higher throughput per producer than writing single records, and reduces the amount of requests per second to your delivery stream.
Implement exponential backoff
As we mentioned before, even when you’re monitoring your delivery stream, you can still have bursts in your data stream. This could be caused by sudden spikes in usage of your system or external events like high trading activity in financial markets. To protect the producers from multiple throttled records, you should implement an exponential backoff. Exponential backoff is a commonly used algorithm that you can use to decrease the rate of submitting records to Kinesis Data Firehose when being throttled, so that the producer can slowly retry in order to successfully send the records.
The following are the Kinesis Data Firehose API responses when records are throttled:
- If you’re using the API operation
PutRecord, the returned error from the service isServiceUnavailableExceptionwith HTTP status code 500. - If you’re using
PutRecordBatch, you should iterate through theRequestResponsesarray and look for individual PutRecordBatchResponseEntry with ErrorCode 500 and ErrorMessageServiceUnavailableException. Also make sure to check the value of FailedPutCount in the response even when the API call succeeds.
In both cases, you should use exponential backoff and retry the operation. For more information about implementing exponential backoff, see Error retries and exponential backoff in AWS.
Use Kinesis Data Streams with Kinesis Data Firehose
Kinesis Data Streams is a massively scalable and durable real-time data streaming service. Your data producers can produce data directly to Kinesis Data Streams, and you can configure Kinesis Data Firehose to consume the data from Kinesis Data Streams and deliver it to your destination. When you use Kinesis Data Streams as the source for the Firehose delivery stream, the throughput limits mentioned before don’t apply. You don’t need to worry about throughput limits because Kinesis Data Firehose scales automatically to match the number of shards your Kinesis data stream has.
If you’re attaching a Firehose delivery stream as a consumer to your Kinesis data stream, and you have multiple consumer applications that read data from your Kinesis data stream such as AWS Lambda (see Using AWS Lambda with Amazon Kinesis), make sure that the total consumer applications aren’t breaching the shard’s 2 MB total read rate. This can cause the Kinesis data stream to throttle your consumer applications’ reading throughput, including Kinesis Data Firehose.
If more read capacity is required, some application consumers such as Lambda (see AWS Lambda supports Kinesis Data Streams Enhanced Fan-Out and HTTP/2 for faster streaming) or custom consumers that were developed with the Kinesis Consumer Library can support dedicated throughput from Kinesis Data Streams using enhanced fan-out, which currently isn’t supported by Kinesis Data Firehose. This feature provides these consumer applications isolated connection to the stream with 2 MB/second outbound throughput, so they don’t impact other consumer applications that are reading from the shards.
If you need more ingest capacity, you can easily scale up the number of shards in the stream using the console or the UpdateShardCount API.
Monitor data delivery of Kinesis Data Firehose
In case of network timeouts, missing privileges, or misconfigurations of your delivery stream such as incorrect destination configuration or AWS Key Management Service (AWS KMS) key ARN, the data delivery of your data from Kinesis Data Firehose to its destination may delay or fail. Errors might also occur if you configured data transformation using Lambda and your Lambda function invocation failed.
When Kinesis Data Firehose encounters delivery or processing errors, it retries until the configured retry duration expires. If the retry duration ends and the data hasn’t delivered successfully, Kinesis Data Firehose retains the data internally up to a maximum period of 24 hours. If the issue continues beyond the 24-hour maximum retention period, then Kinesis Data Firehose discards the data, resulting in a data loss.
When such data delivery issues persist, the data freshness metric, which is the age of the oldest record in Kinesis Data Firehose that hasn’t been delivered yet, constantly increases. To be alerted in such cases, you should create a CloudWatch alarm for when the data freshness metric exceeds the threshold of 4 hours. We also recommend setting an alarm to observe the historical p90 of the data freshness metric value. For example, set a certain tolerance level (such as 50% above the observed value) as an alarm threshold to detect data freshness variations.
You should monitor the data freshness metric that is relevant to your Kinesis Data Firehose destination, such as DeliveryToS3.DataFreshness, DeliveryToAmazonOpenSearchService.DataFreshness, DeliveryToSplunk.DataFreshness, or DeliveryToHttpEndpoint.DataFreshness. For more information, see Monitoring Kinesis Data Firehose Using CloudWatch Metrics.
If this alarm is triggered, you should take action to understand the root cause of the data freshness variation. A reason for such a variation could be a change in your Lambda transformation logic or configuration change of Lambda concurrency when using Kinesis Data Firehose data transformation. It could also be a result of change in the configuration parameters, format conversion schema, or ingested record type. For more information, see Data Freshness Metric Increasing or Not Emitted or you can submit a technical support request if needed.
When data delivery fails because of data transformation or an issue at the destination, in some cases you can find detailed failure logs in CloudWatch Logs, which can help you troubleshot the problem.
We also recommend monitoring the data delivery byte rate to your destination (for example, DeliveryToS3.Byte), which must match or exceed your data ingestion byte rate (IncomingBytes) on a sustained average basis to avoid increase of the data freshness metric and possible eventual data loss. If the observed delivery data rates are lower than the ingestion rates, consider tuning bottlenecks such as Lambda concurrency levels or your Lambda transformation logic if used with Kinesis Data Firehose data transformation.
To gain additional insights on the delivery of your data to its destination, we provide CloudWatch metrics you can monitor. For example, you can monitor the number of records delivered to keep track of data ingested into your destinations from Kinesis Data Firehose. For more information and additional metrics per destination, see Monitoring Kinesis Data Firehose Using CloudWatch Metrics.
Conclusion
In this post, we discussed the capabilities of using the Firehose delivery stream metrics and the CloudWatch dashboard located on your Kinesis Data Firehose console. This allows you to gain operational insights into the data ingestion and data delivery of your Firehose delivery stream, and also create CloudWatch alerts to be notified when one of your thresholds is breached. We also covered the different actions that you can take when these alarms are triggered, such as submitting a request to increase your quota or adding exponential backoff to your data producers.
Monitor your delivery streams and take these actions to make sure that your business data is delivered to your destinations without interruptions, enabling your business to gain insights in near-real time.
About the Author
 Alon Gendler is a Startup Solutions Architect Manager at Amazon Web Services. He works with AWS customers to help them solve complex problems and architect secure, resilient, scalable and high performance applications in the cloud. Alon is passionate about Data and helping customers get the most out of it.