AWS Big Data Blog
Run Amazon payments analytics with 750 TB of data on Amazon Redshift
The Amazon Payments Data Engineering team is responsible for data ingestion, transformation, and storage of a growing dataset of more than 750 TB. The team makes these services available to more than 300 business customers around the globe. These customers include managers from the product, marketing, and programs domains; as well as data scientists, business analysts, and software development engineers.
Customers consume data in both a scheduled and ad hoc fashion as part of the Amazon decision-making process. Customers also use data for building weekly, monthly, and quarterly business review metrics, which are ultimately reviewed by the leadership team.
We support various consumer payment business teams, including the following:
- Amazon Payment Products (credit cards, Shop with Points, Amazon Currency Converter, International Payment Products)
- Amazon Gift Cards
- Amazon Payment Acceptance & Customer Experience
- Amazon Business Payments
The Amazon Payments Analytics team also supports the algorithms that run customer payment product recommendations on the Amazon.com payment checkout page.
Challenges with legacy data warehouse
This section describes Amazon Payments Data Engineering analytical needs and the challenges the team faced using our former data warehouse solution, which AWS built atop a non-AWS third-party online analytical processing (OLAP) database.
Payment product launches and new marketplace extensions drove data volume growth that stretched our use-case beyond the legacy database’s capacities. The team met significant challenges scaling extract, transform, and load process (ETL) workloads. At the same time, we faced increased data availability delay risks and operational burdens.
More specific challenges included:
- Upserts did not scale well when data surpassed 10 million rows per batch. A key consumer product catalog dataset (with a record count over 6.5 billion rows), experienced increasingly frequent batch updates beyond the 10 million-row mark. We observed similar trends in a key customer order attributes dataset.
- When the analysis window exceeded six months, data aggregation either exceeded our internal service-level agreement (SLA) or became impractical, negatively impacting business analysis efforts. Business owners often seek to aggregate data based on custom attributes—for example, the number of successful transactions and monetary value by card type.
The legacy database‘s inability to isolate workloads and to scale compute workloads and storage separately created concerns across the user base.
- Central data warehouse allotted teams ~100 TB of storage for their datasets. Teams then joined datasets to the central data warehouse tables. But inefficient use of this shared data warehousing resource could negatively impact all other users. Also, finding the owners of those bad queries proved time-consuming.
- By throttling teams by storage on disk, we identified a pattern of a large number of smaller tables (> 30,000 tables). This issue became an administrative headache. Many of these tables had been created for internal use by specific teams within Amazon and weren’t useful to the customer base.
- Index corruption became an area of operational concern for larger tables, resulting in increasingly cumbersome rebuild schedules.
- Database administrator cycles became devoted to patch maintenance and monitoring the update cycle across the system.
Using Amazon Redshift as the new payments data warehouse
Amazon Payments Data Engineering started exploring better ways to fulfill the team’s growing analytical needs. We needed a fast, reliable, and scalable analytics platform that that would also provide a clear path forward for future data growth.
As part of a larger initiative at Amazon.com, central data warehouse implemented an encrypted, secure data lake pattern on Amazon Simple Storage Service (Amazon S3) for the core, critical datasets. The Payment Analytics team would consume data from the data lake. We wanted an analytics solution to meet the following criteria:
- Fast analytical processing
- Strong integration with Amazon S3 and other AWS services
- Affordable storage and compute rates
- Ability to participate in the ETL process
Amazon Payments Data Engineering chose Amazon Redshift because we observed the following traits during our testing:
- Bulk uploads run quickly. For our average width table, ~700 million rows could be inserted in under 30 minutes.
- Data upsert is exceptionally fast.
- Aggregation queries on datasets with tens of millions of rows can complete in a few seconds, leveraging the columnar nature of Amazon Redshift. The same job would run for several minutes on our legacy, row-oriented database.
- No DBA time allocated to maintain the database: Data engineers can easily perform backups, re-snapshot to a new cluster, set up alarms in case of cluster issues, and add new nodes.
- We can store data on Amazon S3: This data is accessible from multiple independent Amazon Redshift clusters through the Amazon Redshift Spectrum functionality, which also allows users to join external tables with tables created locally on Amazon Redshift. Amazon Redshift Spectrum can offload processing from the Amazon Redshift compute nodes to the Amazon Redshift Spectrum layer, freeing up compute cycles on the main cluster while storing the data on Amazon S3.
- Managed service conveniences enabled the team to exceed previous SLAs with relative ease. This trend continues with recently announced features like auto-vacuum.
- Users can choose Amazon Redshift compression at the column level, allowing higher compression rates than in row-oriented compression. Amazon Redshift offers mechanisms that recommend a compression algorithm for each column. These features enable faster querying and efficient storage of the data.
Sources of data and storage
Amazon Payments Data Engineering consumes data from different sources, such as PostgreSQL, Amazon DynamoDB live streams, and the Amazon.com data lake. Data from PostgreSQL databases are in relational format, whereas DynamoDB has key-value pairs. We translate the key-value pairs data to relational format and store in Amazon Redshift and Amazon S3. We store the most frequently accessed data in Amazon Redshift. Larger and less frequently accessed datasets are stored in Amazon S3 and accessed through Amazon Redshift Spectrum.
The Amazon.com data lake hosts more than 30,000 tables from different teams, such as Orders, Shipments, and Refunds. The Payment Analytics team frequently consumes from ~200 source tables in the data lake. As the need for Payments data has increased, the team built a data mart specific to payment products, which they leverage through both scheduled and one-time reports.
All small and midsize tables (usually meaning tables under 50 TB in size) load directly into Amazon Redshift from the data lake, which physically stores the data. By contrast, we do not store tables larger than 50 TB locally on Amazon Redshift. Instead, we pull from the data lake using Apache Hive on Amazon EMR, convert the format from TSV to ORC/Parquet, and store on Amazon S3.
We create external tables in Amazon Redshift to query the S3 data with Amazon Redshift Spectrum. Data conversion to a columnar format reduces the runtime for each analytical aggregation query. Storing the data on Amazon S3 reduces storage pressure on Amazon Redshift cluster.
Data Architecture
The following table illustrates the Amazon Redshift data architecture. As discussed earlier in this post, various Amazon data teams and services publish data to a central data lake built on Amazon S3. Clients use the Amazon Redshift and other tools to consume selected data, as shown in the following diagram:

Different components
- The Amazon.com data lake: Wanting to share data, almost all the teams in Amazon publish data to this data lake. Central data warehouse built this encrypted storage solution on top of Amazon S3. It stores metadata attached along with data files. Every dataset has a one-time dump and then incremental delta files. Teams often consume data lake data according to the following pattern:
- Physically copy the data into their own Amazon Redshift cluster. This method is highly efficient for the smaller and midsize tables accessed most frequently.
- Run analytical queries on datasets stored in the data lake using Amazon Redshift Spectrum. This method helps access larger, cold data files (generally larger than 50 TB), so you don’t have to scale up your Amazon Redshift cluster to store these larger data files.
- Use the AWS Gluecatalog to update your team’s Amazon S3 bucket metadata. Then, use Amazon EMR to pull the data, apply data transformation logic, change format, and store the final data in Amazon S3 bucket. This bucket can further be queried using Amazon Redshift Spectrum. These tools enhance efficiency when processing large datasets or performing additional/custom processing before consumption.
- Amazon Redshift clusters: Instead of the over-provisioned, monolithic model of the data-warehousing era, we now employ three Amazon Redshift clusters. Each cluster has a separate purpose and can be scaled independently. This model opens the door to additional cost savings through dynamic cluster size management.
- Staging cluster:
- Our dynamic data sources are in a transition state, moving from relational to non-relational data sources.
- The mechanism to pull data from the central data lake to Amazon Redshift storage also continues to evolve and remains resource-intensive.
- The Payment Analytics team naturally leans heavily on the payment-oriented datasets. Some transformational needs are unique to the team’s mission. This specialization leads the team to perform additional core dataset processing, particularly for data science and in-depth business analysis tasks.
- User cluster: Our internal business users wanted to create the tables in the public schema for their analysis. They also needed direct access for their ad hoc analysis. Although the SQL proficiency is high among the Payment Analytics users, we apply workload management (WLM) and query monitoring rules (QMR) in a unique way on this cluster, to allow broad but reasonable use of the system.
- Data-platform cluster: We execute transformations for datasets with a critical SLA on this cluster, loading the result of this work into both the User and Prod clusters.
- Staging cluster:
- Near real-time data ingestion: Few reports need real-time data collection from different services. Many of these services store the data in DynamoDB, with DynamoDB Streams enabled. We consume the data from these streams through an AWS Lambdafunction and Amazon Kinesis Data Firehose. Kinesis Data Firehose delivers the data to Amazon S3 and submits the copy command to load the data into Amazon Redshift. The Payment Analytics customers can consume this data as it’s loaded in 15-minute batches throughout the day.
- Alternate compute on Amazon EMR: We receive website clicks data through clickstream feeds, which can run into billions of records per day for each marketplace. Although large datasets are critical, costumers access them less frequently on Amazon Redshift. We chose Amazon S3 as a storage option and applied the transformations using Amazon EMR. This approach ensures that we do not fill up the database with massive cold data. At the same time, we enable data access on Amazon S3 using Amazon Redshift Spectrum, which provides similar query performance. As part of the Payment Analytics processing, the team converts native TSV data from Amazon EMR into either ORC or Parquet file formats. These columnar formats allow for faster and more efficient processing, especially when only a subset of the columns is required. To further improve performance, the column-oriented data layout on Amazon S3 renders with daily partitions. Amazon Redshift can then automatically pick which files need to be read, saving time and expense.
Schema management
We have a Prod schema that stores all the production tables. Only the platform team has access to alter this schema. We also provide payment product-specific sandboxes, accessible only to product-specific members. There is a generic public schema for any payments business data users. They can create, load, and truncate/drop the tables in this schema.
Database and ETL lookup
Here are a few facts about our Amazon Redshift database objects.
- Number of tables:
- Analytics prod DB: 6500
- Analytics staging DB: 390

The following section explains the need and shows a few stats about each of the three clusters we have.
A staging cluster:
- Is a landing zone for all the data from the central data warehouse data lake.
- Applies table retention to all the tables, as most of the ELT downstream jobs look for the last-updated date.
- Pulls just incremental data and stores in user and replica databases.
The following graphs show statistics for Table Count versus Size in TB and Table Count versus Rows in Billions:


User cluster
- Open to business users, and they can run their ad hoc queries.
- Stores all tables business users need to run their analytical queries.
- Users can create their tables in their schema, based on their need.
Data-platform cluster
- The data-platform cluster stores all the tables present in the business user cluster except the ones created for ad hoc analysis.
- It is used primarily to run ETL platform-related prod pipeline jobs.
- Amazon S3 archives the entire history of most such tables–except for snapshot tables like clickstream datasets.
The following tables offer detailed statistics about user and data-platform clusters:


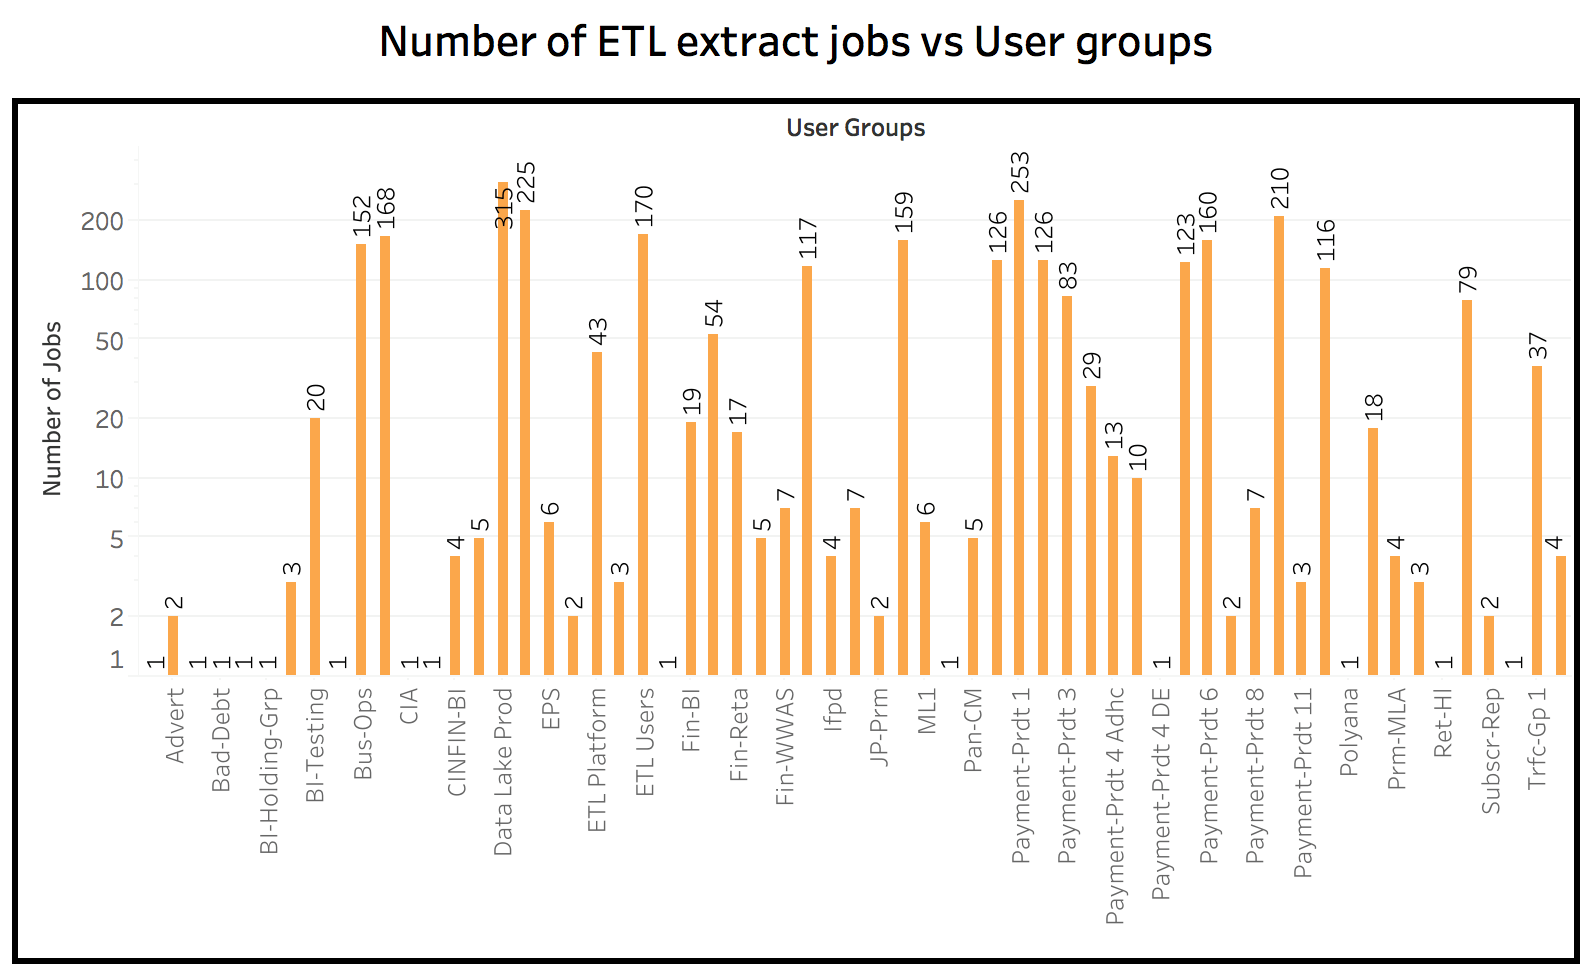
Scheduled ETL and loads on cluster
- Number of daily extraction ETL jobs: 2943
- Number of loading ETL jobs: 1655

Data processing stats per day by these clusters
- Total average daily load processed volume: 119 Billion
- Total average daily loading runtime: 11,415 mins.
- Total daily data extraction volume: 166 Billion
- Total daily date extraction runtimes: 25,585 mins.

Both scheduled and one-time query loads on the database
Daily query load on database by different database users.

Best practices
- Design tables with the right sort keys and distribution key: Query performance can benefit from minimizing the amount of data scanned (through the sort key columns) and the amount of data being redistributed (via the distribution key). If the joins are collocated, joining data is present on the same node, which results in less data movement over the network and better query performance. For more information, see Amazon Redshift Best Practices for Designing Tables.
- When writing the query, refer to Amazon Redshift Best Practices for Designing Queries.
- Change the loading strategy by splitting larger files into smaller files, and use bulk loads instead of serial inserts. For more information, see Amazon Redshift Best Practices for Loading Data.
- Configure the appropriate WLM setting to avoid system abuse by allocating right runtimes, memory, priority queues, and so on. For more information, see Tutorial: Configuring Workload Management (WLM) Queues to Improve Query Processing.
- Use Amazon Redshift Advisor to identify potential tables needing compression, tables with missing stats, uncompressed data loads, and further fine-tune your ETL pipelines. For more information, see Working Recommendations from Amazon Redshift Advisor.
- Amazon Redshift automatically performs the vacuum operation to reclaim wasted space from rows that were previously marked for deletion by UPDATE and DELETE operations. For clusters that experience heavy load, you can ensure that the VACUUM DELETE operation is running in the background by monitoring “Space reclaimed by auto vacuum delete” on the Cluster Performance tab on the AWS Management Console. For more information, see Vacuuming Tables.
- Analyze the SQLs submitted to DB and identify the pattern on table usage and expensive joins. It helps data engineers build more denormalized tables by pre-joining these tables and helping users access a single table, which is fast and efficient. For more information, see filters used.
Conclusion and next steps
Amazon Redshift clusters with total capacity of 1.15 PB, ~6500 tables, 4,500 scheduled ETL runs, 13,000 ETL queries a day, solve most of our business ETL needs. However, due to other business priorities, Amazon Payments Data Engineering has yet to take full advantage of some recently launched Amazon Redshift features—for example, enabling frequent snapshots at a customer schedule for additional disaster recovery or fine-tuning our maintenance window to reduce the impact on database availability during peak hours.
We would also like to evaluate concurrency scaling if there are sudden spikes in concurrent sessions during peak. Amazon Redshift now automatically updates table statistics and runs vacuuming delete statements. We would like to test the impact of this change, as the results may allow the retirement of certain custom scripts written for those functions.
About the authors
 Bishwabandhu Newton is a senior data engineer with Amazon Consumer Payments team. He has over 12 years of data warehousing experience, with 9+ years at Amazon.com.
 Matt Scaer is a Principal Data Warehousing Specialist Solution Architect, with over 20 years of data warehousing experience, with 11+ years at both AWS and Amazon.com.