AWS Big Data Blog
Simplify data analysis and collaboration with SQL Notebooks in Amazon Redshift Query Editor V2.0
Amazon Redshift Query Editor V2.0 is a web-based analyst workbench that you can use to author and run queries on your Amazon Redshift data warehouse. You can visualize query results with charts, and explore, share, and collaborate on data with your teams in SQL through a common interface.
With SQL Notebooks, Amazon Redshift Query Editor V2.0 simplifies organizing, documenting, and sharing of data analysis with SQL queries. The notebook interface enables users such as data analysts, data scientists, and data engineers to author SQL code more easily, organizing multiple SQL queries and annotations on a single document. You can also collaborate with your team members by sharing notebooks. With SQL Notebooks, you can visualize the query results using charts. SQL Notebooks support provides an alternative way to embed all queries required for a complete data analysis in a single document using SQL cells. Query Editor V2.0 simplifies development of SQL notebooks with query versioning and export/import features. You can use the built-in version history feature to track changes in your SQL and markdown cells. With the export/import feature, you can easily move your notebooks from development to production accounts or share with team members cross-Region and cross-account.
In this post, we demonstrate how to use SQL Notebooks using Query Editor V2.0 and walk you through some of the new features.
Use cases for SQL Notebooks
Customers want to use SQL notebooks when they want reusable SQL code with multiple SQL statements and annotations or documentations. For example:
- A data analyst might have several SQL queries to analyze data that create temporary tables, and runs multiple SQL queries in sequence to derive insights. They might also perform visual analysis of the results.
- A data scientist might create a notebook that creates some training data, creates a model, tests the model, and runs sample predictions.
- A data engineer might have a script to create schema and tables, load sample data, and run test queries.
Solution overview
For this post, we use the Global Database of Events, Language, and Tone (GDELT) dataset, which monitors news across the world, and the data is stored for every second of every day. This information is freely available as part of the Registry of Open Data on AWS.
For our use case, a data scientist wants to perform unsupervised learning with Amazon Redshift ML by creating a machine learning (ML) model, and then generate insights from the dataset, create multiple versions of the notebook, visualize using charts, and share the notebook with other team members.
Prerequisites
To use the SQL Notebooks feature, you must add a policy for SQL Notebooks to a principal—an AWS Identity and Access Management (IAM) user or role—that already has one of the Query Editor V2.0 managed policies. For more information, see Accessing the query editor V2.0.
Import the sample notebook
To import the sample SQL notebook in Query Editor V2.0, complete the following steps:
- Download the sample SQL notebook.
- On the Amazon Redshift console, choose Query Editor V2 in the navigation pane. Query Editor V2.0 opens in a new browser tab.
- To connect to a database, choose the cluster or workgroup name.
- If prompted, enter your connection parameters. For more information about different authentication methods, refer to Connecting to an Amazon Redshift database.
- When you’re connected to the database, choose Notebooks in the navigation pane.

- Choose Import to use the SQL notebook downloaded in the first step.
 After the notebook is imported successfully, it will be available under My notebooks.
 - To open the notebook, right-click on the notebook and choose Open notebook, or double-click on the notebook.

Perform data analysis
Let’s explore how you can run different queries from the SQL notebook cells for your data analysis.
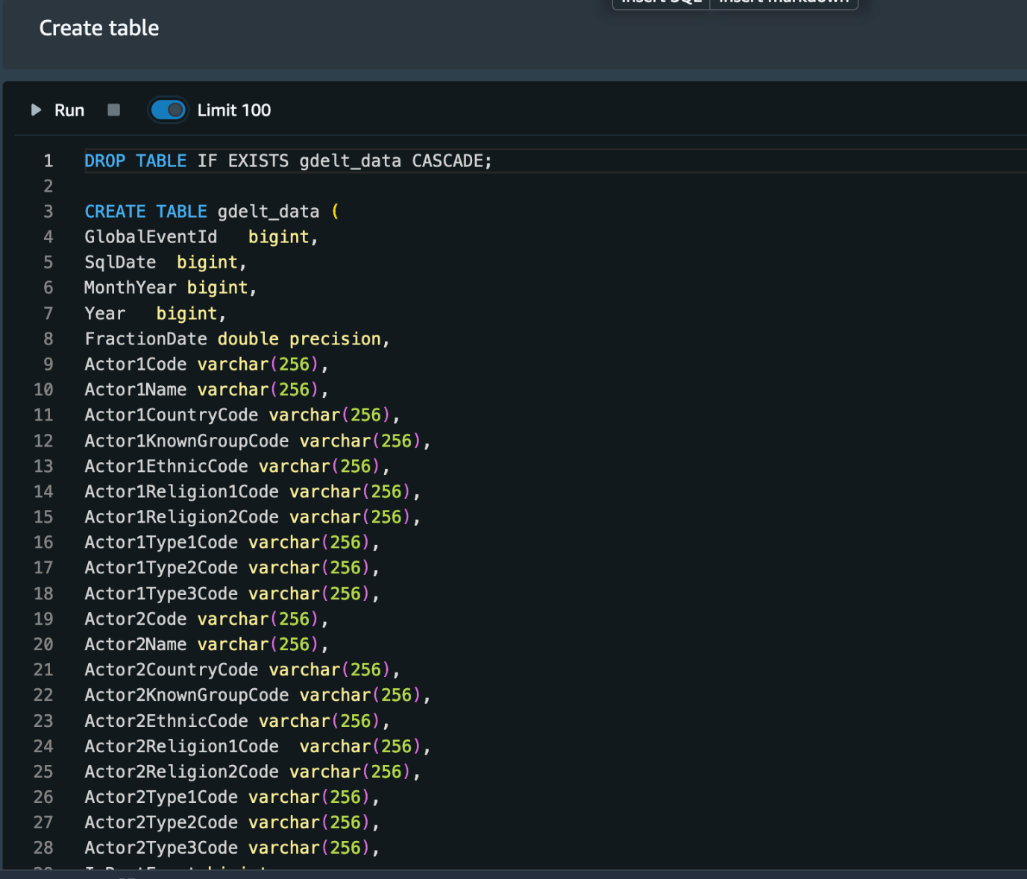
- Let’s start by creating the table.
- Next, we load data into the table using COPY command. Before running the COPY command in the notebook, you need to have a default IAM role attached to your Amazon Redshift cluster, or replace the default keyword with the IAM role ARN attached to the Amazon Redshift cluster:
For more information, refer to Creating an IAM role as default in Amazon Redshift.

Before we create the ML model, let’s examine the training data.

- Before you run the cell to create the ML model, replace the <your-amazon-s3-bucket-name> with the S3 bucket of your account to store intermediate results.
- Create the ML model.

- To check the status of the model, run the notebook cell Show status of the model. The model is ready when the Model State key value is
READY.

- Let’s identify the clusters associated with each
GlobalEventId.

- Let’s get insights into the data points assigned to one of the clusters.

In the preceding screenshot, we can observe the data points assigned to the clusters. We see clusters of events corresponding to interactions between the US and China (probably due to the establishment of diplomatic relations), between the US and RUS (probably corresponding to the SALT II Treaty), and those involving Iran (probably corresponding to the Iranian Revolution).
To add text and format the appearance to provide context and additional information for your data analysis tasks, you can add a markdown cell. For example, in our sample notebook, we have provided a description about the query in the markdown cells to make it simpler to understand. For more information on markdown cells, refer to Markdown Cells.
To run all the queries in the SQL notebook at once, choose Run all.

Add new SQL and markdown cells
To add new SQL queries or markdown cells, complete the following steps:
- After you open the SQL notebook, hover over the cell and choose Insert SQL to add a SQL cell or Insert markdown to add a markdown cell.

- The new cell is added before the cell you selected.
- You can also move the new cell after a specific cell by choosing the up or down icon.

Visualize notebook results using charts
Now that you can run the SQL notebook cell and get the results, you can display a graphic visualization of the results by using the chart option in Query Editor V2.0.
Let’s run the following query to get more insights into the data points assigned to one of the cluster’s results and visualize using charts.
To visualize the query results, configure a chart on the Results tab. Choose actor2name for the X-axis and totalarticles for the Y-axis dropdown. By default, the graph type is a bar chart.

Charts can be plotted in every cell, and each cell can have multiple result tables, but only one of them can have a chart. For more information about working with charts in Query Editor V2.0, refer to Visualizing query results.
Versioning in SQL Notebooks
Version control enables easier collaboration with your peers and reduces the risks of any mistakes. You can create multiple versions of the same SQL notebook by using the Save version option in Query Editor V2.0.
- In the navigation pane, choose Notebooks.
- Choose the SQL notebook that you want to open.
- Choose the options menu (three dots) and choose Save version.

SQL Notebooks creates the new version and displays a message that the version has been created successfully.

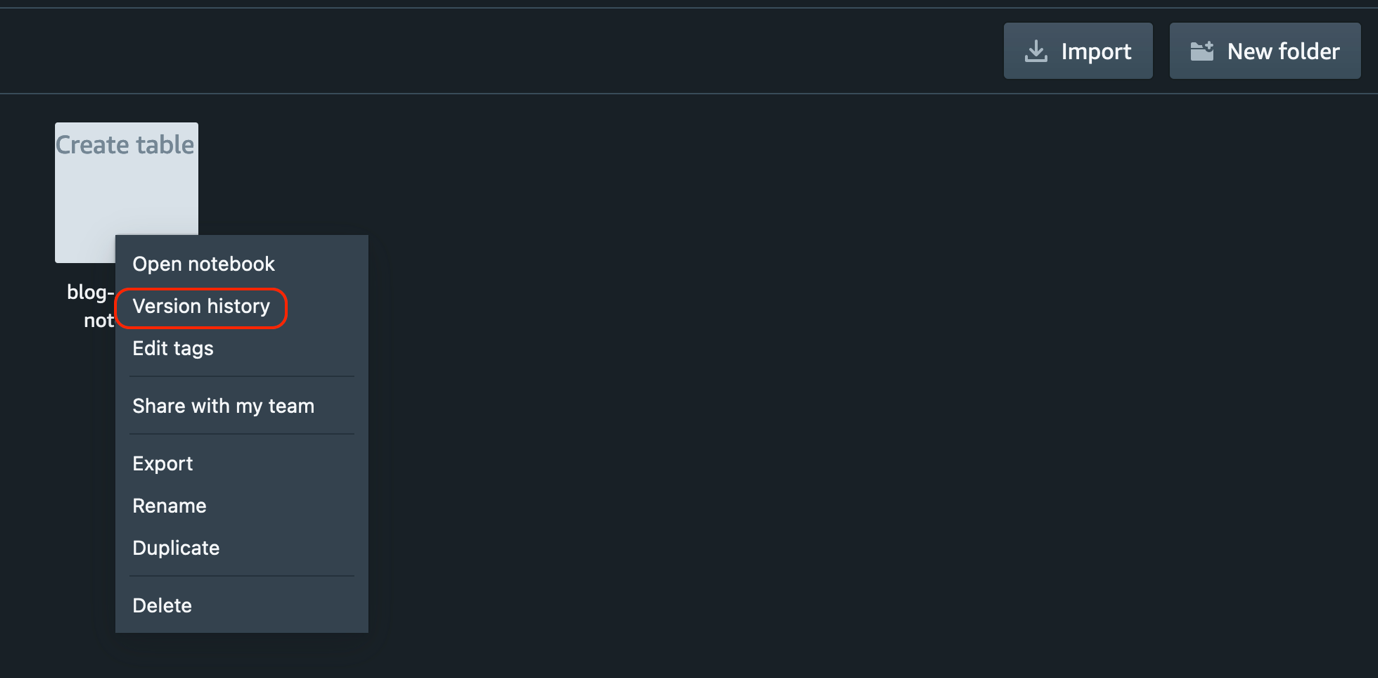
Now we can view the version history of the notebook. - Choose the SQL notebook for which you created the version (right-click) and choose Version history.
You can see a list of all the versions of the SQL notebook. - To revert to a specific version of the notebook, choose the version you want and choose Revert to version.

- To create a new notebook from a version, choose the version you want and choose Create a new notebook from the version.

Duplicate the SQL notebook
While working with your peers, you might need to share your notebook, but you also need to continue making changes in your notebook. To avoid any impact with the shared version, you can duplicate the notebook and keep working on your changes in the duplicate copy of the notebook.
- In the navigation pane, choose Notebooks.
- Open the SQL notebook.
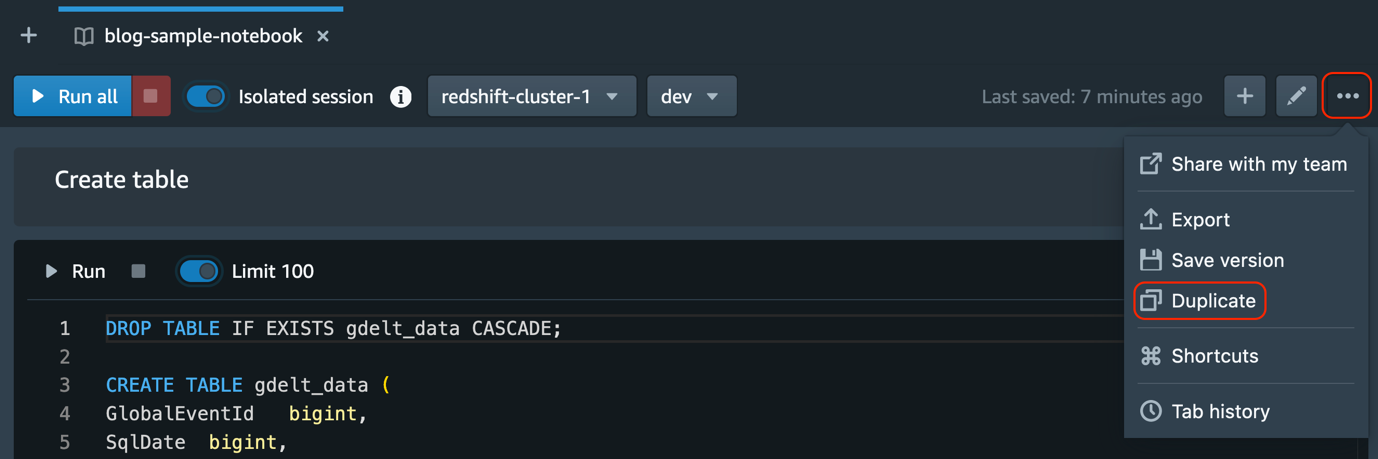
- Choose the options menu (three dots) and choose Duplicate.
- Provide the duplicate notebook name.
- Choose Duplicate.

Share notebooks
You often need to collaborate with other teams, for example to share the queries for integration testing, deploy the queries from dev to the production account, and more. You can achieve this by sharing the notebook with your team.
A team is defined for a set of users who collaborate and share Query Editor V2.0 resources. An administrator can create a team by adding a tag to an IAM role.
Before you start sharing your notebook with your team, make sure that you have the principal tag sqlworkbench-team set to the same value as the rest of your team members in your account. For example, an administrator might set the value to accounting-team for everyone in the accounting department. To create a team and tag, refer to Permissions required to use the query editor v2.0.
To share a SQL notebook with a team in the same account, complete the following steps:
- Open the SQL notebook you want to share.
- Choose the options menu (three dots) and choose Share with my team.
 Notebooks that are shared to the team can be seen in the notebooks panel’s Shared to my team tab, and the notebooks that are shared by the user can be seen in Shared by me tab.You can also use the export/import feature for other use cases. For example, developers can deploy notebooks from lower environments to production, or customers can provide a SAAS solution sharing notebook with their end-users in different accounts or Regions. Complete the following steps to export and import SQL notebooks:
 - Open the SQL notebook you want to share.
- Choose the options menu (three dots) and choose Export. SQL Notebooks saves the notebook in your local desktop as a .ipynb file.
- Import the notebook into another account or Region.
Run parameterized queries in a SQL notebook
Database users often need to pass parameters to the queries with different values at runtime. You can achieve this in SQL Notebooks by using parameterized queries. It can be defined in the query as ${parameter_name}, and when the query is run, it prompts to set a value for the parameter.
Let’s look at the following example, in which we pass the events_cluster parameter.
- Insert a SQL cell in the SQL notebook and add the following SQL query:
- When prompted, input the value of the parameter
events_cluster, (for this post, we set the value as 4). - Choose Run now to run the query.

The following screenshot shows the query results with the events_cluster parameter value set to 4.

Conclusion
In this post, we introduced SQL Notebooks using the Amazon Redshift Query Editor V2.0. We used a sample notebook to demonstrate how it simplifies data analysis tasks for a data scientist and how you can collaborate using notebooks with your team.
About the Authors
 Ranjan Burman is an Analytics Specialist Solutions Architect at AWS. He specializes in Amazon Redshift and helps customers build scalable analytical solutions. He has more than 15 years of experience in different database and data warehousing technologies. He is passionate about automating and solving customer problems with the use of cloud solutions.
 Erol Murtezaoglu, a Technical Product Manager at AWS, is an inquisitive and enthusiastic thinker with a drive for self-improvement and learning. He has a strong and proven technical background in software development and architecture, balanced with a drive to deliver commercially successful products. Erol highly values the process of understanding customer needs and problems in order to deliver solutions that exceed expectations.
 Cansu Aksu is a Frontend Engineer at AWS. She has several years of experience in building user interfaces that simplify complex actions and contribute to a seamless customer experience. In her career in AWS, she has worked on different aspects of web application development, including front end, backend, and application security.
 Andrei Marchenko is a Full Stack Software Development Engineer at AWS. He works to bring notebooks to life on all fronts—from the initial requirements to code deployment, from the database design to the end-user experience. He uses a holistic approach to deliver the best experience to customers.
 Debu Panda is a Senior Manager, Product Management at AWS. He is an industry leader in analytics, application platform, and database technologies, and has more than 25 years of experience in the IT world. Debu has published numerous articles on analytics, enterprise Java, and databases and has presented at multiple conferences such as re:Invent, Oracle Open World, and Java One. He is lead author of the EJB 3 in Action (Manning Publications 2007, 2014) and Middleware Management (Packt, 2009)