AWS Compute Blog
Building well-architected serverless applications: Optimizing application costs
This series of blog posts uses the AWS Well-Architected Tool with the Serverless Lens to help customers build and operate applications using best practices. In each post, I address the serverless-specific questions identified by the Serverless Lens along with the recommended best practices. See the introduction post for a table of contents and explanation of the example application.
COST 1. How do you optimize your serverless application costs?
Design, implement, and optimize your application to maximize value. Asynchronous design patterns and performance practices ensure efficient resource use and directly impact the value per business transaction. By optimizing your serverless application performance and its code patterns, you can directly impact the value it provides, while making more efficient use of resources.
Serverless architectures are easier to manage in terms of correct resource allocation compared to traditional architectures. Due to its pay-per-value pricing model and scale based on demand, a serverless approach effectively reduces the capacity planning effort. As covered in the operational excellence and performance pillars, optimizing your serverless application has a direct impact on the value it produces and its cost. For general serverless optimization guidance, see the AWS re:Invent talks, “Optimizing your Serverless applications” Part 1 and Part 2, and “Serverless architectural patterns and best practices”.
Required practice: Minimize external calls and function code initialization
AWS Lambda functions may call other managed services and third-party APIs. Functions may also use application dependencies that may not be suitable for ephemeral environments. Understanding and controlling what your function accesses while it runs can have a direct impact on value provided per invocation.
Review code initialization
I explain the Lambda initialization process with cold and warm starts in “Optimizing application performance – part 1”. Lambda reports the time it takes to initialize application code in Amazon CloudWatch Logs. As Lambda functions are billed by request and duration, you can use this to track costs and performance. Consider reviewing your application code and its dependencies to improve the overall execution time to maximize value.
You can take advantage of Lambda execution environment reuse to make external calls to resources and use the results for subsequent invocations. Use TTL mechanisms inside your function handler code. This ensures that you can prevent additional external calls that incur additional execution time, while preemptively fetching data that isn’t stale.
Review third-party application deployments and permissions
When using Lambda layers or applications provisioned by AWS Serverless Application Repository, be sure to understand any associated charges that these may incur. When deploying functions packaged as container images, understand the charges for storing images in Amazon Elastic Container Registry (ECR).
Ensure that your Lambda function only has access to what its application code needs. Regularly review that your function has a predicted usage pattern so you can factor in the cost of other services, such as Amazon S3 and Amazon DynamoDB.
Required practice: Optimize logging output and its retention
Considering reviewing your application logging level. Ensure that logging output and log retention are appropriately set to your operational needs to prevent unnecessary logging and data retention. This helps you have the minimum of log retention to investigate operational and performance inquiries when necessary.
Emit and capture only what is necessary to understand and operate your component as intended.
With Lambda, any standard output statements are sent to CloudWatch Logs. Capture and emit business and operational events that are necessary to help you understand your function, its integration, and its interactions. Use a logging framework and environment variables to dynamically set a logging level. When applicable, sample debugging logs for a percentage of invocations.
In the serverless airline example used in this series, the booking service Lambda functions use Lambda Powertools as a logging framework with output structured as JSON.
Lambda Powertools is added to the Lambda functions as a shared Lambda layer in the AWS Serverless Application Model (AWS SAM) template. The layer ARN is stored in Systems Manager Parameter Store.
Parameters:
  SharedLibsLayer:
    Type: AWS::SSM::Parameter::Value<String>
    Description: Project shared libraries Lambda Layer ARN
Resources:
    ConfirmBooking:
        Type: AWS::Serverless::Function
        Properties:
            FunctionName: !Sub ServerlessAirline-ConfirmBooking-${Stage}
            Handler: confirm.lambda_handler
            CodeUri: src/confirm-booking
            Layers:
                - !Ref SharedLibsLayer
            Runtime: python3.7
…
The LOG_LEVEL and other Powertools settings are configured in the Globals section as Lambda environment variable for all functions.
Globals:
    Function:
        Environment:
            Variables:
                POWERTOOLS_SERVICE_NAME: booking
                POWERTOOLS_METRICS_NAMESPACE: ServerlessAirline
                LOG_LEVEL: INFO
For Amazon API Gateway, there are two types of logging in CloudWatch: execution logging and access logging. Execution logs contain information that you can use to identify and troubleshoot API errors. API Gateway manages the CloudWatch Logs, creating the log groups and log streams. Access logs contain details about who accessed your API and how they accessed it. You can create your own log group or choose an existing log group that could be managed by API Gateway.
Enable access logs, and selectively review the output format and request fields that might be necessary. For more information, see “Setting up CloudWatch logging for a REST API in API Gateway”.

API Gateway logging
Enable AWS AppSync logging which uses CloudWatch to monitor and debug requests. You can configure two types of logging: request-level and field-level. For more information, see “Monitoring and Logging”.

AWS AppSync logging
Define and set a log retention strategy
Define a log retention strategy to satisfy your operational and business needs. Set log expiration for each CloudWatch log group as they are kept indefinitely by default.
For example, in the booking service AWS SAM template, log groups are explicitly created for each Lambda function with a parameter specifying the retention period.
Parameters:
    LogRetentionInDays:
        Type: Number
        Default: 14
        Description: CloudWatch Logs retention period
Resources:
    ConfirmBookingLogGroup:
        Type: AWS::Logs::LogGroup
        Properties:
            LogGroupName: !Sub "/aws/lambda/${ConfirmBooking}"
            RetentionInDays: !Ref LogRetentionInDays
The Serverless Application Repository application, auto-set-log-group-retention can update the retention policy for new and existing CloudWatch log groups to the specified number of days.
For log archival, you can export CloudWatch Logs to S3 and store them in Amazon S3 Glacier for more cost-effective retention. You can use CloudWatch Log subscriptions for custom processing, analysis, or loading to other systems. Lambda extensions allows you to process, filter, and route logs directly from Lambda to a destination of your choice.
Good practice: Optimize function configuration to reduce cost
Benchmark your function using a different set of memory size
For Lambda functions, memory is the capacity unit for controlling the performance and cost of a function. You can configure the amount of memory allocated to a Lambda function, between 128 MB and 10,240 MB. The amount of memory also determines the amount of virtual CPU available to a function. Benchmark your AWS Lambda functions with differing amounts of memory allocated. Adding more memory and proportional CPU may lower the duration and reduce the cost of each invocation.
In “Optimizing application performance – part 2”, I cover using AWS Lambda Power Tuning to automate the memory testing process to balances performance and cost.
Best practice: Use cost-aware usage patterns in code
Reduce the time your function runs by reducing job-polling or task coordination. This avoids overpaying for unnecessary compute time.
Decide whether your application can fit an asynchronous pattern
Avoid scenarios where your Lambda functions wait for external activities to complete. I explain the difference between synchronous and asynchronous processing in “Optimizing application performance – part 1”. You can use asynchronous processing to aggregate queues, streams, or events for more efficient processing time per invocation. This reduces wait times and latency from requesting apps and functions.
Long polling or waiting increases the costs of Lambda functions and also reduces overall account concurrency. This can impact the ability of other functions to run.
Consider using other services such as AWS Step Functions to help reduce code and coordinate asynchronous workloads. You can build workflows using state machines with long-polling, and failure handling. Step Functions also supports direct service integrations, such as DynamoDB, without having to use Lambda functions.
In the serverless airline example used in this series, Step Functions is used to orchestrate the Booking microservice. The ProcessBooking state machine handles all the necessary steps to create bookings, including payment.
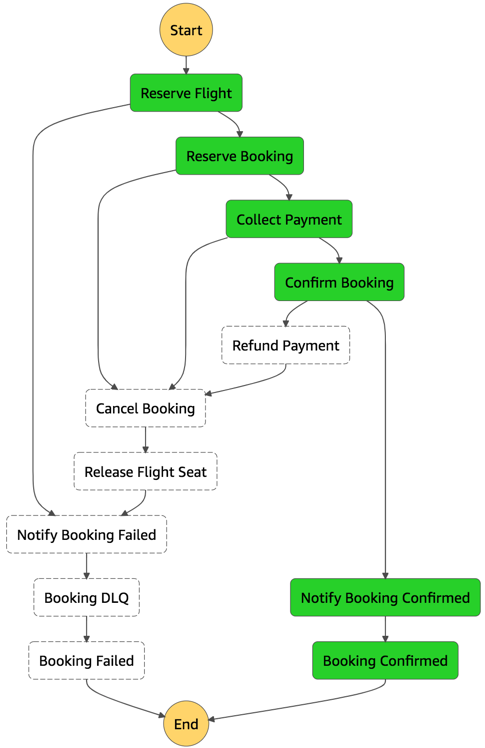
Booking service state machine
To reduce costs and improves performance with CloudWatch, create custom metrics asynchronously. You can use the Embedded Metrics Format to write logs, rather than the PutMetricsData API call. I cover using the embedded metrics format in “Understanding application health” – part 1 and part 2.
For example, once a booking is made, the logs are visible in the CloudWatch console. You can select a log stream and find the custom metric as part of the structured log entry.

Custom metric structured log entry
CloudWatch automatically creates metrics from these structured logs. You can create graphs and alarms based on them. For example, here is a graph based on a BookingSuccessful custom metric.

CloudWatch metrics custom graph
Consider asynchronous invocations and review run away functions where applicable
Take advantage of Lambda’s event-based model. Lambda functions can be triggered based on events ingested into Amazon Simple Queue Service (SQS) queues, S3 buckets, and Amazon Kinesis Data Streams. AWS manages the polling infrastructure on your behalf with no additional cost. Avoid code that polls for third-party software as a service (SaaS) providers. Rather use Amazon EventBridge to integrate with SaaS instead when possible.
Carefully consider and review recursion, and establish timeouts to prevent run away functions.
Conclusion
Design, implement, and optimize your application to maximize value. Asynchronous design patterns and performance practices ensure efficient resource use and directly impact the value per business transaction. By optimizing your serverless application performance and its code patterns, you can reduce costs while making more efficient use of resources.
In this post, I cover minimizing external calls and function code initialization. I show how to optimize logging output with the embedded metrics format, and log retention. I recap optimizing function configuration to reduce cost and highlight the benefits of asynchronous event-driven patterns.
This post wraps up the series, building well-architected serverless applications, where I cover the AWS Well-Architected Tool with the Serverless Lens . See the introduction post for links to all the blog posts.
For more serverless learning resources, visit Serverless Land.