AWS Compute Blog
Investigating spikes in AWS Lambda function concurrency
This post is courtesy of Ian Carlson, Principal Solutions Architect – AWS
As mentioned in an earlier post, a key benefit of serverless applications is the ease with which they can scale to meet traffic demands or requests. AWS Lambda is at the core of this platform.
Although this flexibility is hugely beneficial for our customers, sometimes an errant bit of code or upstream scaling can lead to spikes in concurrency. Unwanted usage can increase costs, pressure downstream systems, and throttle other functions in the account. Administrators new to serverless technologies need to leverage different metrics to manage their environment. In this blog, I walk through a sample scenario where I’m getting API errors. I trace those errors up through Amazon CloudWatch logs and leverage CloudWatch Metrics to understand what is happening in my environment. Finally, I show you how to set up alerts to reduce throttling surprises.
In my environment, I have a few Lambda functions configured. The first function is from Chris Munns’ concurrency blog, called concurrencyblog. I set up that function to execute behind an API hosted on Amazon API Gateway. In the background, I’m simulating activity with another function. This exercise uses the services in the following image.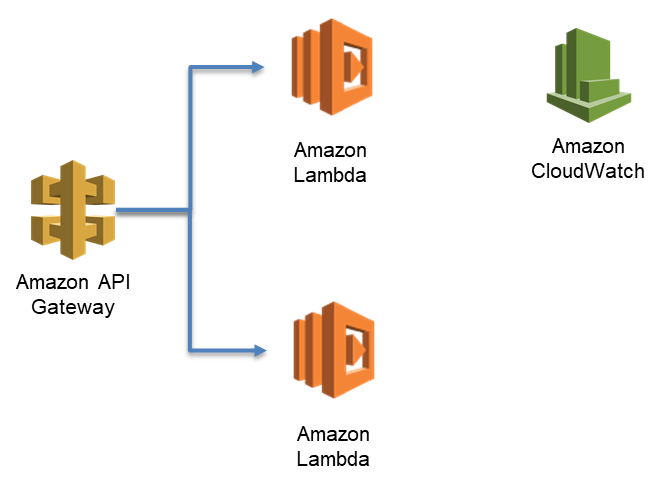
To start, I make an API Gateway call to invoke the concurrencyblog function.
curl -i -XGET https://XXXXXXXX.execute-api.us-east-2.amazonaws.com/prod/concurrencyblogI get the following output.
HTTP/2 502
content-type: application/json
content-length: 36
date: Wed, 01 Aug 2018 14:46:03 GMT
x-amzn-requestid: 9d5eca92-9599-11e8-bb13-dddafe0dbaa3
x-amz-apigw-id: K8ocOG_iiYcFa_Q=
x-cache: Error from cloudfront
via: 1.1 cb9e55028a8e7365209ebc8f2737b69b.cloudfront.net (CloudFront)
x-amz-cf-id: fk-gvFwSan8hzBtrC1hC_V5idaSDAKL9EwKDq205iN2RgQjnmIURYg==

{"message": "Internal server error"}
Hmmm, a 502 error. That shouldn’t happen. I don’t know the cause, but I configured logging for my API, so I can search for the requestid in CloudWatch logs. I navigate to the logs, select Search Log Group, and enter the x-amzn-requestid, enclosed in double quotes.
My API is invoking a Lambda function, and it’s getting an error from Lambda called ConcurrentInvocationLimitExceeded. This means my Lambda function was throttled. If I navigate to the function in the Lambda console, I get a similar message at the top.
If I scroll down, I observe that I don’t have throttling configured, so this must be coming from a different function or functions.
Using CloudWatch forensics
Lambda functions report lots of metrics in CloudWatch to tell you how they’re doing. Three of the metrics that I investigate here are Invocations, Duration, and ConcurrentExecutions. Invocations is incremented any time a Lambda function executes and is recorded for all functions and by individual functions. Duration is recorded to tell you how long Lambda functions take to execute. ConcurrentExecutions reports how many Lambda functions are executing at the same time and is emitted for the entire account and for functions that have a concurrency reservation set. Lambda emits CloudWatch metrics whenever there is Lambda activity in the account.
Lambda reports concurrency metrics for my account under AWS/Lambda/ConcurrentExecutions. To begin, I navigate to the Metrics pane of the CloudWatch console and choose Lambda on the All metrics tab.

Next, I choose Across All Functions.
Then I choose ConcurrentExecutions.
I choose the Graphed metrics tab and change Statistic from Average to Maximum, which shows me the peak concurrent executions in my account. For Period, I recommend reviewing 1-minute period data over the previous 2 weeks. After 2 weeks, the precision is aggregated over 5 minutes, which is a long time for Lambda!
In my test account, I find a concurrency spike at 14:46 UTC with 1000 concurrent executions.
Next, I want to find the culprit for this spike. I go back to the All metrics tab, but this time I choose By Function Name and enter Invocations in the search field. Then I select all of the functions listed.
The following image shows that BadLambdaConcurrency is the culprit.
It seems odd that there are only 331 invocations during that sample in the graph, so let’s dig in. Using the same method as before, I add the Duration metric for BadLambdaConcurrency. On average, this function is taking 30 seconds to complete, as shown in the following image.
Because there are 669 invocations the previous minute and the function is taking, on average, 30 seconds to complete, the next minute’s invocations (331) drives the concurrency up to 1000. Lambda functions can execute very quickly, so exact precision can be challenging, even over a 1-minute time period. However, this gives you a reasonable indication of the troublesome function in the account.
Automating this process
Investigating via the Lambda and CloudWatch console works fine if you have a few functions, but when you have tens or hundreds it can be pretty time consuming. Fortunately CloudWatch metrics are also available via API. To speed up this process I’ve written a script in Python that will go back over the last 7 days of metrics, find the minute with the highest concurrency, and output the Invocations and Average Duration for all functions for six minutes prior to that spike. You can download the script here. To execute, make sure you have rights to CloudWatch metrics, or are running from an EC2 instance that has those rights. Then you can execute:
sudo yum install python3
pip install boto3 --user
curl https://raw.githubusercontent.com/aws-samples/aws-lambda-concurrency-hunt/master/lambda-con-hunt.py -o lambda-con-hunt.py
python3 lambda-con-hunt.py
or, to output it to a file:
python3 lambda-con-hunt.py > output.csvYou should get output similar to the following image.
You can import this data into a spreadsheet program and sort it, or you can confirm visually that BadLambdaConcurrency is driving the concurrency.
Getting to the root cause
Now I want to understand what is driving that spike in Invocations for BadLambdaConcurrency, so I go to the Lambda console. It shows that API Gateway is triggering this Lambda function.
I choose API Gateway and scroll down to discover which API is triggering. Choosing the name (ConcurrencyTest) takes me to that API.
It’s the same API that I set up for concurrencyblog, but a different method. Because I already set up logging for this API, I can search the log group to check for interesting behavior. Perusing the logs, I check the method request headers for any insights as to who is calling this API. In real life I wouldn’t leave an API open without authentication, so I’ll have to do some guessing.
(a915ba7f-9591-11e8-8f19-a7737a1fb2d7) Method request headers: {CloudFront-Viewer-Country=US, CloudFront-Forwarded-Proto=https, CloudFront-Is-Tablet-Viewer=false, CloudFront-Is-Mobile-Viewer=false, User-Agent=hey/0.0.1, X-Forwarded-Proto=https, CloudFront-Is-SmartTV-Viewer=false, Host=xxxxxxxxx.execute-api.us-east-2.amazonaws.com, Accept-Encoding=gzip, X-Forwarded-Port=443, X-Amzn-Trace-Id=Root=1-5b61ba53-1958c6e2022ef9df9aac7bdb, Via=1.1 a0286f15cb377e35ea96015406919392.cloudfront.net (CloudFront), X-Amz-Cf-Id=O0GQ_V_eWRe5KydZNc46-aPSz7dfI19bmyhWCsbTBMoety73q0AtZA==, X-Forwarded-For=f.f.f.f, a.a.a.a, CloudFront-Is-Desktop-Viewer=true, Content-Type=text/html}
The method request headers have a user agent called hey. Hey, that’s a load testing utility! I bet that someone is load-testing this API, but it shouldn’t be allowed to consume all of my resources.
Applying rate and concurrency limiting
To keep this from happening, I place a throttle on the API method. In API Gateway console, in the APIs navigation pane, I choose Stages, choose prod, choose the Settings tab, and select the Enable throttling check box. Then I set a rate of 20 requests per second. It doesn’t sound like much, but with an average function duration of 30 seconds, 20 requests per second can use 600 concurrent Lambda executions.
I can also set a concurrency reservation on the function itself, as Chris pointed out in his blog.
If this is a bad function running amok or an emergency, I can throttle it directly, sometimes referred to as flipping a kill switch. I can do that quickly by choosing Throttle on the Lambda console.
I recommend throttling to zero only in emergency situations.
Investigating the duration
The other and larger problem is this function is taking 30 seconds to execute. That is a long time for an API, and the API Gateway integration timeout is 29 seconds. I wonder what is making it time out, so I check the traces in AWS X-Ray.
It initializes quickly enough, and I don’t find any downstream processes called. This function is a simple one, and the code is available from the Lambda console window. There I find my timeout culprit, a 30-second sleep call.
Not sure how that got through testing!
Setting up ongoing monitoring and alerting
To ensure that I’m not surprised again, let’s create a CloudWatch alert. In the CloudWatch console’s navigation pane, I choose Alarms and then choose Create Alarm.
When prompted, I choose Lambda and the ConcurrentExecutions metric across all functions, as shown in the following image.
Under Alarm Threshold, I give the alarm a name and description and enter 800 for is, as shown in the following image. I treat missing data as good because Lambda won’t publish a metric if there is no activity. I make sure that my period is 1 minute and use Maximum as the statistic. I want to be alerted only if this happens for any 2 minutes out of a 5-minute period. Finally, I can set up an Amazon SNS notification to alert me via email or text if this threshold is reached. This enables me to troubleshoot or request a limit increase for my account. Individual functions should be able to handle a throttling event through client-side retry and exponential backoff, but it’s still something that I want to know about.
Conclusion
In this blog, I walked through a method to investigate concurrency issues with Lambda, remediate those issues, and set up alerting. Managing concurrency is going to be new for a lot of people. As you deploy more applications, it’s especially important to segment them, monitor them, and understand how they are reporting their health. I hope you enjoyed this blog and start monitoring your functions today!