AWS Compute Blog
Using AWS X-Ray tracing with Amazon EventBridge
AWS X-Ray allows developers to debug and analyze distributed applications. It can be useful for tracing transactions through microservices architectures, such as those typically used in serverless applications. Amazon EventBridge allows you to route events between AWS services, integrated software as a service (SaaS) applications, and your own applications. EventBridge can help decouple applications and produce more extensible, maintainable architectures.
EventBridge now supports trace context propagation for X-Ray, which makes it easier to trace transactions through event-based architectures. This means you can potentially trace a single request from an event producer through to final processing by an event consumer. These may be decoupled application stacks where the consumer has no knowledge of how the event is produced.
This blog post explores how to use X-Ray with EventBridge and shows how to implement tracing using the example application in this GitHub repo.
How it works
X-Ray works by adding a trace header to requests, which acts as a unique identifier. In the case of a serverless application using multiple AWS services, this allows X-Ray to group service interactions together as a single trace. X-Ray can then produce a service map of the transaction flow or provide the raw data for a trace:

When you send events to EventBridge, the service uses rules to determine how the events are routed from the event bus to targets. Any event that is put on an event bus with the PutEvents API can now support trace context propagation.
The trace header is provided as internal metadata to support X-Ray tracing. The header itself is not available in the event when it’s delivered to a target. For developers using the EventBridge archive feature, this means that a trace ID is not available for replay. Similarly, it’s not available on events sent to a dead-letter queue (DLQ).
Enabling tracing with EventBridge
To enable tracing, you don’t need to change the event structure to add the trace header. Instead, you wrap the AWS SDK client in a call to AWSXRay.captureAWSClient and grant IAM permissions to allow tracing. This enables X-Ray to instrument the call automatically with the X-Amzn-Trace-Id header.
For code using the AWS SDK for JavaScript, this requires changes to the way that the EventBridge client is instantiated. Without tracing, you declare the AWS SDK and EventBridge client with:
const AWS = require('aws-sdk')
const eventBridge = new AWS.EventBridge()
To use tracing, this becomes:
const AWSXRay = require('aws-xray-sdk')
const AWS = AWSXRay.captureAWS(require('aws-sdk'))
const eventBridge = new AWS.EventBridge()
The interaction with the EventBridge client remains the same but the calls are now instrumented by X-Ray. Events are put on the event bus programmatically using a PutEvents API call. In a Node.js Lambda function, the following code processes an event to send to an event bus, with tracing enabled:
const AWSXRay = require('aws-xray-sdk')
const AWS = AWSXRay.captureAWS(require('aws-sdk'))
const eventBridge = new AWS.EventBridge()

exports.handler = async (event) => {

  let myDetail = { "name": "Alice" }

  const myEvent = {
    Entries: [{
      Detail: JSON.stringify({ myDetail }),
      DetailType: 'myDetailType',
      Source: 'myApplication',
      Time: new Date
    }]
  }

  // Send to EventBridge
  const result = await eventBridge.putEvents(myEvent).promise()

  // Log the result
  console.log('Result: ', JSON.stringify(result, null, 2))
}
You can also define a custom tracing header using the new TraceHeader attribute on the PutEventsRequestEntry API model. The unique value you provide overrides any trace header on the HTTP header. The value is also validated by X-Ray and discarded if it does not pass validation. See the X-Ray Developer Guide to learn about generating valid trace headers.
Deploying the example application
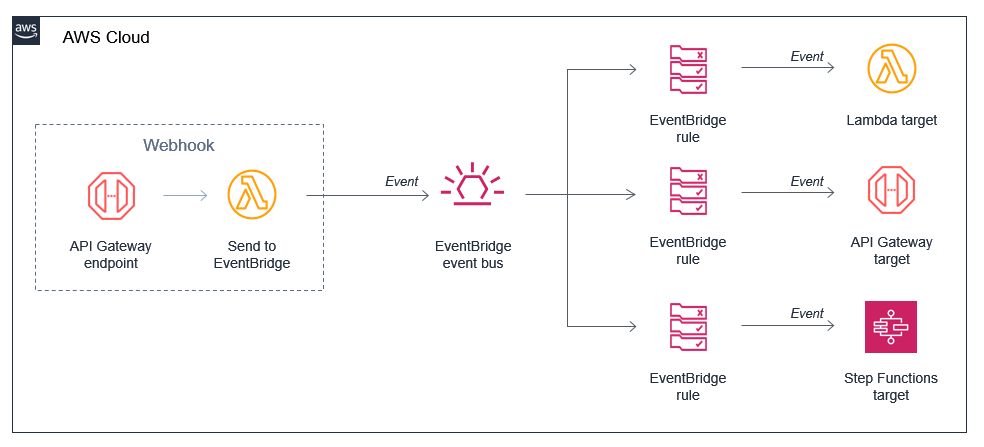
The example application consists of a webhook microservice that publishes events and target microservices that consume events. The generated event contains a target attribute to determine which target receives the event:
To deploy these microservices, you must have the AWS SAM CLI and Node.js 12.x installed. to To complete the deployment, follow the instructions in the GitHub repo.
EventBridge can route events to a broad range of target services in AWS. Targets that support active tracing for X-Ray can create comprehensive traces from the event source. The services offering active tracing are AWS Lambda, AWS Step Functions, and Amazon API Gateway. In each case, you can trace a request from the producer to the consumer of the event.
The GitHub repo contains examples showing how to use active tracing with EventBridge targets. The webhook application uses a query string parameter called target to determine which events are routed to these targets.
For X-Ray to detect each service in the webhook, tracing must be enabled on both the API Gateway stage and the Lambda function. In the AWS SAM template, the Tracing: Active property turns on active tracing for the Lambda function. If an IAM role is not specified, the AWS SAM CLI automatically adds the arn:aws:iam::aws:policy/AWSXrayWriteOnlyAccess policy to the Lambda function’s execution role. For the API definition, adding TracingEnabled: True enables tracing for this API stage.
When you invoke the webhook’s API endpoint, X-Ray generates a trace map of the request, showing each of the services from the REST API call to putting the event on the bus:

The CloudWatch Logs from the webhook’s Lambda function shows the event that has been put on the event bus:

Tracing with a Lambda target
In the targets-lambda example application, the Lambda function uses the X-Ray SDK and has active tracing enabled in the AWS SAM template:
Resources:
  ConsumerFunction:
    Type: AWS::Serverless::Function
    Properties:
      CodeUri: src/
      Handler: app.handler
      MemorySize: 128
      Timeout: 3
      Runtime: nodejs12.x
      Tracing: Active
With these two changes, the target Lambda function propagates the tracing header from the original webhook request. When the webhook API is invoked, the X-Ray trace map shows the entire request through to the Lambda target. X-Ray shows two nodes for Lambda – one is the Lambda service and the other is the Lambda function invocation:

Tracing with an API Gateway target
Currently, active tracing is only supported by REST APIs but not HTTP APIs. You can enable X-Ray tracing from the AWS CLI or from the Stages menu in the API Gateway console, in the Logs/Tracing tab:

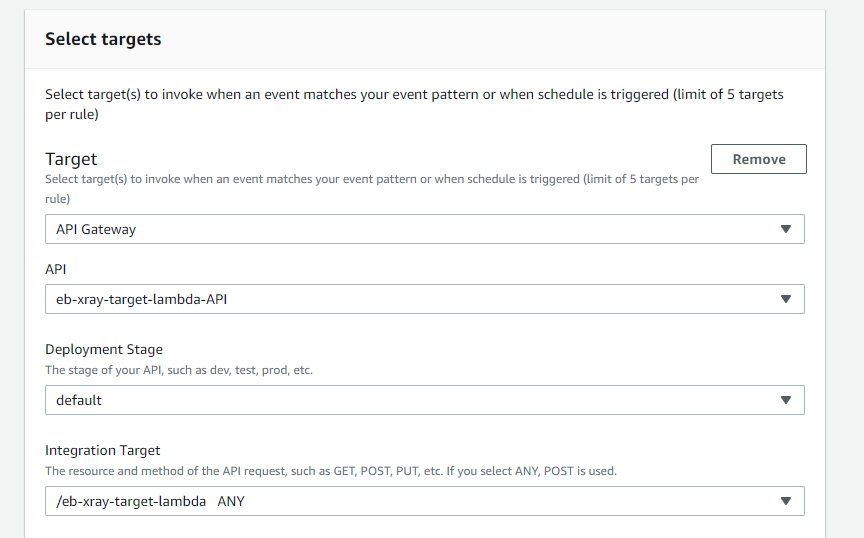
You cannot currently create an API Gateway target for EventBridge using AWS SAM. To invoke an API endpoint from the EventBridge console, create a rule and select the API as a target. The console automatically creates the necessary IAM permissions for EventBridge to invoke the endpoint.
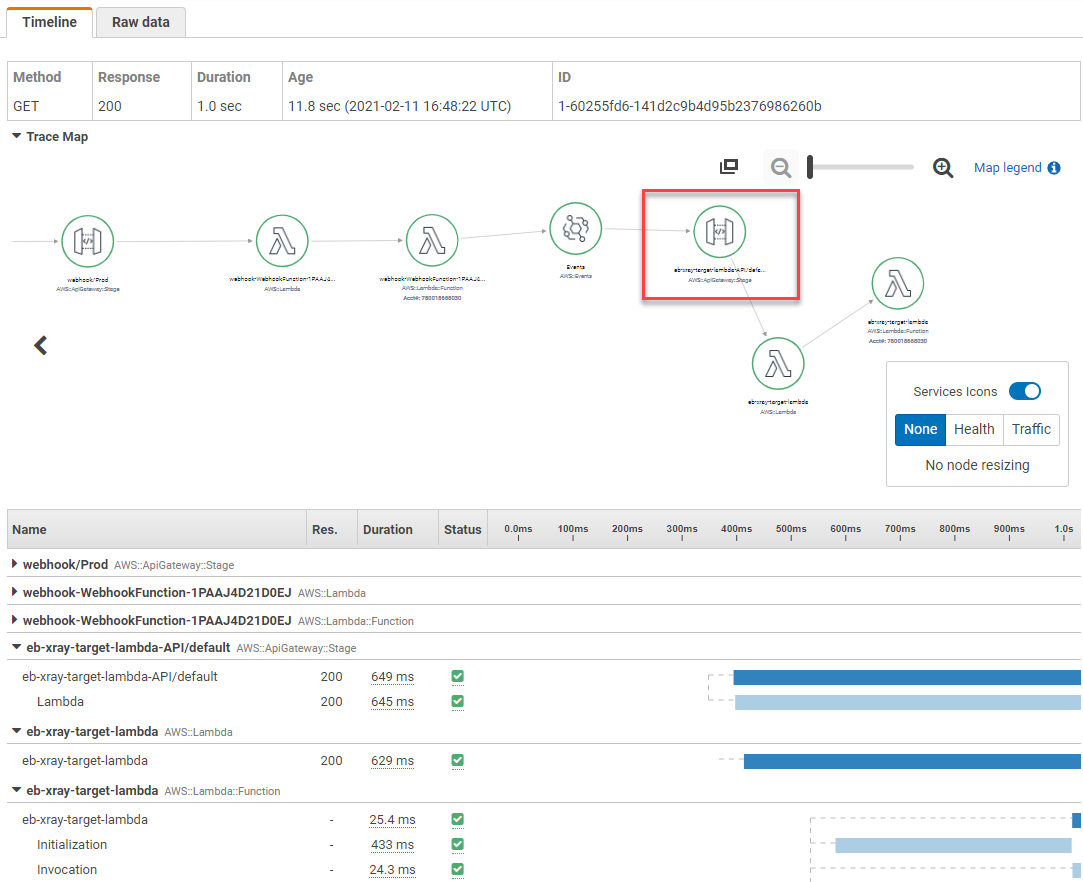
If the API invokes downstream services with active tracing available, these services also appear as nodes in the X-Ray service graph. Using the webhook application to invoke the API Gateway target, the trace shows the entire request from the initial API call through to the second API target:
Tracing with a Step Functions target
To enable tracing for a Step Functions target, the state machine must have tracing enabled and have permissions to write to X-Ray. The AWS SAM template can enable tracing, define the EventBridge rule and the AWSXRayDaemonWriteAccess policy in one resource:
  WorkFlowStepFunctions:
    Type: AWS::Serverless::StateMachine
    Properties:
      DefinitionUri: definition.asl.json
      DefinitionSubstitutions:
        LoggerFunctionArn: !GetAtt LoggerFunction.Arn
      Tracing:
        Enabled: True
      Events:
        UploadComplete:
          Type: EventBridgeRule
          Properties:
            Pattern:
              account:
                - !Sub '${AWS::AccountId}'
              source:
                - !Ref EventSource
              detail:
                apiEvent:
                  target:
                    - 'sfn'

      Policies:
        - AWSXRayDaemonWriteAccess
        - LambdaInvokePolicy:
            FunctionName: !Ref LoggerFunction
If the state machine uses services that support active tracing, these also appear in the trace map for individual requests. Using the webhook to invoke this target, X-Ray now shows the request trace to the state machine and the Lambda function it contains:

Adding X-Ray tracing to existing Lambda targets
To wrap the SDK client, you must enable active tracing and include the AWS X-Ray SDK in the Lambda function’s deployment package. Unlike the AWS SDK, the X-Ray SDK is not included in the Lambda execution environment.
Another option is to include the X-Ray SDK as a Lambda layer. You can build this layer by following the instructions in the GitHub repo. Once deployed, you can attach the X-Ray layer to any Lambda function either via the console or the CLI:
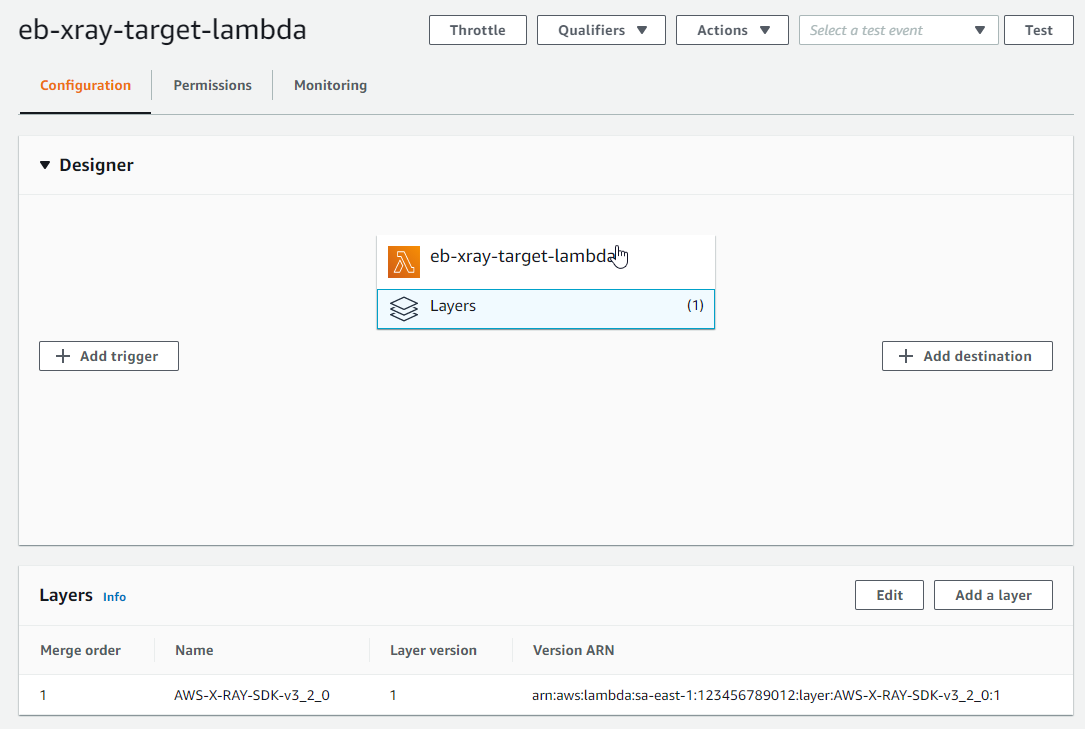
To learn more about using Lambda layers, read “Using Lambda layers to simplify your development process”.
Conclusion
X-Ray is a powerful tool for providing observability in serverless applications. With the launch of X-Ray trace context propagation in EventBridge, this allows you to trace requests across distributed applications more easily.
In this blog post, I walk through an example webhook application with three targets that support active tracing. In each case, I show how to enable tracing either via the console or using AWS SAM and show the resulting X-Ray trace map.
To learn more about how to use tracing with events, read the X-Ray Developer Guide or see the Amazon EventBridge documentation for this feature.
For more serverless learning resources, visit Serverless Land.