AWS Database Blog
Get Started with Amazon Elasticsearch Service: Set CloudWatch Alarms on Key Metrics
September 8, 2021: Amazon Elasticsearch Service has been renamed to Amazon OpenSearch Service. See details.
Welcome to this introductory series on Elasticsearch and Amazon Elasticsearch Service (Amazon ES). In this and future articles, we provide the basic information that you need to get started with Elasticsearch on AWS.
While supporting the many thousands of Amazon Elasticsearch Service (Amazon ES) domains for our customers, our team has amassed significant experience with common problems that our customers encounter—and best-practice solutions to these problems. I’ll spend the next few posts sharing these solutions.
One of the most common problems that our customers have is that their domains are underscaled. Although there are many deeply technical reasons that this happens, we also find that many customers are not aware when they are incorrectly scaled. To ensure that you know about and can respond to problems with scale, it’s a good idea to set some alarms on your domain’s Amazon CloudWatch metrics.
In this post, I detail the most important metrics to monitor. You can also easily extend the methodology to monitor less critical metrics.
Critical metrics to monitor
The following are some of the most important CloudWatch metrics to monitor, along with possible solutions for issues that you might encounter in each scenario.
| ClusterStatus.red | Maximum | >= 1 | 1 period |
If your cluster is red, one of your primary shards and all of its replicas are not allocated. This is a “must-fix” scenario.
A common cause for this state is a lack of free storage space on one or more of the data nodes in the cluster. In turn, a lack of free storage space prevents the service from distributing primary shards to the affected data node or nodes.
For ways to address this issue, see the Amazon ES documentation.
| ClusterIndexWritesBlocked | Maximum | >= 1 | 1 period |
Many factors can cause a cluster to begin blocking requests. Some common factors include the following:
-
FreeStorageSpaceis too low. -
JVMMemoryPressureis too high. -
CPUUtilizationis too high.
To alleviate this issue, consider adding more disk space or scaling your cluster.
| CPUUtilization | Average | >= 80 | 3 periods |
| MasterCPUUtilization | Average | >= 80 | 3 periods |
To ensure that you aren’t exceeding your domain’s capacity, monitor your CPU on both your data nodes and your dedicated master nodes. Be sure to monitor the Average for these statistics. It’s not uncommon for a single node to peg the CPU for a short time.
If you regularly deal with traffic spikes that push your CPUs high and then subside relatively soon after, you can also adjust the alarm’s trigger to wait longer.
To remedy the situation, you can do any of the following:
- Reduce your traffic.
- Reduce your concurrency.
- Check your queries and remove excessive nesting in your aggregations.
- Optimize your queries.
- Scale—either horizontally or vertically.
| JVMMemoryPressure | Maximum | >= 80 | 3 periods |
| MasterJVMMemoryPressure | Maximum | >= 80 | 3 periods |
The JVMMemoryPressure metric is the ratio of new to old memory that is allocated in the Java heap. It’s normal for this metric to oscillate between 50 and 75 percent in response to Java’s garbage collector reclaiming used heap space (lower than 50 percent is safe). If the ratio exceeds 75 percent, the garbage collector is not freeing any memory, and the cluster goes out of memory sooner or later.
To fix this issue, allocate more memory in the cluster. You can do this by scaling vertically. Amazon ES uses half of the instance’s memory for the Java heap, up to ~32 GB. That means that you can scale vertically in instance size up to a total of 64 GB of memory. Beyond that, you can scale horizontally, distributing fewer shards per node.
You can also examine your queries to determine whether you are using excessive memory per-query. The following are the common culprits:
- Deep paging
- Use of field data—for example, aggregations on fields with high cardinality or with deeply nested aggregations
| FreeStorageSpace | Minimum | <= ? | 3 periods |
When your domain’s free storage space drops too low (less than 15 percent free), Elasticsearch begins relocating shards to try to balance usage. If your storage drops further, Amazon ES starts returning ClusterBlockExceptions. It’s a good idea to avoid these situations by setting a threshold of 25 percent. Be sure to use the Minimum free storage space, which reports the minimum free storage on any single instance in the cluster. The metric is in megabytes, so set the threshold at 25 percent of your per-instance storage.
To remedy this situation, increase the per-node storage. If you’re using Amazon EBS volumes, increase the volume size. If you have maxed out your EBS volume size for your instance type, or if you’re using ephemeral store on your instances, increase your instance size, or add more instances to your domain.
Alternatively, you can delete one or more of the indexes in your domain to free the storage used for those indexes.
| AutomatedSnapshotFailure | Maximum | >= 1 | 1 period |
Amazon ES takes daily snapshots of your domain. Starting with the Amazon ES support for Elasticsearch 5.5, you have access to these snapshots as well. You can also take manual snapshots of your domain. Especially if you are relying on the automatic snapshots, you’ll want to know when one fails.
You can’t restart or retry a failed automatic snapshot. Instead, consider running a manual snapshot instead.
How do I set an alarm?
You can find detailed information about setting CloudWatch alarms in the Amazon CloudWatch documentation.
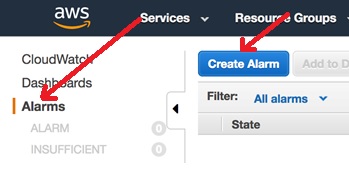
To set an alarm, first sign in to the AWS Management Console. Type CloudWatch in the services search bar, and then choose CloudWatch in the autocomplete menu to open the CloudWatch console.
In the navigation pane on the left side, choose Alarms, and then choose Create Alarm.
In the wizard, type all or part of your domain name in the search bar. Then select the metric for the alarm, for example, ClusterStatus.red.
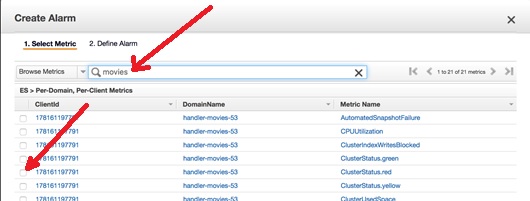
This opens a graph at the bottom of the page. Choose Next. Type a Name and Description for your alarm. To set the operator from the chart, use 1 period. For CPUUtilization, use 3 periods.
Under Actions, you can choose an existing email distribution list or create a New list. If you choose New list, a text box appears, where you can add an email address to receive notifications. Enter a list name in the Send notification to box, add one or more email addresses (comma-separated) in the Email list box, and click Create Alarm.
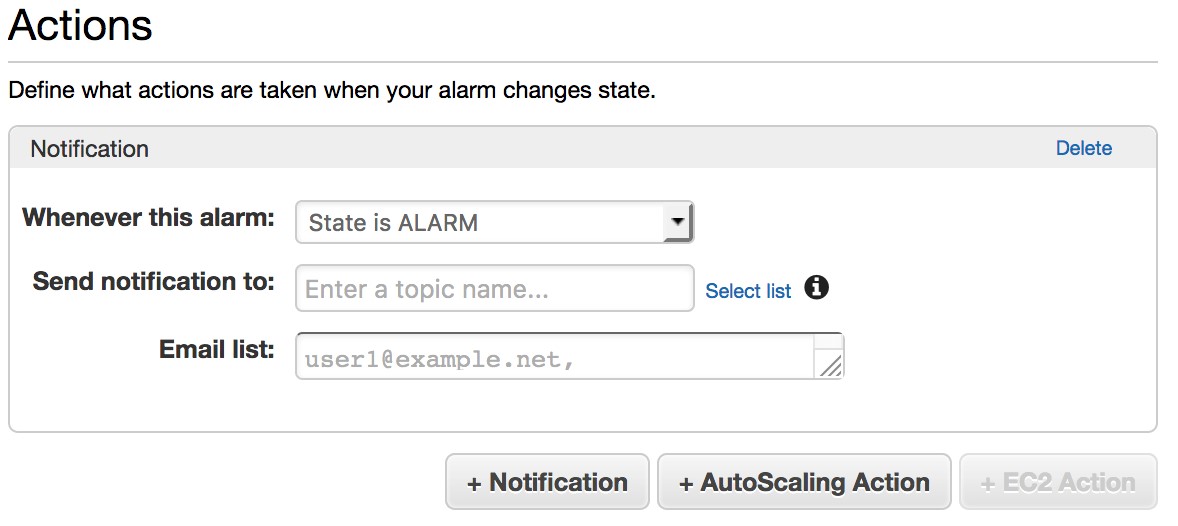
Repeat the process for the remaining alarms in the table. (You can reuse the list you just created or create a new one for each alarm.) CloudWatch sends a confirmation email to the addresses in the list. Be sure to confirm by following the link in the email.
Conclusion
That’s all you need to do! If your domain starts getting into trouble, each member of the list receives an email, and you can react before a resource constraint becomes a real problem.
About the Author
 Jon Handler (@_searchgeek) is an AWS solutions architect specializing in search technologies. He works with our customers to provide guidance and technical assistance on database projects, helping them improve the value of their solutions when using AWS.