AWS Database Blog
How to use the new Amazon DynamoDB key diagnostics library to visualize and understand your application’s traffic patterns
Update (December 14, 2020): The DynamoDB team recommends that you use Amazon CloudWatch Contributor Insights for Amazon DynamoDB, which is a diagnostic tool for understanding your traffic patterns and identifying frequently accessed keys. You can enable CloudWatch Contributor Insights for DynamoDB in the AWS Management Console, or in the AWS API or AWS CLI.
August 30, 2023: Amazon Kinesis Data Analytics has been renamed to Amazon Managed Service for Apache Flink. Read the announcement in the AWS News Blog and learn more.
Today, we released the Amazon DynamoDB key diagnostics library, which enables you to view graphs and dashboards of your most accessed database items. A DynamoDB table can be used in two different capacity modes—provisioned and on-demand. DynamoDB automatically supports your access patterns as long as the traffic against a given item does not exceed 3,000 read capacity units per second or 1,000 write capacity units per second. The key diagnostics library gives you a tool to analyze the traffic to your tables and display a graph showing the number of reads and writes to each partition key so that you can monitor the the traffic in your application in near-real time and adjust to unpredictable and uneven workloads.
For example, if you want to know the most popular products in your inventory table that are driving the most page views, the library can help identify the products receiving the most interest. If you manage a mobile game, you can quickly identify and rate-limit potential bad actors who are driving excess traffic that negatively affects other gamers.
In this blog post, I show you how to set up the key diagnostics library. Then I walk through how to use the library’s visualizations to identify keys with uneven access distribution in an example movie database.
Overview of the DynamoDB key diagnostics library
The DynamoDB key diagnostics library is a lightweight wrapper around the DynamoDB SDK that is easy to integrate with your existing application. The library includes an AWS CloudFormation template that creates the required Amazon Kinesis Data Firehose Stream, Amazon Kinesis Data Streams, Amazon Kinesis Data Analytics, Amazon CloudWatch Logs, CloudWatch alarms, Amazon Athena, and Amazon QuickSight resources in your AWS account. You then can log DynamoDB access by partition key, analyze the frequency of access (or the “heat”) of each primary key, and display the results in a dashboard. The following diagram shows the resources that are deployed by the template when you follow the setup guide in this post.

For instructions about how to integrate the SDK, deploy the CloudFormation template. To view the dashboard displaying uneven access distribution and associated metrics, see the next section.
Getting started step-by-step guide
To set up the recommended AWS resources and run the example application yourself, clone this GitHub repository and take the steps that follow.
Note: At the time of this post’s publication, the library aggregates the metrics for keys at minute and second granularity. Depending on your business requirements, you might want to modify the client to aggregate data at different granularity. In addition, you can set up the included CloudFormation template in the following AWS Regions because all dependent services are available only in these regions: US East (N. Virginia), US West (Oregon), EU (Ireland), and EU (Frankfurt). This availability might change over time, so see the AWS Regions table for up-to-date information.
Setup Guide: How to install the Key Diagnostics Library, set up AWS resources, run the demo application, and integrate it with your code
Prerequisites
To use the key diagnostics library or run the demo, you must have the following installed on your machine:
- Java 1.8
- Apache Maven 3.0 or later
- AWS Command Line Interface (AWS CLI)
Step 1: Install the key diagnostics library
To install the key diagnostics library, run the following command.
Step 2: Configure your AWS credentials
Configure your AWS CLI credentials, if you haven’t already. The following AWS resources are created under the configured account.
Make sure you have Amazon S3, AWS Lambda, Amazon Kinesis, Amazon CloudWatch and CloudFormation permissions with the configured credentials.
Step 3: Create and deploy the required AWS resources by using the CloudFormation template
You now will deploy a Lambda function for reporting and monitoring metrics. To do this, first upload the provided Lambda function to Amazon S3. If you don’t have an Amazon S3 bucket already, create one (throughout this post, replace the placeholder names with your own names).
Then, package the provided Hot Key Lambda function the Amazon S3 bucket.
You can then create the rest of the necessary AWS resources (such as the Kinesis Data Streams stream, Kinesis Data Analytics application, and CloudWatch alarm) as follows. Also, provide a CloudFormation stack name.
CloudFormation does not automatically start the Kinesis Data Analytics application, so to start the application, navigate to the Amazon Kinesis console or run the following commands.
You now are ready to run the demo Movies example application in the repository (step 3.1) or change your code to use the key diagnostics library (step 3.2).
Step 3.1: Run the example Movies application
This example application uses the IMDb dataset to simulate a hot-key scenario in which some movies are rated more frequently than others. To run the application, first install the library on your local repository. Then, navigate to the samples/movies directory, and execute the demo by running the following commands.
Step 3.2: Change your code to use the key diagnostics library
To use the key diagnostics library, provide the Kinesis client name and Kinesis Data Streams name for logging DynamoDB usage information, in addition to the original DynamoDB client.
By default, the setup in this post monitors all key attributes for all the tables and global secondary indexes accessed through this client. If you need to specify attributes to monitor, you can pass in a map of table name to key attribute name.
After you create the DynamoDBKeyDiagnosticsClient instance, you can use it everywhere you would have used the AmazonDynamoDB client (the instance implements the AmazonDynamoDB interface).
To simplify the construction of the DynamoDB and Kinesis clients, you also can use the provided DynamoDBKeyDiagnosticsClientBuilder. The following example code closes the thread pool created to log the usage information asynchronously to Kinesis.
Step 4: Set up Amazon Athena and Amazon QuickSight for visualizations
If you are interested in creating dashboards or querying key usage information, or if you want to understand the access patterns of specific attributes, we highly recommend setting up Athena and Amazon QuickSight.
- Navigate to the Athena console, paste following under New query 1, and then choose Run query. This command creates an Athena database for the key usage information stored in Amazon S3.
- Create the Athena table. Following the example application, the table name is
movies. If you used the provided CloudFormation template in Step 1, the Amazon S3 location should be something similar to:s3://keydiagnosticsstack-aggregatedresultbucket-ejkhrnvyw8ku/keydiagnostics/
After you create the Athena table, you can use Amazon QuickSight to visualize the key usage pattern of your application:
- Navigate to the Amazon QuickSight console and choose Manage data.
- Choose New data set, choose Athena, and specify a data source name. You then should be able to select the Athena database and table you created in the previous section.
- Choose Import to SPICE for quicker analytics, and then choose Visualize!
- Now you should be able to create graphs by filtering on table names, time ranges, and partition keys to visualize movie popularity over a time range.
Note: With the preceding setup, the key diagnostics library will log the values of your partition key, sort key, or any attributes you want to monitor for the selected DynamoDB table. The key usage information is stored in Amazon S3, and specific hot keys are logged and displayed through CloudWatch and Amazon QuickSight. Be careful about exposing sensitive data stored in your DynamoDB table after integrating with the library.
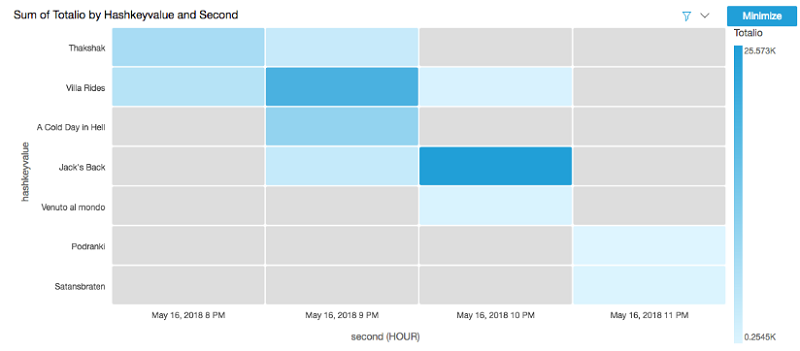
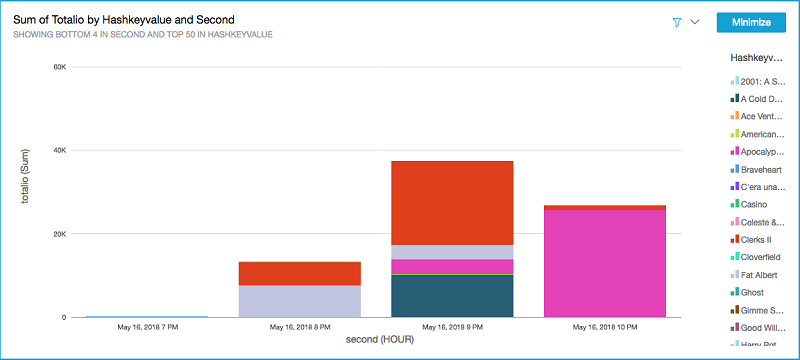
The following visualizations show example output from the library when integrated with the sample movies application. The visualizations show the relative heat of each movie record as the library reads records from the database and how much traffic each record has had over time. Visualizing each record’s traffic allows the application owner to make decisions based on traffic patterns.
Summary
In this post, I show how you can identify your most accessed database items by using the new DynamoDB key diagnostics library. Using this library, you can visualize your application traffic through graphs and visual dashboards. If your database has hot keys and hot spots, the library gives you one more tool to help you adjust to unpredictable and uneven workloads.
About the authors
 Ryan Chan is a software development engineer at Amazon Web Services. He works on the DynamoDB team, developing features such as encryption at rest and on-demand.
Most afa Elhemali is a senior software development engineer at Amazon Web Services.
 Padma Malligarjunan is a senior product manager at AWS with industry background in finance, gaming, and retail. She is passionate about training and evangelizing development best practices for building distributed and highly scalable applications using Amazon DynamoDB.