AWS Database Blog
Send Apache Web Logs to Amazon Elasticsearch Service with Kinesis Firehose
February 9, 2024: Amazon Kinesis Data Firehose has been renamed to Amazon Data Firehose. Read the AWS What’s New post to learn more.
September 8, 2021: Amazon Elasticsearch Service has been renamed to Amazon OpenSearch Service. See details.
We have many customers who own and operate Elasticsearch, Logstash, and Kibana (ELK) stacks to load and visualize Apache web logs, among other log types. Amazon Elasticsearch Service provides Elasticsearch and Kibana in the AWS Cloud in a way that’s easy to set up and operate. Amazon Kinesis Firehose provides reliable, serverless delivery of Apache web logs (or other log data) to Amazon Elasticsearch Service.
With Firehose, you can add an automatic call to an AWS Lambda function to transform records within Firehose. With these two technologies, you have an effective, easy-to-manage replacement for your existing ELK stack.
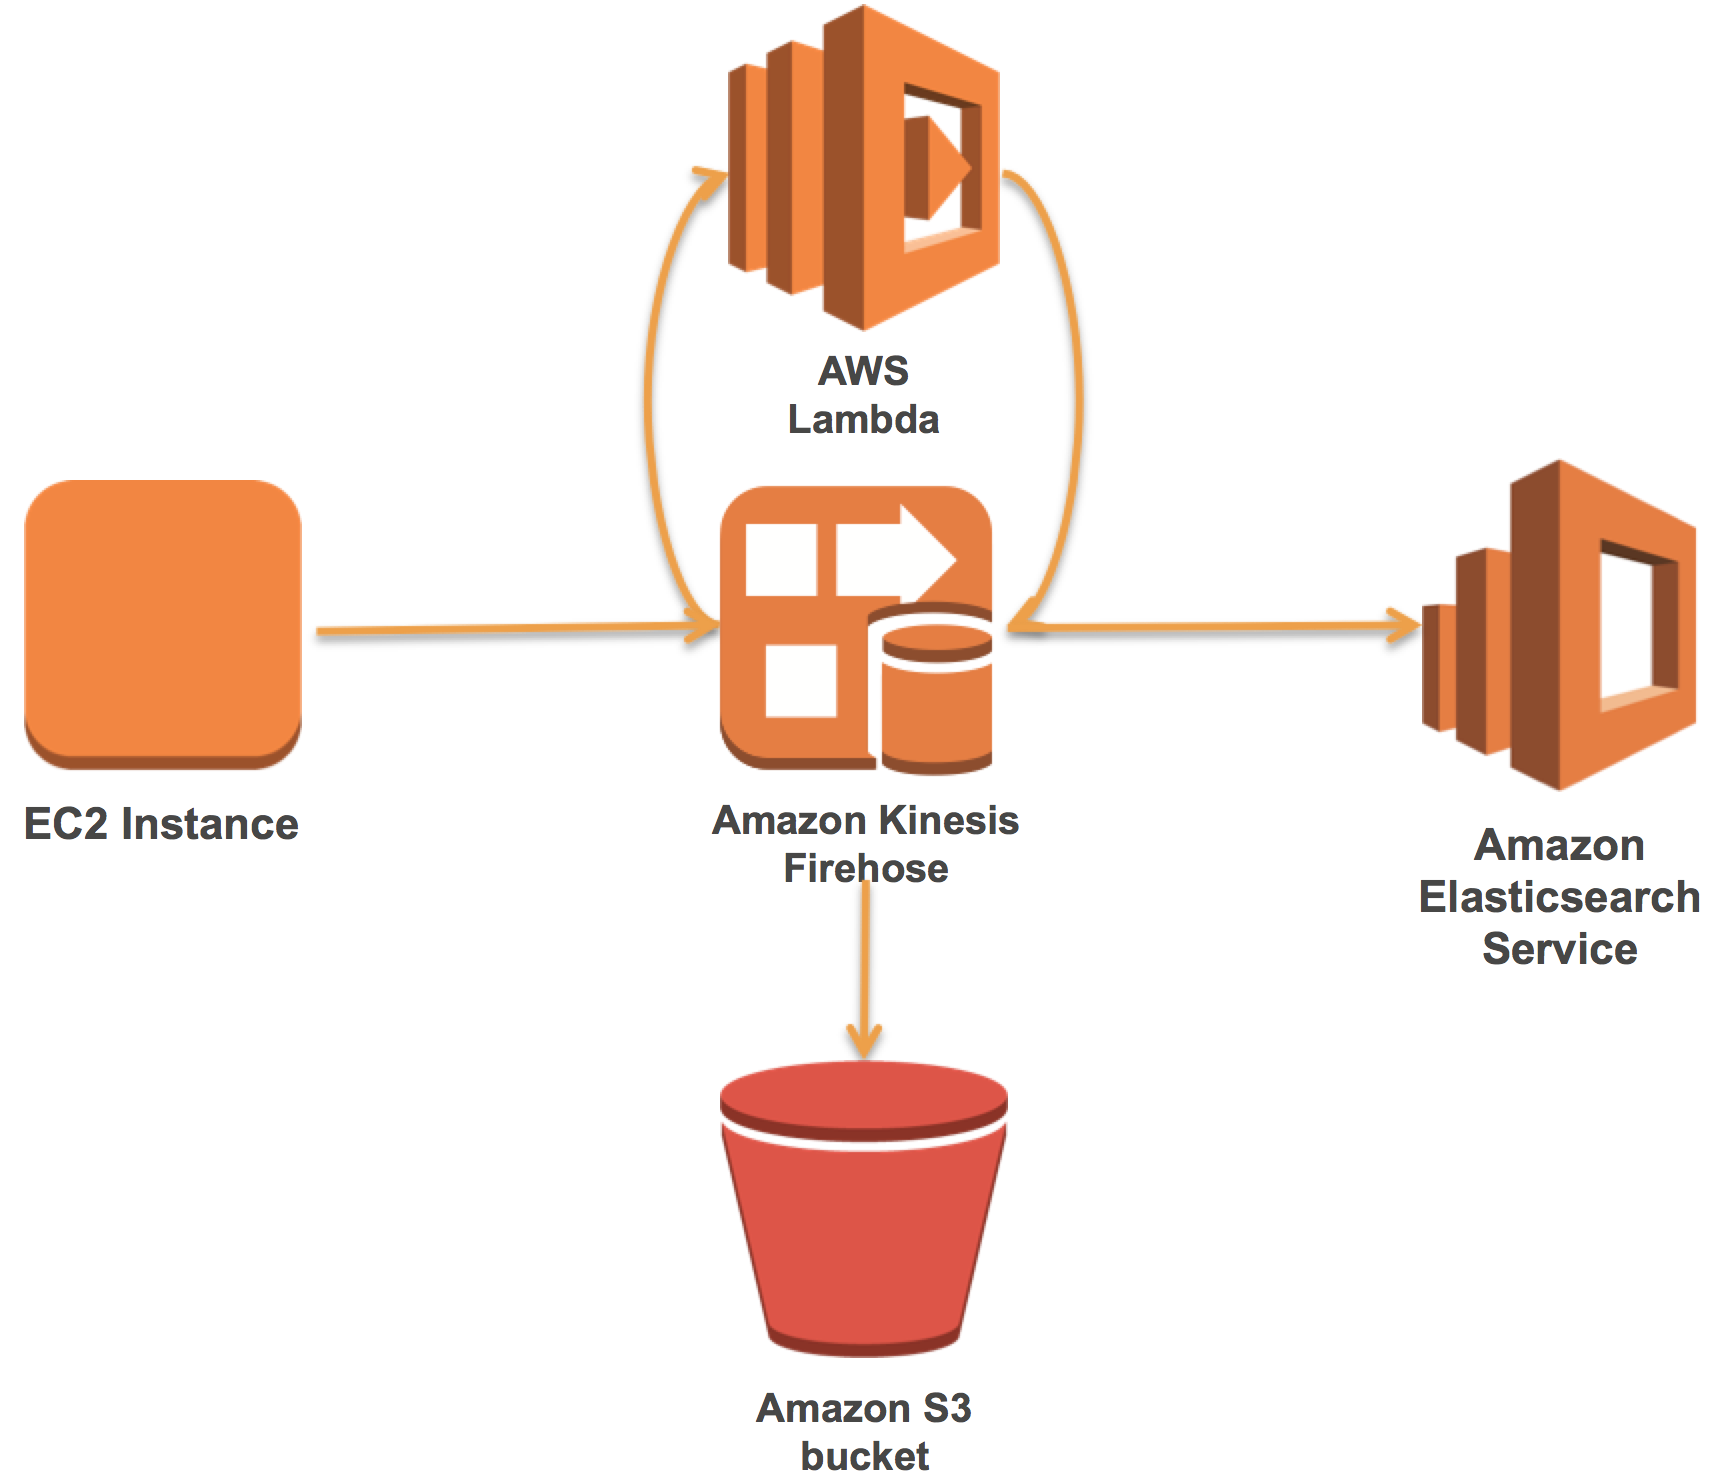
In this post, we show you first how to set up an Amazon Elasticsearch Service domain. Then we show how to create and connect a Firehose stream that employs a prebuilt Lambda function to parse Apache web logs. Finally, we show how to load data with Amazon Kinesis Agent and visualize with Kibana.
Set up an Amazon Elasticsearch Service domain
The first thing you need to do is set up an Amazon Elasticsearch Service domain.
For the purposes of this blog post, I created an Elasticsearch version 5.1 domain with one m3.medium data instance and no master instances. For your use case, you’ll select an instance type and count for data instances that matches your use case. The following screenshot shows the console page on which you configure your data instance.
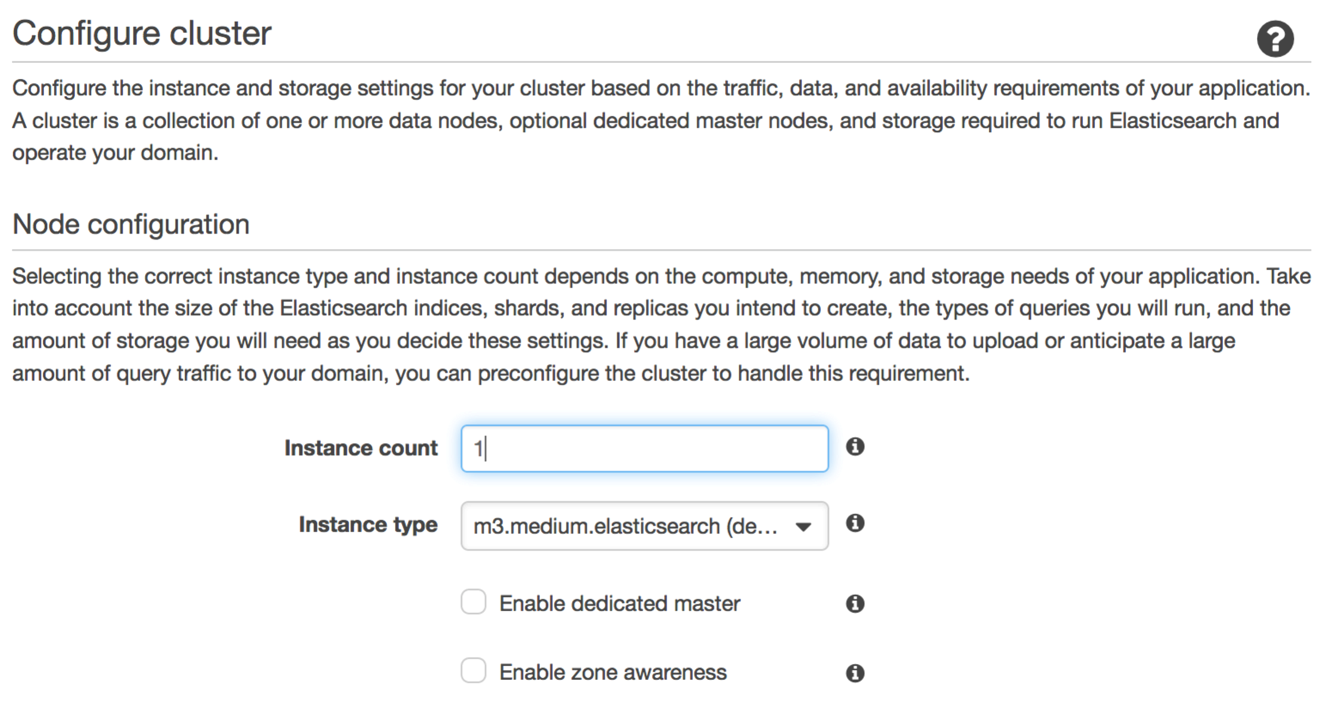
We provided some sizing guidance in a previous blog post. Although I haven’t enabled them for this example, for production workloads we recommend three dedicated master instances of the m3.medium.elasticsearch type.
Once you’ve set the instance count, you get an opportunity to set an AWS Identity and Access Management (IAM) policy to secure access to the domain.
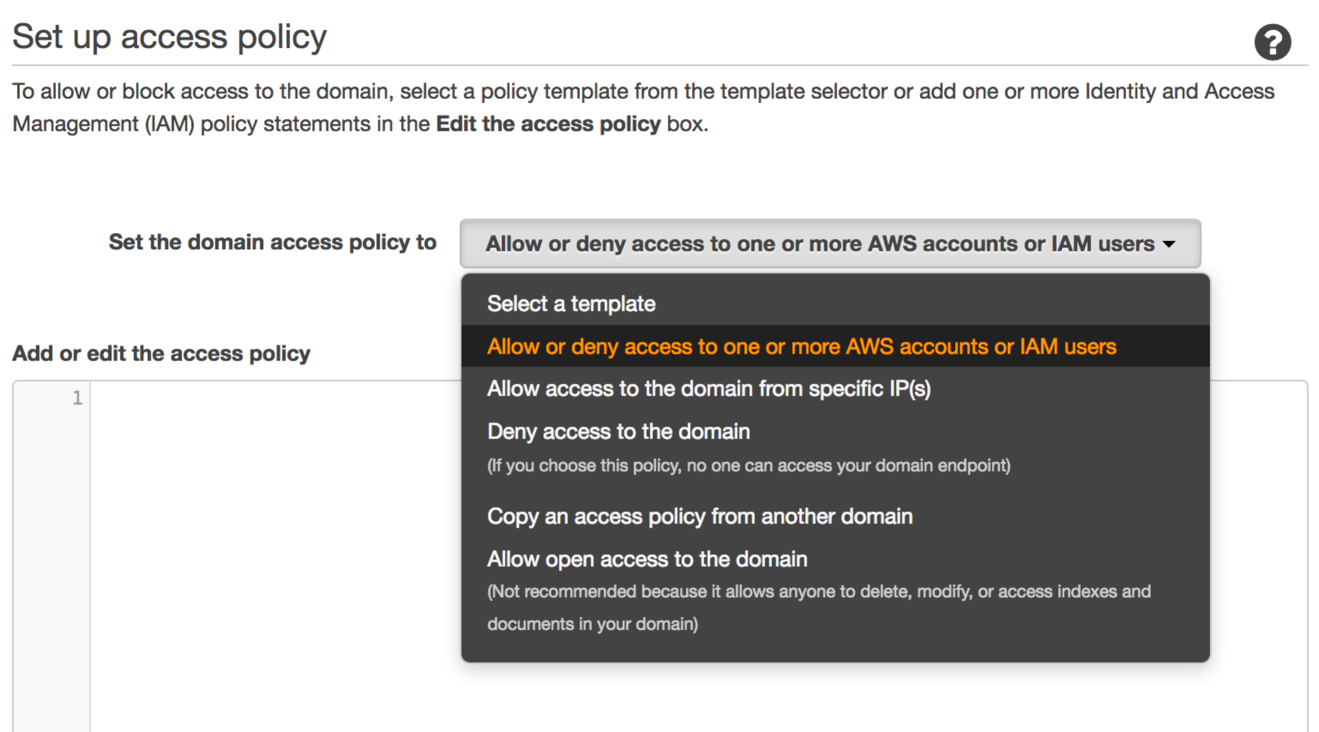
I strongly recommend setting a policy that limits access and prevents unauthorized users from creating, modifying, or deleting data in your domain. For a good way to get started, choose Allow or deny access to one or more AWS accounts for IAM users, and then copy and paste your account ID in the resulting dialog box. For more in-depth discussion on securing your Amazon Elasticsearch Service domain, see this blog post.
Choose Next, and confirm and create the domain.
Create the stream
Next, I create an Amazon Kinesis Firehose stream, add a Lambda transform, and connect it to the domain that I just created. Navigate to the Kinesis console by choosing Services, then Analytics, and then Kinesis. Choose Go to Firehose, and then choose Create Delivery Stream.
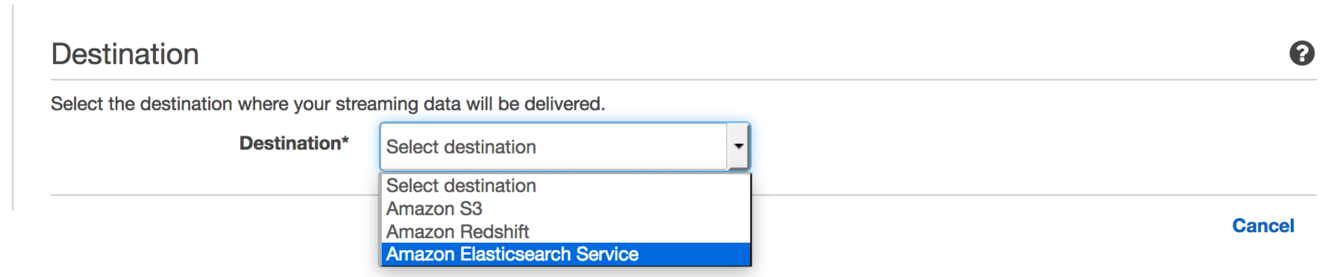
For the destination, choose Amazon Elasticsearch Service.
The console adds fields to allow you to name your stream and specify and customize your delivery to Amazon Elasticsearch Service.
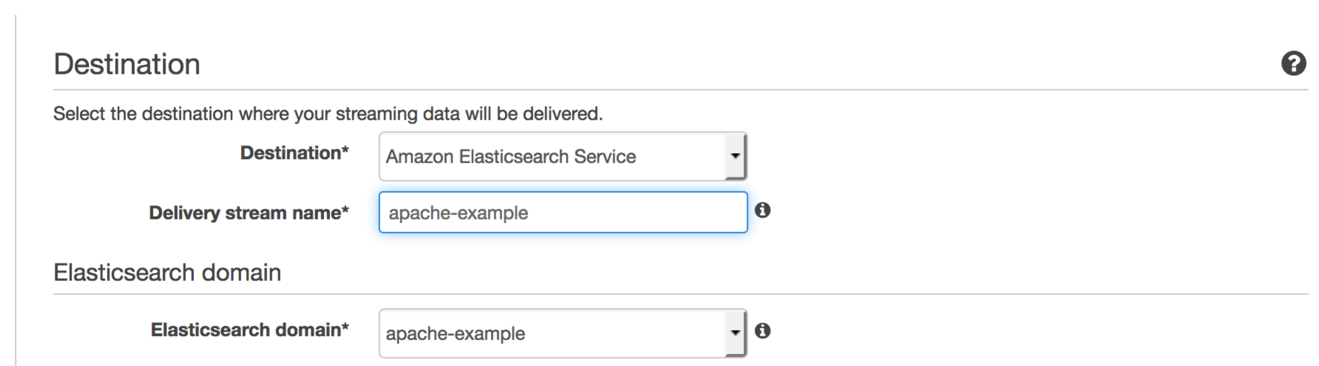
I always name my stream and my Amazon Elasticsearch Service domain the same. The consistency makes it easy to understand what’s connected to what and to clean up when I’m done. Next, choose the domain you just created for Elasticsearch domain.
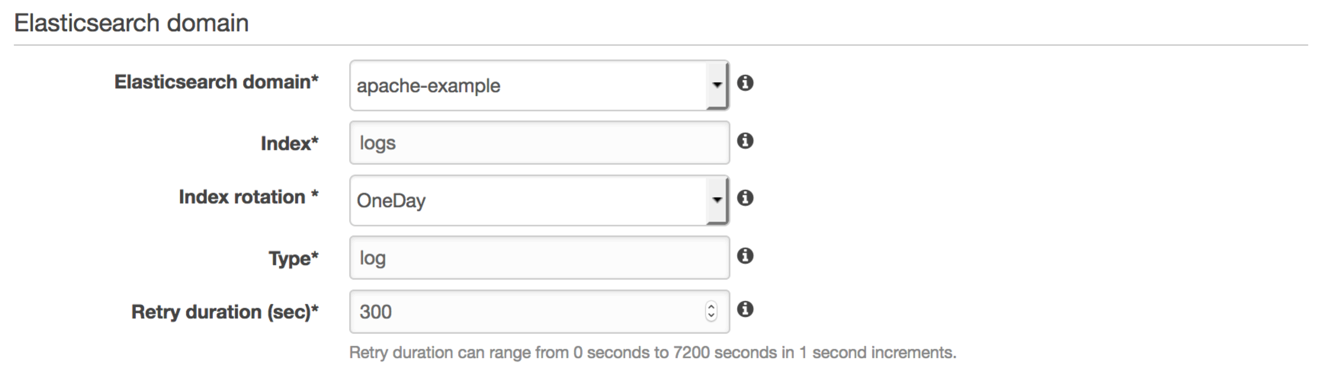
Next, add an Elasticsearch index pattern and type. Firehose uses the index pattern to create new indexes that are time-stamped (for example, logs-2017-02-24) and to load data under the type you create. Firehose creates a new index and rotates delivery of logs based on the Index rotation value that you choose. OneDay is the common choice. OneHour is appropriate for high-volume workloads. OneWeek or OneMonth works for low-volume workloads.
One nice feature of Firehose delivery streams is that they automatically retry on failure to deliver a batch of records. You can control how long Firehose continues to retry with Retry duration. A sensible default is 300 seconds. Adjust based on your desire to keep current with failed records.
Next, you’ll set up the Amazon S3 bucket where Firehose can deliver failed records.

In my case, I’m reusing an existing bucket, but you can easily create a new one in the wizard. Use an S3 prefix value if you want to reuse the same bucket for more than one workload. All records delivered to S3 will employ that prefix.
Firehose is also a great way to keep a copy of all of your log data. Simply choose All documents, and Firehose will deliver all records to S3 and to Amazon Elasticsearch Service (Amazon ES).
Choosing Next brings you to the stream configuration page, shown following.
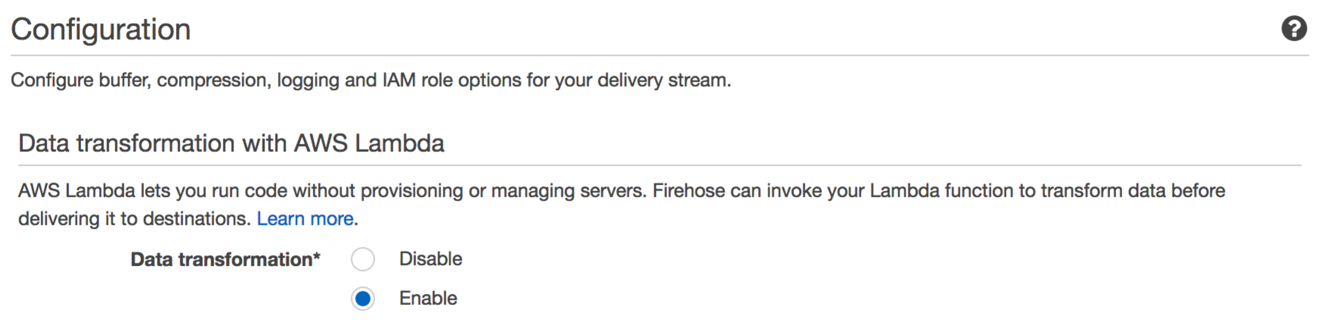
You can choose to have data delivered “straight through” to your Amazon ES domain (the default) by disabling data transformation. Enabling data transformation allows you to specify a Lambda function that Firehose calls inline for each record coming through the stream.

You can write your own function, with inputs and outputs as defined here. The Firehose console also provides a number of existing functions for you to use out of the box. Choose (Optional) Create a new Lambda function to reveal the list of functions, and choose Apache Log to JSON. You are directed to the Lambda console to create the function, with the code already filled in for you.

Give the function a name. Again, I use the same name as the Firehose stream and Amazon ES domain name.
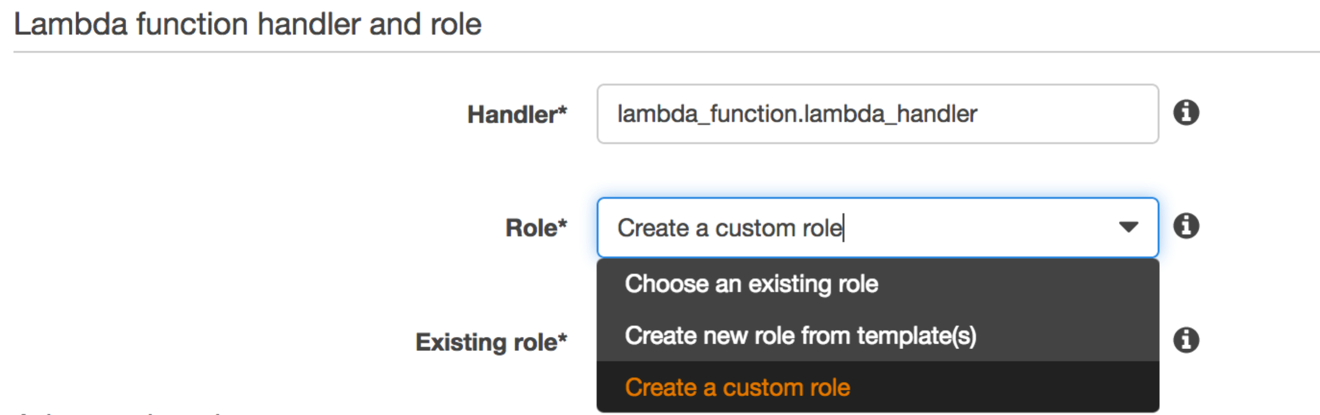
Now you need to create a role for the Lambda function to receive data batches from the stream. The Lambda function we’re creating doesn’t need access to your Amazon ES domain. That’s because it’s not delivering the data to Amazon ES but rather responding directly to Firehose. Choose Create a custom role for Role. This choice sends you to the IAM console.
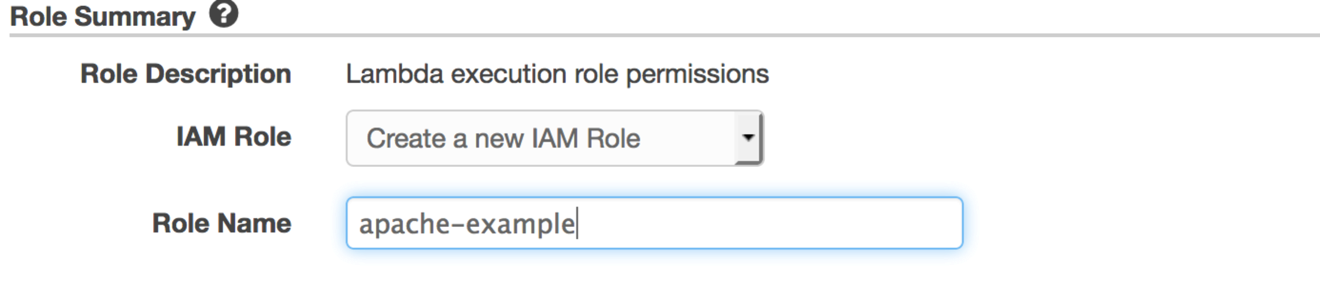
Choose Create a new IAM Role, and name the role our favorite, apache-example. Choose Allow, and you return to the Lambda console.
Choose Advanced settings to reveal the Memory and Timeout values to dedicate to Lambda for processing batches of log data from Firehose.
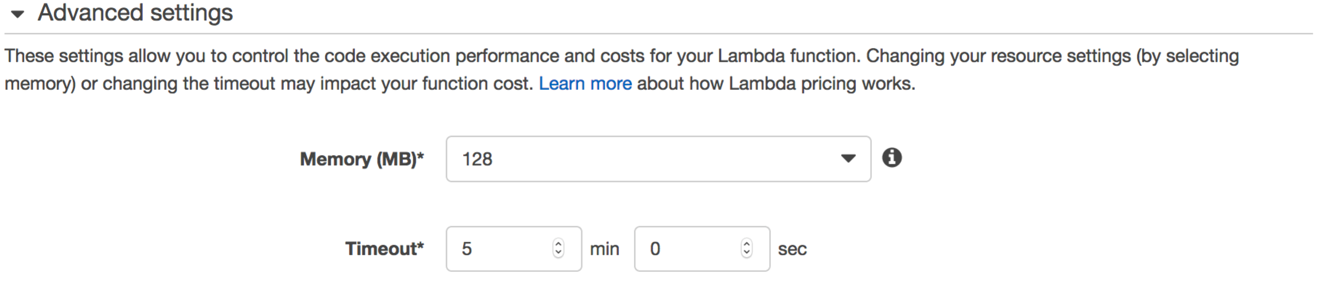
The default timeout is 3 seconds, which you should increase to at least 30 seconds. You can monitor the function execution durations in the Lambda console and dial in an appropriate timeout.
You can accept the rest of the defaults by choosing Next, then Create Function. Navigate back to the Firehose console, reload the Lambda function menu, and select the function you’ve just created.
You control the size of the batches of data that Firehose delivers to Amazon ES with the Elasticsearch Buffer settings.
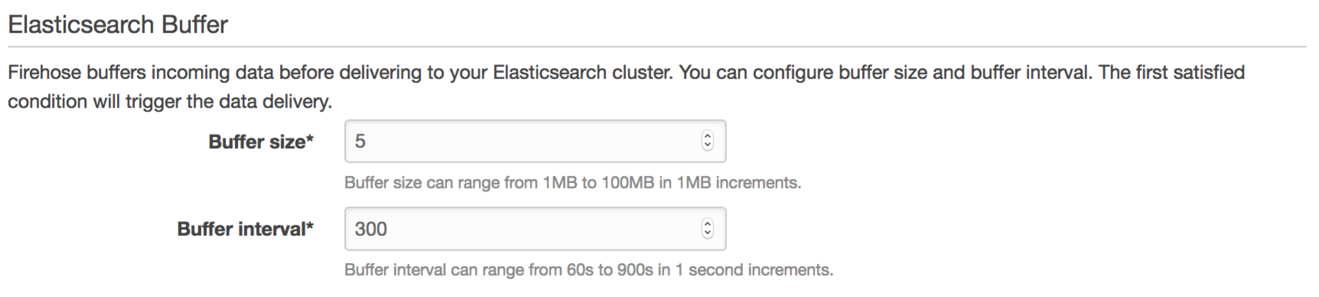
As you send data to Firehose, Amazon ES buffers that data and flushes the buffer based on the values that you put in these fields. You should adjust the values lower for low volumes of data—1 MB and 60 seconds give you the fastest time to delivery. If you are sending more than 1 GB per minute, adjust the values upward. However, keep in mind the batch size limits for Amazon Elasticsearch Service. Smaller instances are limited in the size of bulk requests they accept.
Trade off the batch sizing to ensure that you don’t overwhelm your cluster with write requests. To understand how many requests you’ll generate, start with the total size of log data that you plan to send to Firehose per second. Depending on which flush trigger you hit first, you can infer the number of flushes per second. This number is the same as the number of writes per second to the Amazon ES domain. As a general guideline, you need to have at least twice that number of vCPUs in your Amazon ES domain to handle the volume.
For example, let’s say that I am sending 1 GB/minute (or 16 MB/second) to Firehose. If I set my buffer size to 1 MB and my buffer interval to 60 seconds, I hit the Buffer size flush trigger first, at 1 MB. Here, I generate 16 flushes per second. If my cluster consists of m3.medium.elasticsearch data instances, with 1 vCPU each, I need about 32 to keep up. If I choose r3.8xlarge.elasticsearch data instances, with 32 vCPUs, I need just one.
Continuing down the screen, leave the default values for everything until you get to IAM Role.
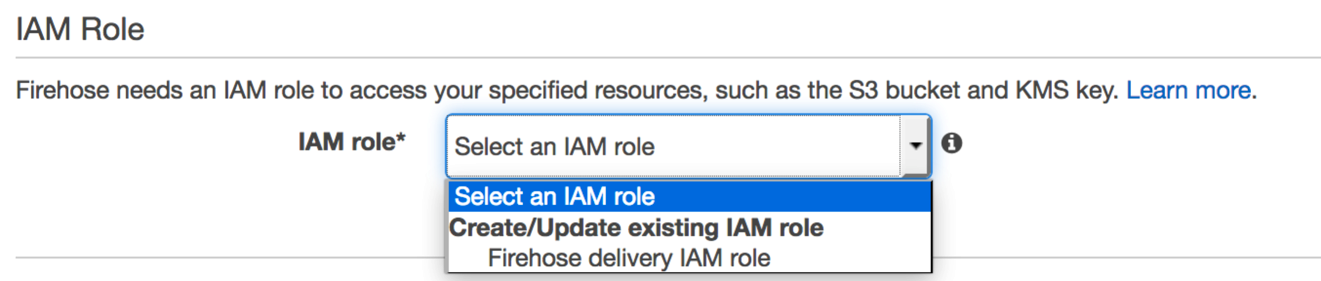
You need to create a second IAM role to allow Firehose to write to Amazon Elasticsearch Service, S3, and Amazon CloudWatch on your behalf. Choose Firehose delivery IAM role, and you’re directed to the IAM console. For IAM Role, choose Create a new IAM Role.
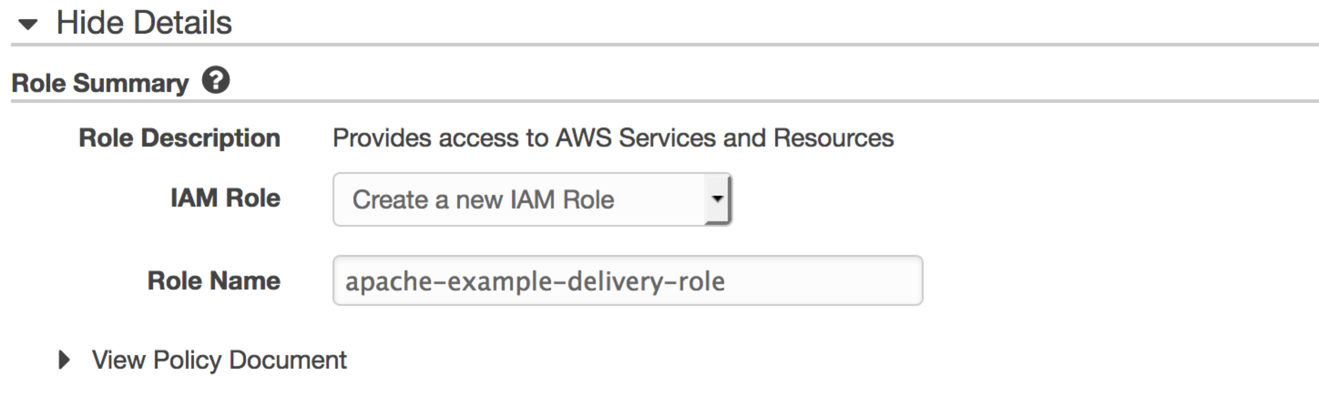
We need a new name for the role, and apache-example is already taken. We can use a name like apache-example-delivery-role. Choose Allow, and you are redirected to the Firehose console.
Choose Next, review the values you’ve set, and then choose Create Delivery Stream.
Load data
To simulate processing web logs, I’ll use the NASA Apache web logs from July 1995, available here. These logs are in Apache common log format, with the originating host, date stamp, request, result, and sizing information. Here’s a sample line.
199.72.81.55 - - [01/Jul/1995:00:00:01 -0400] "GET /history/apollo/ HTTP/1.0" 200 6245
After the Apache log to JSON transform is applied, these records arrive at Amazon Elasticsearch Service in batches with individual documents like the following.
I spun up an EC2 instance (t2.micro) running the Amazon Linux Amazon Machine Image (AMI) to serve as the test host. I used the Amazon Kinesis Agent to flow data from my file system into my Firehose stream. Amazon Kinesis Agent is a standalone Java software application that offers an easy way to collect and send data to Amazon Kinesis and to Firehose. Follow the instructions here to download and install the agent.
Make sure you follow the steps to edit the config file. You can see my config preceding. To make the agent recognize and upload the NASA data, I had to do a few things:
- Use the /tmp directory to hold the web log file.
- Make sure that when I started the agent the file did not exist.
- Cat the existing file to the file that the agent is tailing:
cat NASA_access_log_Jul95 >> /tmp/mylog.txt - Monitor the agent’s log at /var/logs/aws-kinesis-agent/aws-kinesis-agent.log. I had log lines like this:
2017-03-01 21:46:38.476+0000 ip-10-0-0-55 (Agent.MetricsEmitter RUNNING) com.amazon.kinesis.streaming.agent.Agent [INFO] Agent: Progress: 1891715 records parsed (205242369 bytes), and 1891715 records sent successfully to destinations. Uptime: 630024ms
Visualize data

I visualize the log files normally with Kibana. To run Kibana, I can choose the version provided by Amazon Elasticsearch Service. If I do, then the security setup takes some extra work, as detailed here.
As a simpler shortcut, I’ll run Kibana on my laptop and use the aws SigV4 signing proxy, available here on github. (This signing proxy was developed by a third party, not AWS. AWS is not responsible for the functioning or suitability of external content. This proxy is great for development and test, but is not suitable for production workloads.)
Download and install the proxy, run it, listening on port 9200. Download and install Kibana—the version must match your Amazon Elasticsearch Service domain’s version. Set the endpoint in kibana.yml:
elasticsearch.url: "http://localhost:9200"
Then fire up your browser and navigate to http://localhost:5601.
The first thing you need to do is configure an index pattern. Use the index root you set when you created the Firehose stream (in my case, logs*). Kibana should recognize the logs indexes and let you set the Time-field name value. Firehose provides two possibilities:
- @timestamp – the time as recorded in the file
- @timestamp_utc – available when time zone information is present in the log data
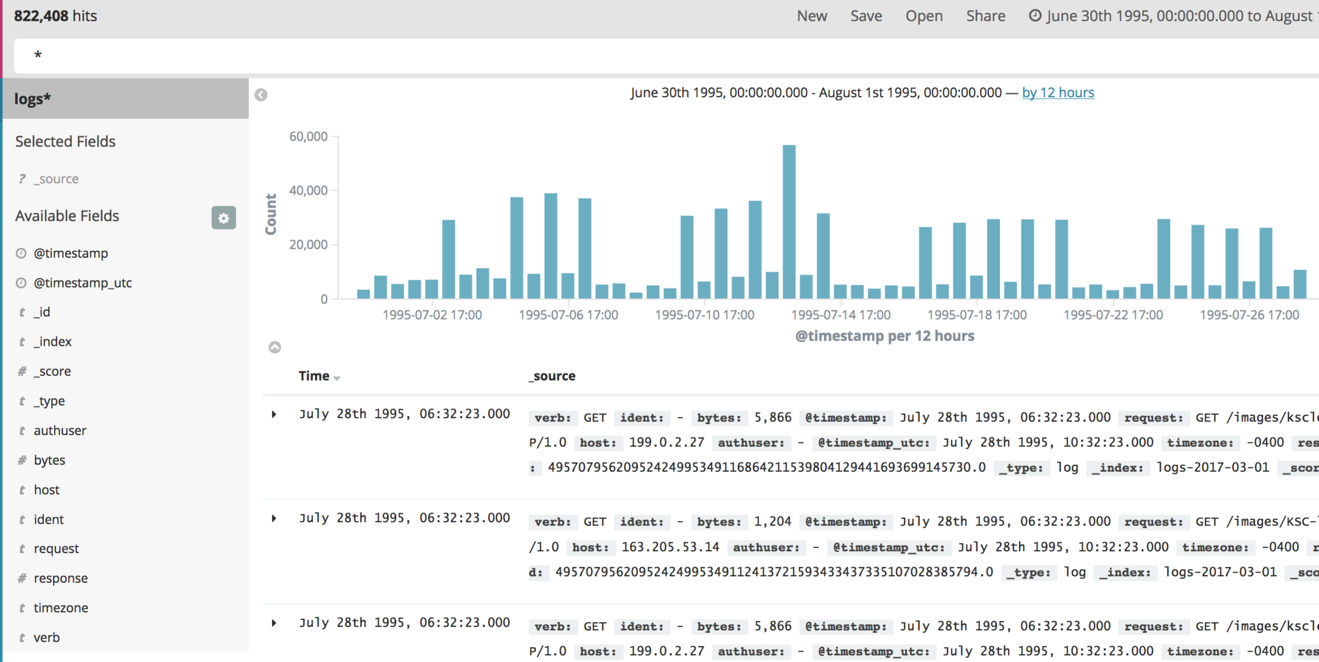
Choose either one, and you should see a summary of the fields detected. Select the discover tab, and you see a graph of events by time along with some expandable details for each event.
If you’re using the NASA dataset, you get a message that there are no results. That’s because the data is way back in 1995. Expand the time selector in the top right of the Kibana dashboard and choose an absolute time. Pick a start of June 30, 1995, and an end of August 1, 1995. You’ll see something like this.
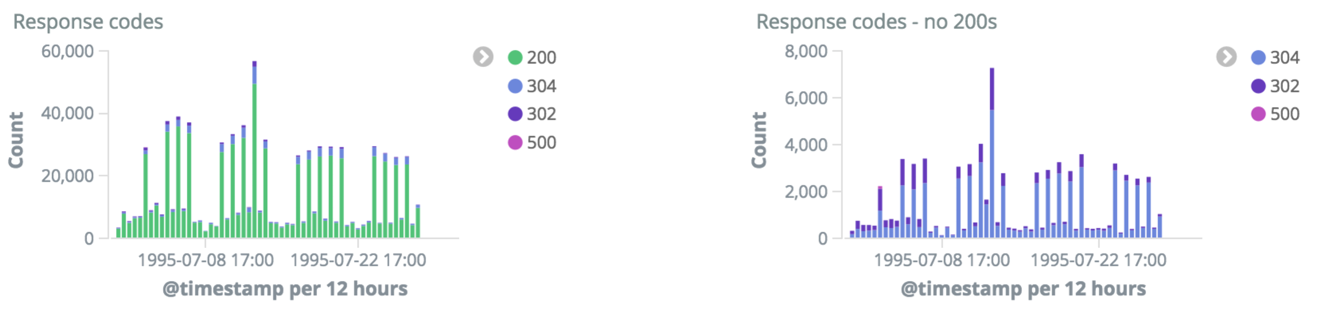
You can go on to create visualizations—for example, detailing the error counts. Here’s a pair of graphs with HTTP response codes, the first with 200s and the second without.
Conclusion
With Amazon Elasticsearch Service, Amazon Kinesis Firehose, and Kibana, you can send your own Apache web logs to Amazon Elasticsearch Service in an easy, scalable way. I showed how to set up an Amazon Elasticsearch Service domain. Next, I showed how to create a Firehose stream including a Lambda function to transform the log lines from Apache common log format to Elasticsearch format. I demonstrated how to use the Kinesis Agent to stream the logs from the originating server to Firehose, and how to view the results in Kibana.
Let us know what log files you send, and happy logging!
About the Author
 Jon Handler (@_searchgeek) is an AWS solutions architect specializing in search technologies. He works with our customers to provide guidance and technical assistance on database projects, helping them improve the value of their solutions when using AWS.