AWS Developer Tools Blog
Debugging .NET Core AWS Lambda functions using the AWS .NET Mock Lambda Test Tool

How to debug AWS Lambda functions is one of the most common questions we get from developers creating Lambda functions for .NET Core. The best practice is to write repeatable and automated tests to ensure that your functions stay correct as you make changes to them using frameworks like xUnit.net. The programming model for Lambda is simple enough that testing is generally no different from testing your class libraries. Most of the Lambda blueprints provided in Visual Studio have the option to create an accompanying xUnit.net test project.
There are times when quick ad-hoc testing is necessary. To help with ad-hoc testing, we recently released the AWS .NET Mock Lambda Test Tool. This tool isn’t a local Lambda runtime. It’s a tool to quickly load up your Lambda function code and test your application logic. It provides functionality similar to the quick F5 debugging experience.
Because the tool is a .NET Core application that loads your code into its process, any IDE that can debug .NET Core can attach to this tool and enable you to debug your Lambda functions. The latest version of the AWS Toolkit for Visual Studio takes care of configuring the Lambda test tool as the debug target when you open a .NET Core Lambda project. The test tool’s README file contains instructions on how to configure it for use with Visual Studio Code, Visual Studio for Mac, or JetBrain’s Rider.
Debugging with JSON event documents
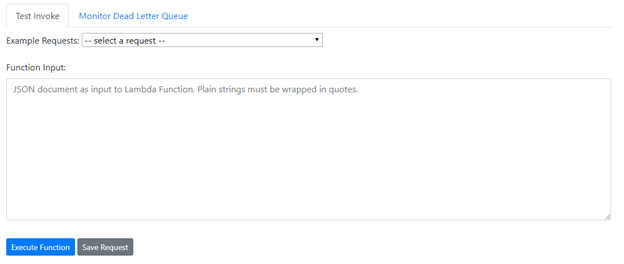
You can debug a Lambda function using one of the many sample JSON event documents that the test tool provides, or you can provide your own event document. You can also save the event document so it can be reused in subsequent debugging sessions. Once you select the event document you want, choose Execute Function to have the Lambda test tool execute your Lambda function code using the event document. AWS credentials are provided to the Lambda function using the selected AWS SDK profile.
Debugging a dead-letter queue
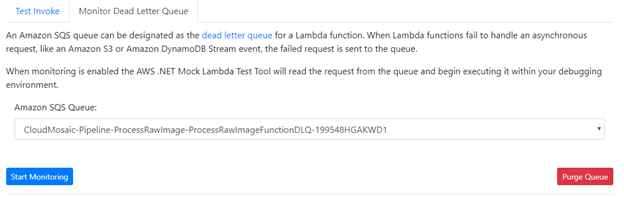
The other way to use the AWS .NET Mock Lambda Test Tool for debugging is to monitor a Lambda function’s dead-letter queue. Dead-letter queues are useful when you’re trying to track down infrequent failures that are happening in a deployed system. See the AWS Lambda Developer Guide for more information about dead-letter queues.
A dead-letter queue is an Amazon SQS queue that’s assigned to the Lambda function. Here is an example of that assignment in an AWS CloudFormation template.

When a Lambda function is called asynchronously, like when responding to an Amazon S3 event, and the Lambda function fails, the Lambda service repeatedly attempts to process the event in case the problem was an intermittent issue. If the event continues to fail, the Lambda service adds the event to the assigned dead-letter queue. With the Lambda test tool you can monitor that queue and, if a message is read, the Lambda test tool will attempt to execute the Lambda function code within the test tool with the event from the dead-letter queue. This provides a mechanism to replay the failed event locally without disrupting your deployed system.
AWS re:Invent demo of the tool
At our recent breakout session at AWS re:Invent, we used the AWS .NET Mock Lambda Test Tool to diagnose some failing Lambda functions. Here is the link to the full video https://www.youtube.com/watch?v=FteCJQcTDc4.
If you want to skip ahead in the video, we demoed the dead-letter queue debugging at about the 20-minute marker, and debugging an AWS Step Functions state machine at about the 35-minute marker.
Feedback
The AWS .NET Mock Lambda Test Tool is an open source tool on our .NET Lambda repository. We would love to hear your feedback on the tool and on how we can evolve the tool to improve your productivity developing and debugging .NET Core Lambda functions.