AWS Developer Tools Blog
Deep dive into AWS X-Ray groups and use cases
AWS X-Ray helps developers analyze and debug distributed applications, such as those built using a microservices architecture. With X-Ray, you can understand how your application and its underlying services are performing to identify and troubleshoot the root cause of performance issues and errors. X-Ray not only enables developers and DevOps engineers to get to the root cause of the issue more quickly, but also helps in understanding who is impacted and by how much.
Many customers are moving toward the modern microservices architecture, where the services being developed are tested against production APIs. Creating data boundaries at the onset doesn’t allow for slicing and dicing the data as the organization or service structure changes. To address this, X-Ray provides a global view of traces for the AWS account or AWS Region.
Customers also have multiple applications and workflows running within their account. It’s important to view them individually to understand any performance bottlenecks and issues that might be affecting end users. To address this, we introduced X-Ray groups, which enable customers to slice and dice their X-Ray service graph and focus on certain workflows, applications, or routes.
Customers can create a group by setting a filter expression. All the traces that match the set filter expression will be part of that group. Customers can then view service graphs for the selected group, and understand performance bottlenecks, errors, or faults in services belonging to that service graph.
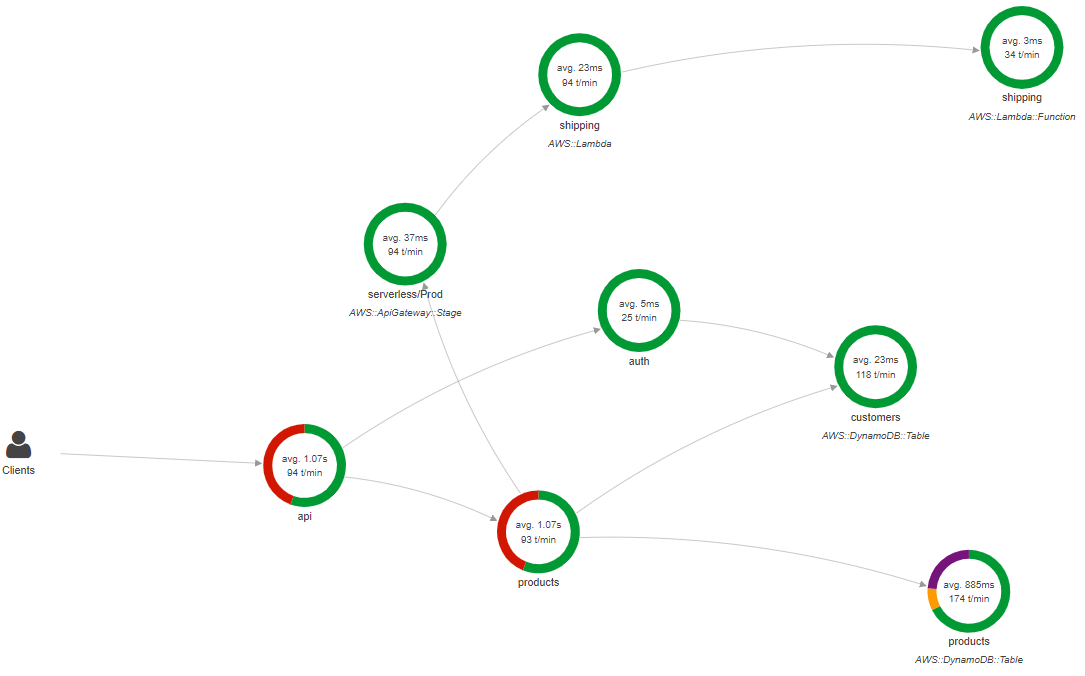
Let’s use the following example to look closely into some of the use cases where X-Ray groups are helpful. As you can see in the X-Ray service graph, I have two different workflows. The first is a web application running on my Amazon EC2 instance, calling an authentication service that validates the information in the database. The second is the Serverless API running on Amazon API Gateway, and AWS Lambda talking to Amazon DynamoDB.

Focus on certain applications or workflows
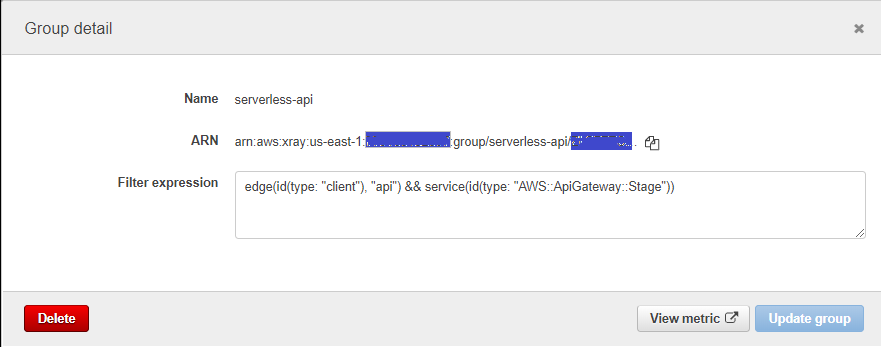
Let’s say that in these two workflows I have a serverless order placement API running on API Gateway and Lambda as one workflow. I have another order processing application that runs on Amazon Elastic Container Service (Amazon ECS). I want a view of my Serverless API to understand how they’re performing.
I would create a group with the filter expression “edge(id(type: “client”), “api”) && service(id(type: “AWS::ApiGateway::Stage”))”. This group will show traces that start at the “api” node, and includes calls to API Gateway. The type: “client” portion in the edge represents an end user, and the second parameter, api, indicates the node the end user is interacting with directly.
The newly generated service graph for this group looks like the following.
Send notifications on increased error and fault rate
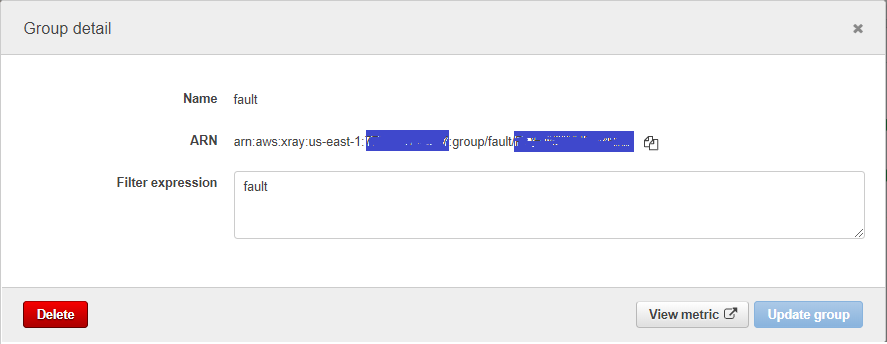
X-Ray automatically creates an Amazon CloudWatch metric for each group that indicates the number of traces that belong to that group. Customers can use this to alert on faults or errors if the value crosses a certain threshold using CloudWatch alarms. An example of the group and a view of corresponding CloudWatch metrics is shown below.

Increase visibility on specific service latency
With X-Ray groups, customers can focus on certain services that are taking longer than normal to run, and get notified when a threshold is breached. Or they can query multiple metrics and use math expressions to create new time series based on these metrics. For example, customers can get a view of a service graph where Lambda functions are taking more than one second, as shown below.

To get started, open the X-Ray console and create groups on the Service Graphs page. You can learn more about the X-Ray service here and use the developer guide to get started.
Let us know what you think about the service and X-Ray groups in the comments below.