AWS DevOps Blog
Debugging with Amazon CloudWatch Synthetics and AWS X-Ray
Today, AWS X-Ray launches support for Amazon CloudWatch Synthetics, enabling developers to trace end-to-end requests from configurable scripts called “canaries”. These canaries run the test script to monitor web endpoints and APIs using modular, light-weight tests that run 24×7, once per minute. It continuously captures the behavior and availability of the endpoint or URL being monitored, reporting what end-customers are seeing. Customers get alerted immediately in case of failures and tie them back to the root-cause using traces. These canaries provide a complete picture of all the services invoked in the path. With this feature, developers and DevOps engineers can correlate failures in the application with the impact on end customers, determine the root cause of the failures, and identify the upstream and downstream services impacted.
Overview
X-Ray helps developers and DevOps engineers analyze and debug distributed applications, such as applications built with microservice architecture. Using X-Ray, you can understand how your application and its underlying services are performing in order to identify and troubleshoot the root causes of performance issues and errors. X-Ray helps you debug and triage distributed applications, wherever those applications are running, and whether the architecture is serverless, containers, Amazon EC2, on-premises, or a mixture of all of the above.
Amazon CloudWatch Synthetics is a fully managed synthetic monitoring service that allows developers and DevOps engineers to view their application endpoints and URLs using configurable scripts called “canaries” that run 24×7. Canaries alert you as soon as something does not work as expected, as defined by your script. CloudWatch Synthetics canaries can be customized to check for availability, latency, transactions, broken or dead links, step-by-step task completions, page load errors, load latencies for UI assets, complex wizard flows, or checkout flows in your applications.
CloudWatch Synthetics supports End-User Experience Monitoring (EUEM—Synthetic Monitoring), Web Services Monitoring (REST APIs), URL Monitoring, and Website Content Monitoring (protection from unauthorized changes in your websites from phishing, code injection, and cross-site scripting). Canary traffic can continually verify your customers’ experiences even when you don’t have any customer traffic. Canaries can discover issues as soon as your customers do.
Use cases
Here are some of the use cases for which developers and DevOps engineers can use AWS X-Ray with Amazon CloudWatch Synthetics.
Determine if there is a problem
You can determine if there is a problem with your CloudWatch Synthetics canaries by setting CloudWatch alarms based on certain thresholds. You can also determine an increase in errors, faults, throttling rates, or slow response times within your X-Ray Service Map.
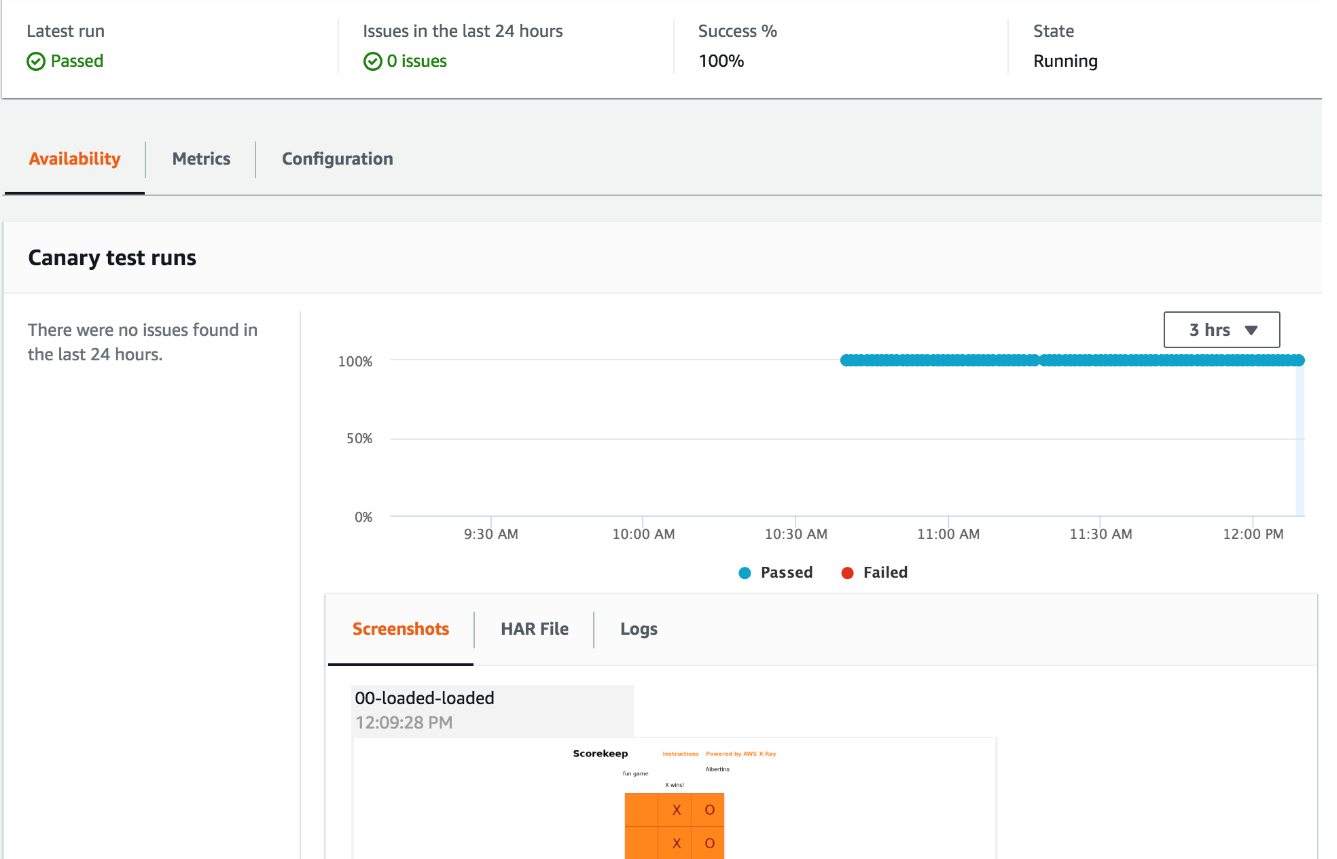
Developers can set up thresholds on canaries in Amazon CloudWatch Synthetics console which creates CloudWatch alarms to understand if there were any issues. These thresholds are managed centrally to help you get alerted based on the granularity of the test run. They can then use Amazon Simple Notification Service (SNS) or CloudWatch Event for their alerts. For example, you can set a notification when the canary fails 5 times in 5 runs if the canary runs once per min. You can further analyze and triage HAR File, screenshots and logs in the CloudWatch Synthetics console.


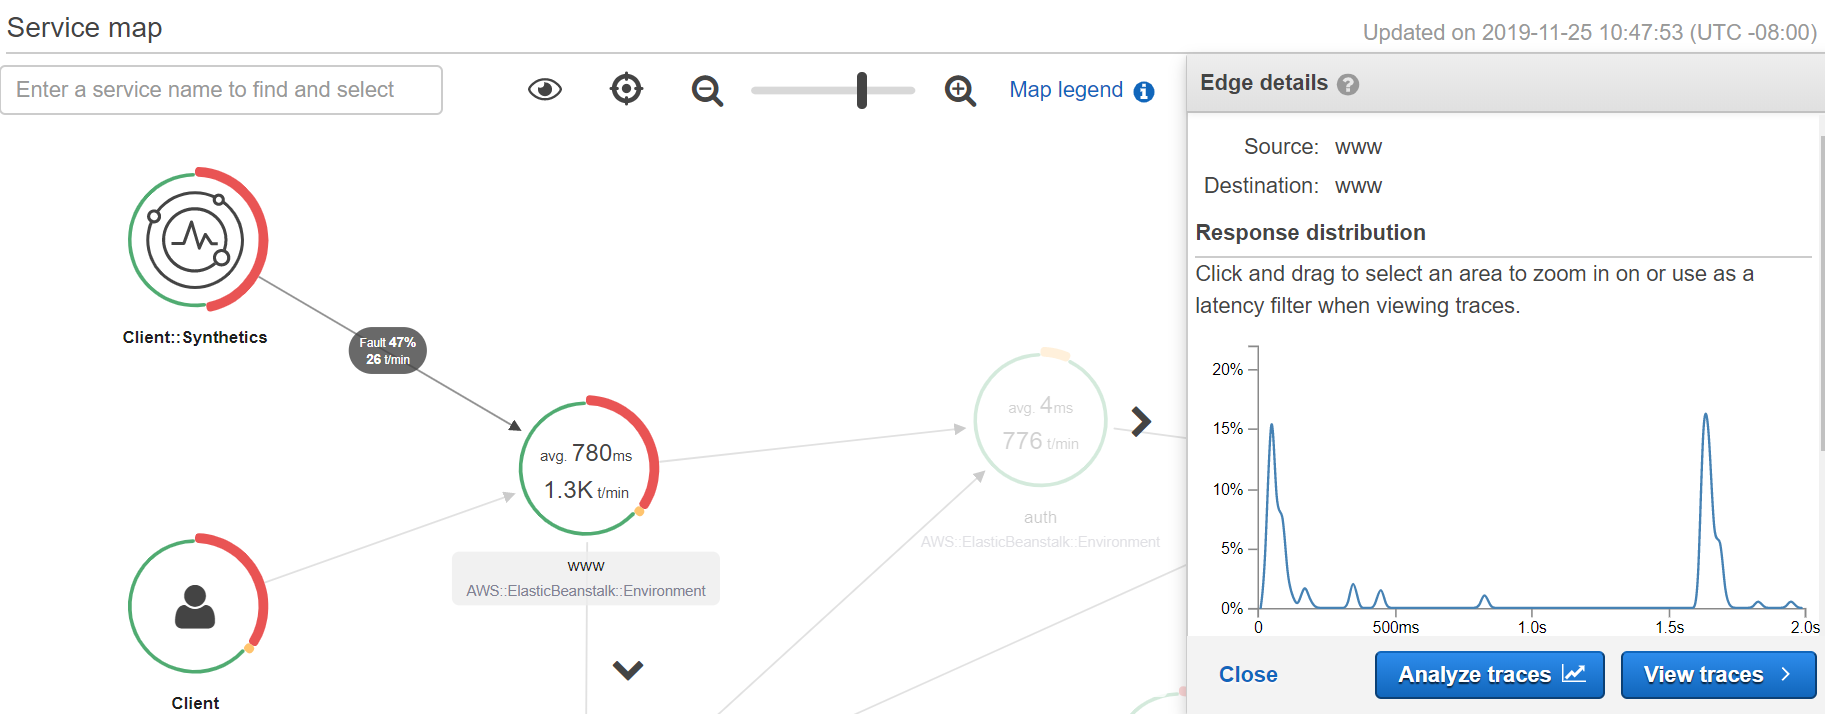
Developers can also use the new synthetic canary client nodes with type Client::Synthetics in AWS X-Ray console to pinpoint which synthetic canaries are experiencing issues with errors, faults, or throttling rates for the selected time frame. Select the synthetic canary node to view the response time distribution of the entire request. Zoom into a specific time range and dive deep into analyzing trends using X-Ray Analytics, as shown in the following screenshot of a service map with a synthetic canary client node.
Find the root cause of ongoing failures
You can find the root cause of ongoing failures in upstream and downstream services to reduce the mean time to resolution.
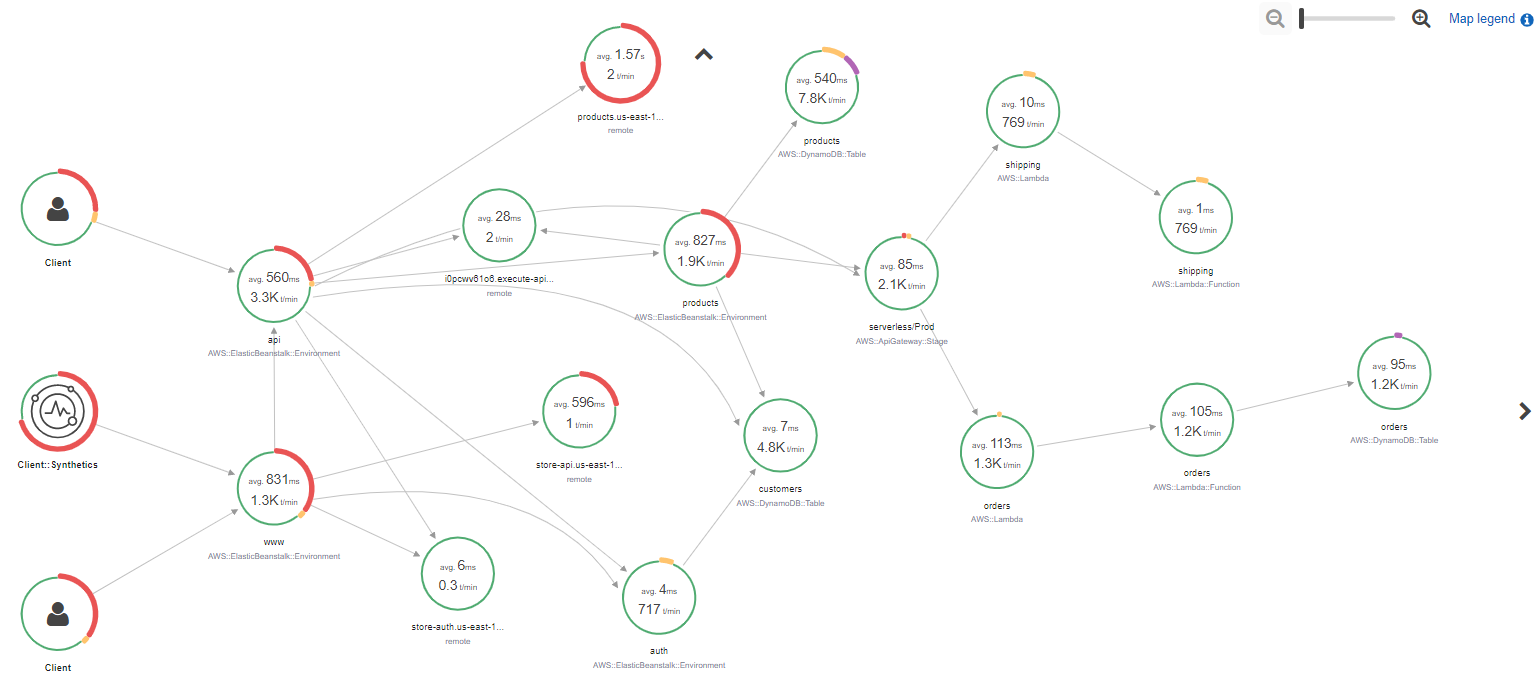
Developers can view the end-to-end path of requests within the X-Ray service map to easily understand the services invoked, as well as the upstream and downstream services. You can also use trace maps for individual traces to dissect each request and determine which service results in the most latency or is causing an error, as shown in the following diagrams.

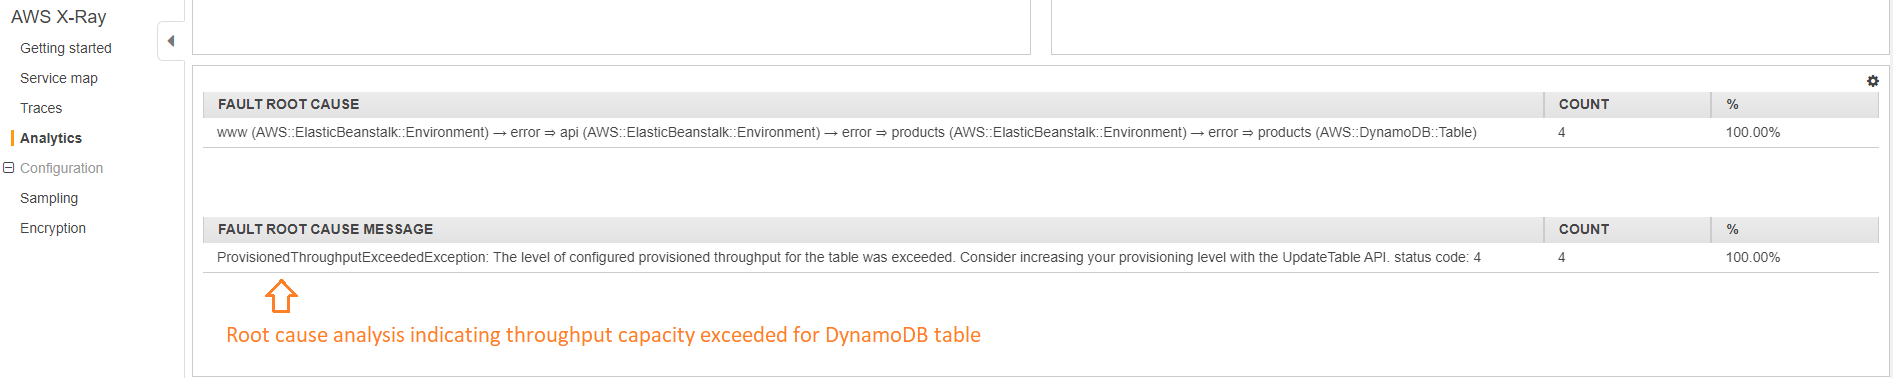
Once you receive a CloudWatch alarm for failures in a synthetic canary, it becomes critical to determine the root cause of the issue and reduce the impact on end users. Developers can use X-Ray Analytics to address this. X-Ray performs statistical modeling on trace data to determine the probable root cause of an issue. As you can see in the following screenshots, the synthetic tests for console “www” that is running on AWS Elastic Beanstalk are failing. It is because of the throughput capacity exception from the DynamoDB table, impacting the product microservice. This can be quickly determined in the X-Ray Analytics console. Also, developers can determine which of their canary tests are causing this issue using the already created X-Ray annotation “Annotation.aws:canary_arn”.

Identify performance bottlenecks and trends
You can identify performance bottlenecks and trends seen by your Synthetics canaries’ traces over time.
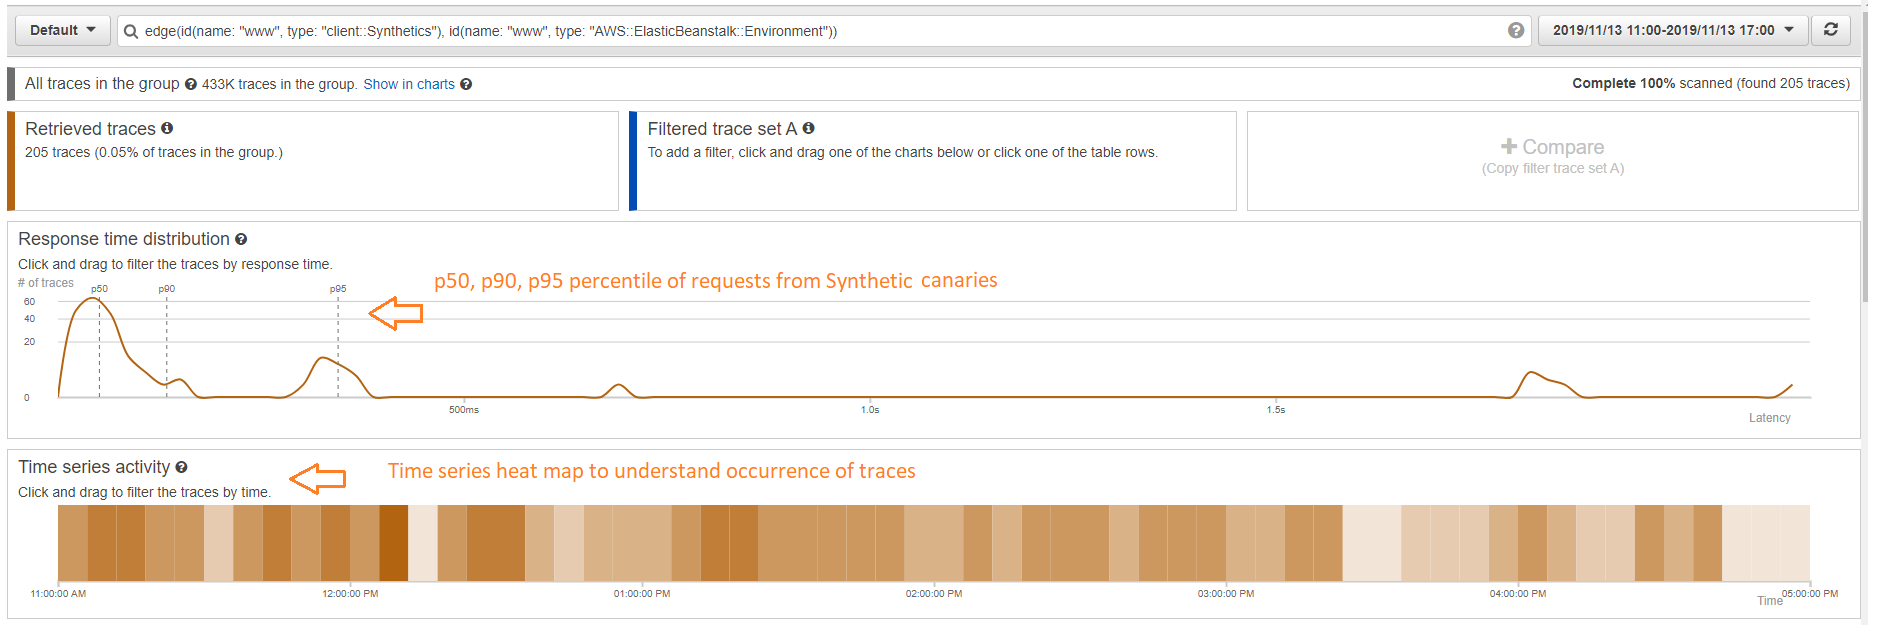
View trends in performance of your website or endpoint over time using the continuous traffic from your synthetic canaries to populate a response time histogram over a period of time. Understand the p50, p90, and p95 percentile for your requests originating from Synthetics tests and determine proportion of failures and time series activity to determine the time of occurrence.
Compare latency and error/fault rates and experience of end user with Synthetic canaries
You can compare latency and error/fault rates and end-user experiences with the Synthetic canaries.
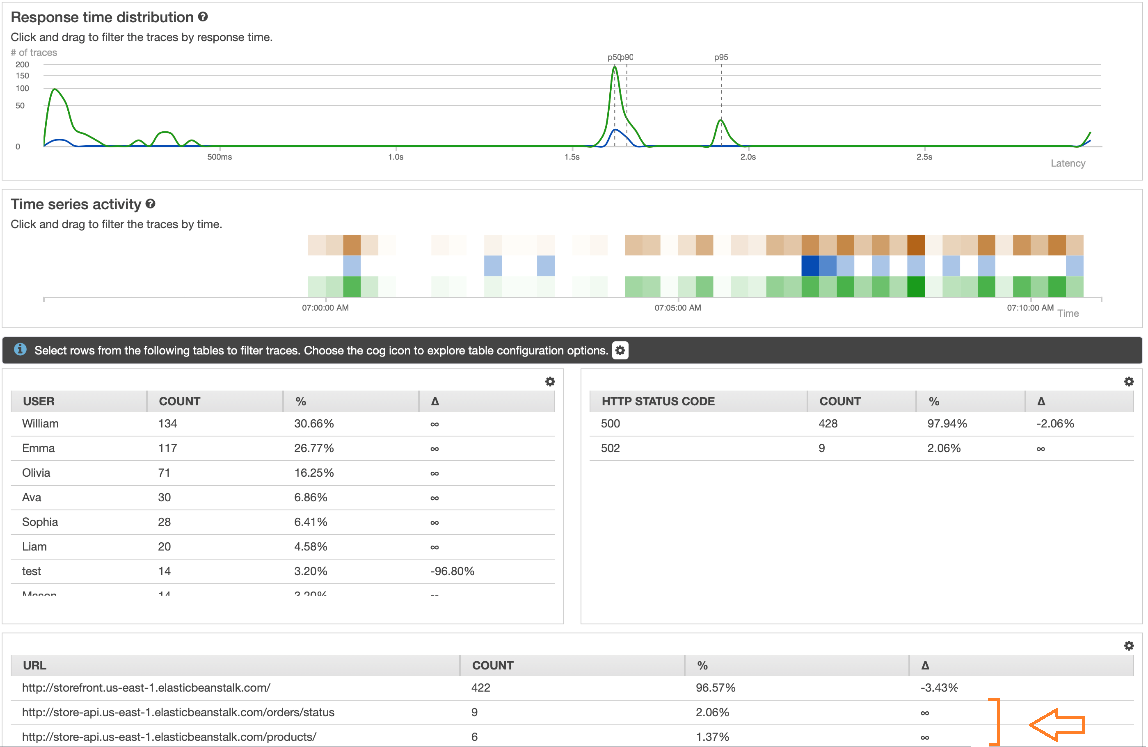
Using X-Ray Analytics, developers can compare any two trends or collection of traces. For example, in the below diagram, we are comparing the experience of end users using the system (shown in blue trend line) to what the Synthetics tests are reporting (shown in green trend line), which started around 3:00 am. We can easily identify that Synthetics tests are reporting more 5xx errors as compared to end users.

Identify if you have enough canary coverage for all the API’s and URLs.
When debugging synthetic canaries, developers and DevOps engineers are looking to understand if they have enough coverage for their APIs and URLs and if their Synthetic canaries have adequate tests. Using X-Ray Analytics, developers will be able to compare the experience of Synthetic canaries with the rest of their end users. The screenshot below shows blue trend line for canaries and green for the rest of the users. You can also identify that two out of the three URLs don’t have canary tests.
Slice and dice the X-Ray service map to focus only on Synthetics tests and its path to downstream services using X-Ray groups
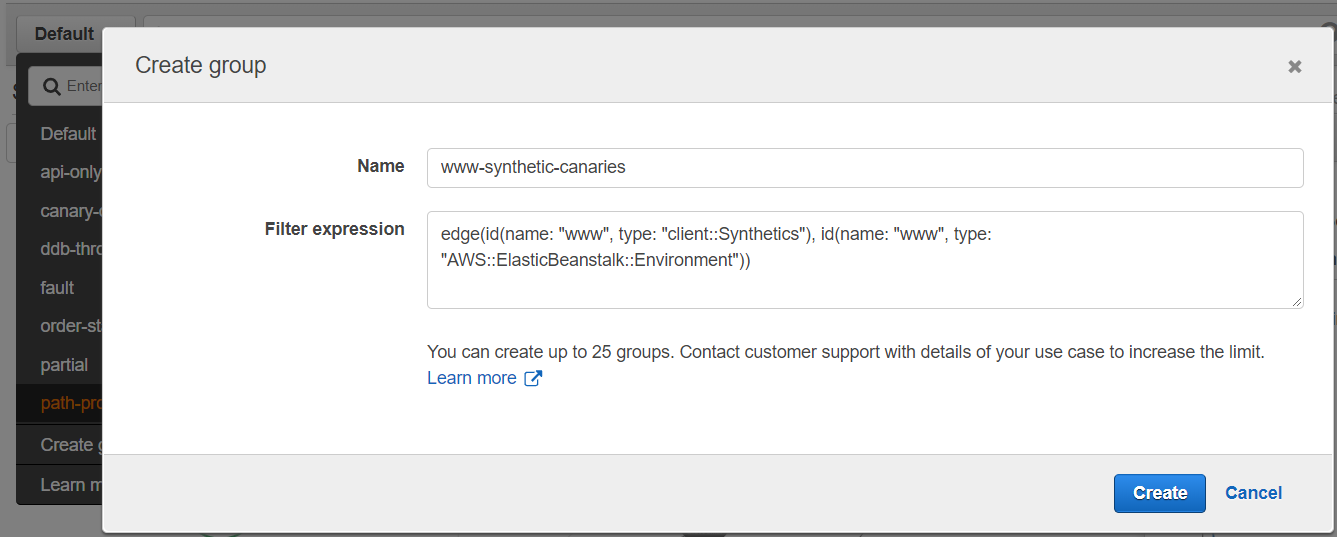
Developers can have multiple APIs and applications running within an account. It becomes critical at that point to focus on certain set of workflows like Synthetics tests for application “www” running on AWS Elastic Beanstalk as shown below. Developers can create X-Ray Group by using a filter expression “edge(id(name: “www”, type: “client::Synthetics”), id(name: “www”, type: “AWS::ElasticBeanstalk::Environment”))” to just focus on traces generated by their Synthetics tests for “www”.
Getting Started
Getting started with Synthetics is easy. Enable X-Ray tracing for your APIs, web application endpoints and, URLs being monitored by Synthetics canaries. Visit the documentation to learn more about getting started using AWS X-Ray with Amazon CloudWatch Synthetics.
Conclusion
In this post, I outlined how you can use AWS X-Ray to debug and triage canaries running in Amazon CloudWatch Synthetics. We looked at some of the use cases that will enable developer and DevOps engineers to reduce time to resolution by viewing the end-to-end path of the request, determining the root cause of the issue and understanding which upstream or downstream services are impacted.