AWS DevOps Blog
Improve the performance of Lambda applications with Amazon CodeGuru Profiler
As businesses expand applications to reach more users and devices, they risk higher latencies that could degrade the customer experience. Slow applications can frustrate or even turn away customers. Developers therefore increasingly face the challenge of ensuring that their code runs as efficiently as possible, since application performance can make or break businesses.
Amazon CodeGuru Profiler helps developers improve their application speed by analyzing its runtime. CodeGuru Profiler analyzes single and multi-threaded applications and then generates visualizations to help developers understand the latency sources. Afterwards, CodeGuru Profiler provides recommendations to help resolve the root cause.
CodeGuru Profiler recently began providing recommendations for applications written in Python. Additionally, the new automated onboarding process for AWS Lambda functions makes it even easier to use CodeGuru Profiler with serverless applications built on AWS Lambda.
This post highlights these new features by explaining how to set up and utilize CodeGuru Profiler on an AWS Lambda function written in Python.
Prerequisites
This post focuses on improving the performance of an application written with AWS Lambda, so it’s important to understand the Lambda functions that work best with CodeGuru Profiler. You will get the most out of CodeGuru Profiler on long-duration Lambda functions (>10 seconds) or frequently invoked shorter generation Lambda functions (~100 milliseconds). Because CodeGuru Profiler requires five minutes of runtime data before the Lambda container is recycled, very short duration Lambda functions with an execution time of 1-10 milliseconds may not provide sufficient data for CodeGuru Profiler to generate meaningful results.
The automated CodeGuru Profiler onboarding process, which automatically creates the profiling group for you, supports Lambda functions running on Java 8 (Amazon Corretto), Java 11, and Python 3.8 runtimes. Additional runtimes, without the automated onboarding process, are supported and can be found in the Java documentation and the Python documentation.
Getting Started
Let’s quickly demonstrate the new Lambda onboarding process and the new Python recommendations. This example assumes you have already created a Lambda function, so we will just walk through the process of turning on CodeGuru Profiler and viewing results. If you don’t already have a Lambda function created, you can create one by following these set up instructions. If you would like to replicate this example, the code we used can be found on GitHub here.
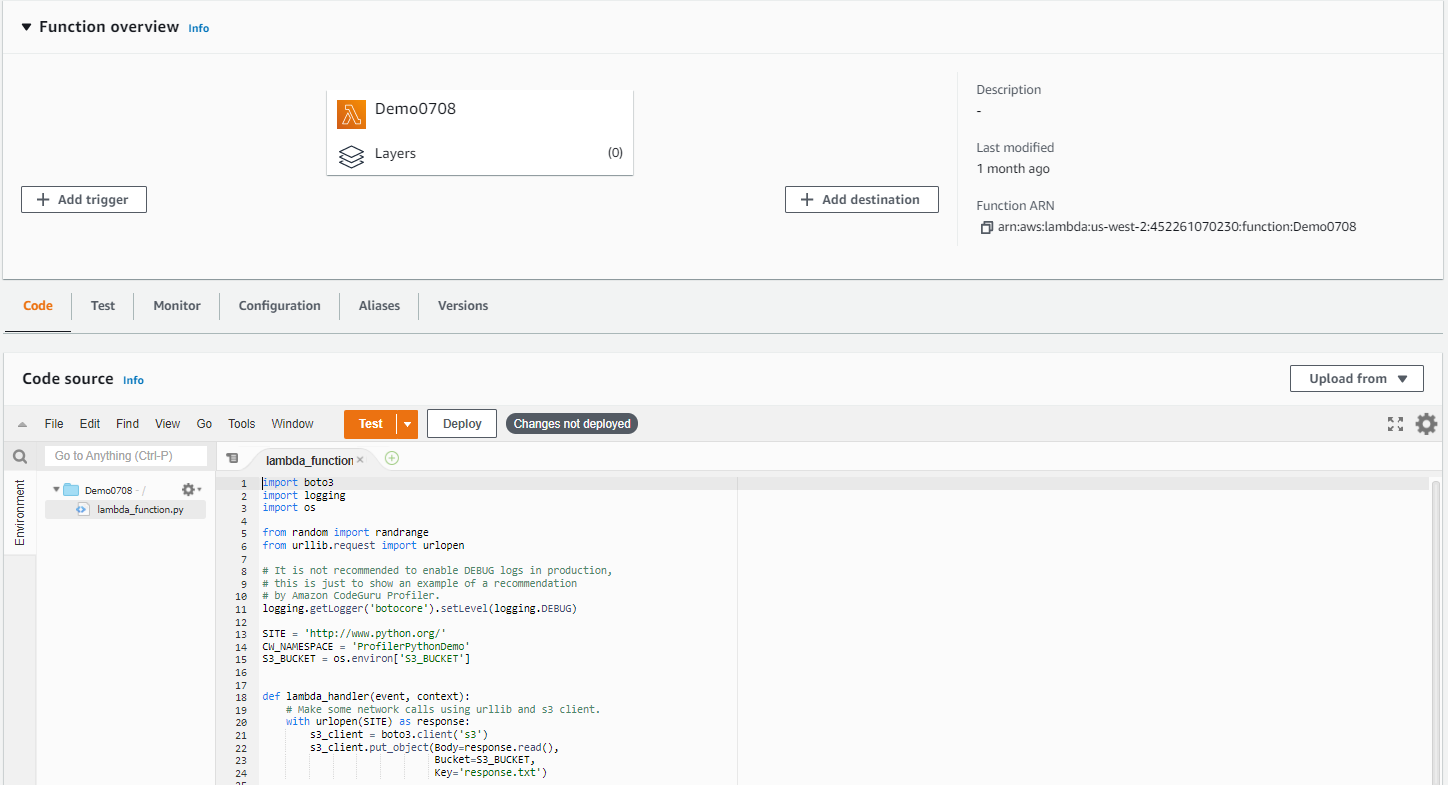
- On the AWS Lambda Console page, open your Lambda function. For this example, we’re using a function with a Python 3.8 runtime.
2. Navigate to the Configuration tab, go to the Monitoring and operations tools page, and click Edit on the right side of the page.

3. Scroll down to “Amazon CodeGuru Profiler” and click the button next to “Code profiling” to turn it on. After enabling Code profiling, click Save.
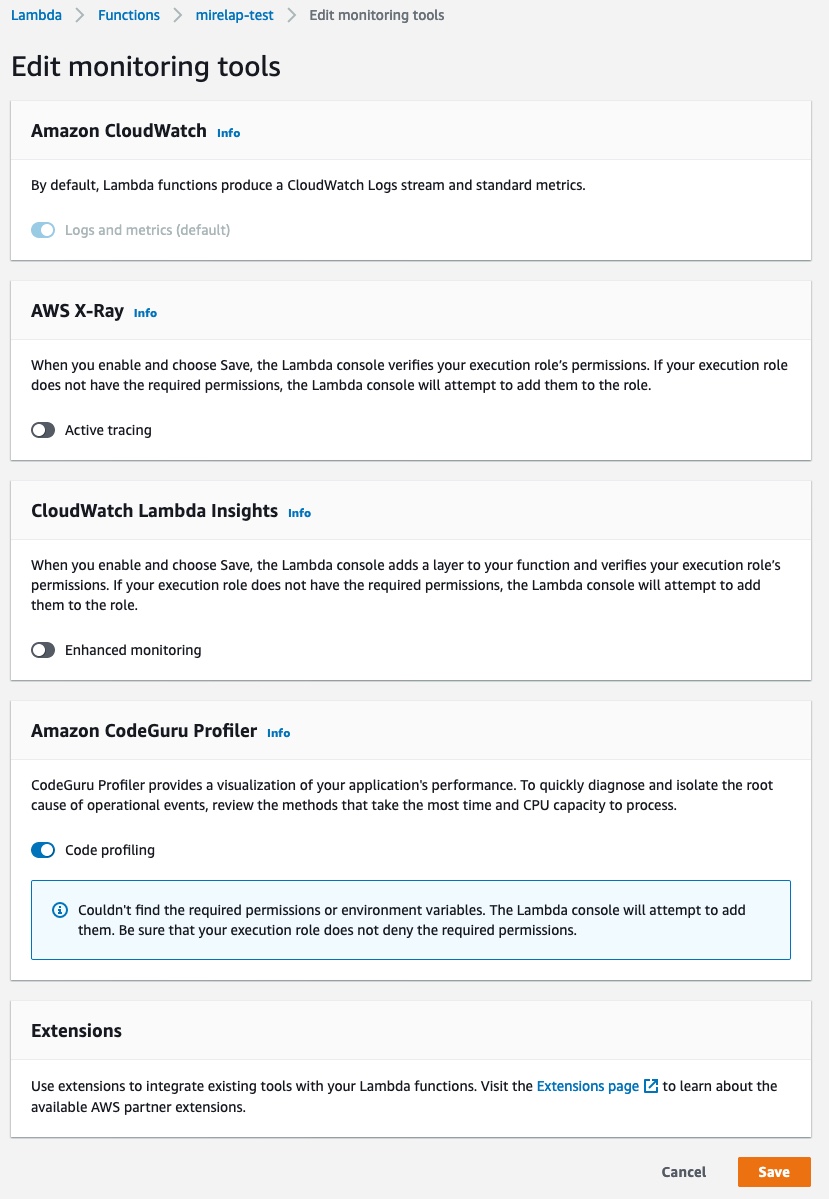
4. Verify that CodeGuru Profiler has been turned on within the Monitoring and operations tools page

That’s it! You can now navigate to CodeGuru Profiler within the AWS console and begin viewing results.
Viewing your results
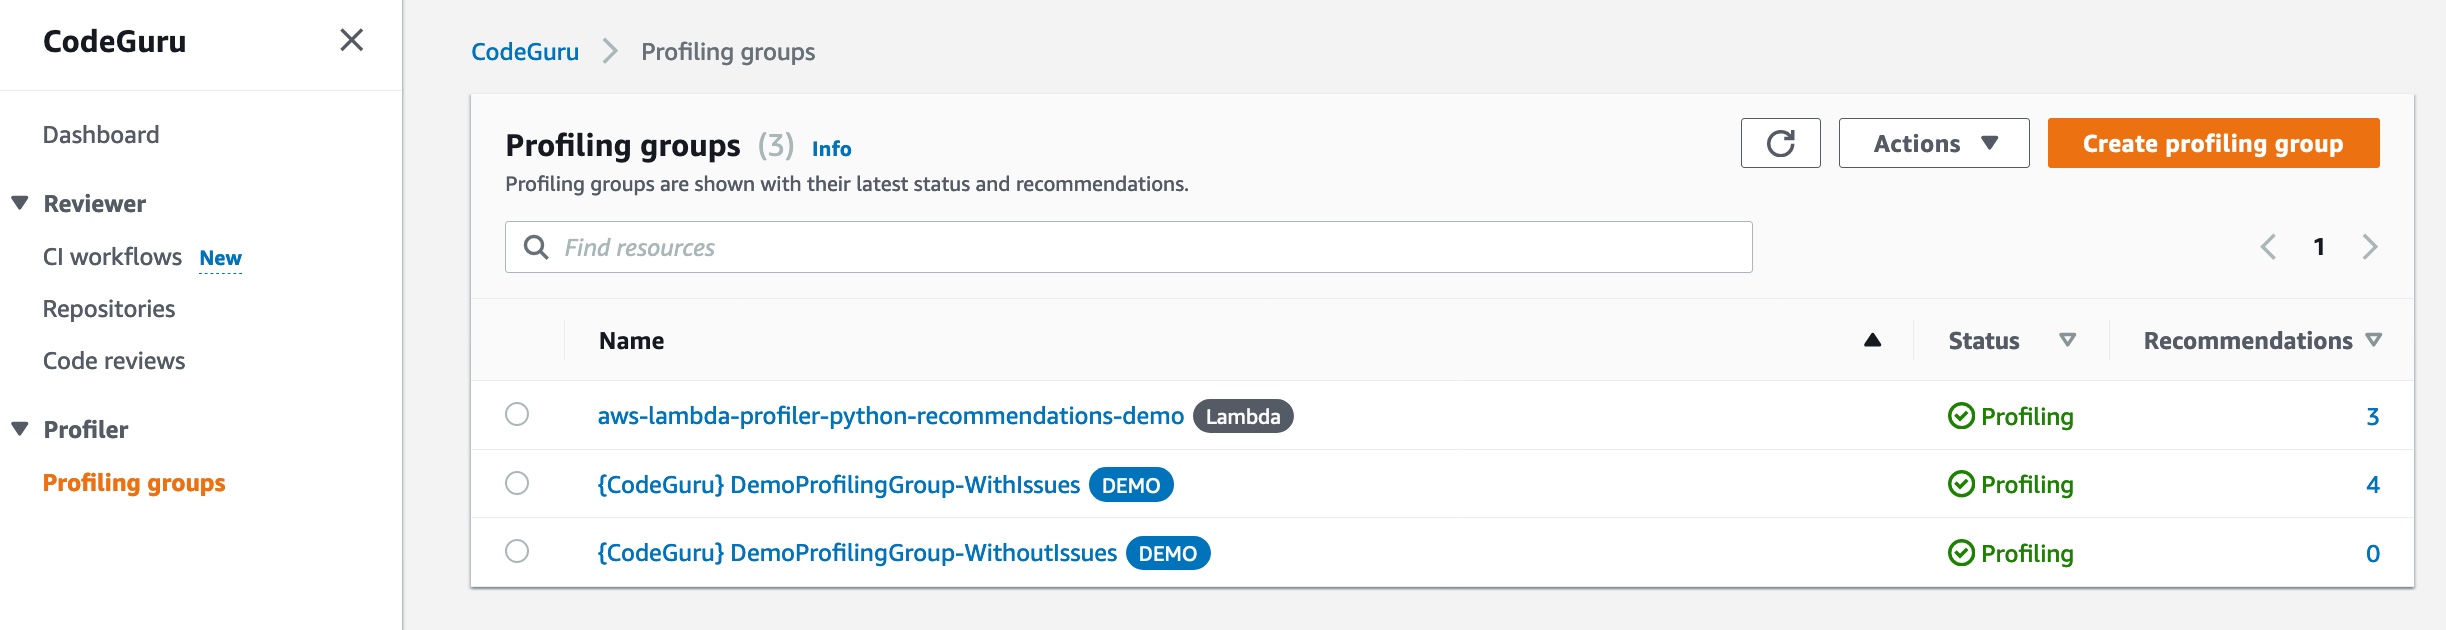
CodeGuru Profiler requires 5 minutes of Lambda runtime data to generate results. After your Lambda function provides this runtime data, which may need multiple runs if your lambda has a short runtime, it will display within the “Profiling group” page in the CodeGuru Profiler console. The profiling group will be given a default name (i.e., aws-lambda-<lambda-function-name>), and it will take approximately 15 minutes after CodeGuru Profiler receives the runtime data before it appears on this page.
After the profile appears, customers can view their profiling results by analyzing the flame graphs. Additionally, after approximately 1 hour, customers will receive their first recommendation set (if applicable). For more information on how to reading the CodeGuru Profiler results, see Investigating performance issues with Amazon CodeGuru Profiler.
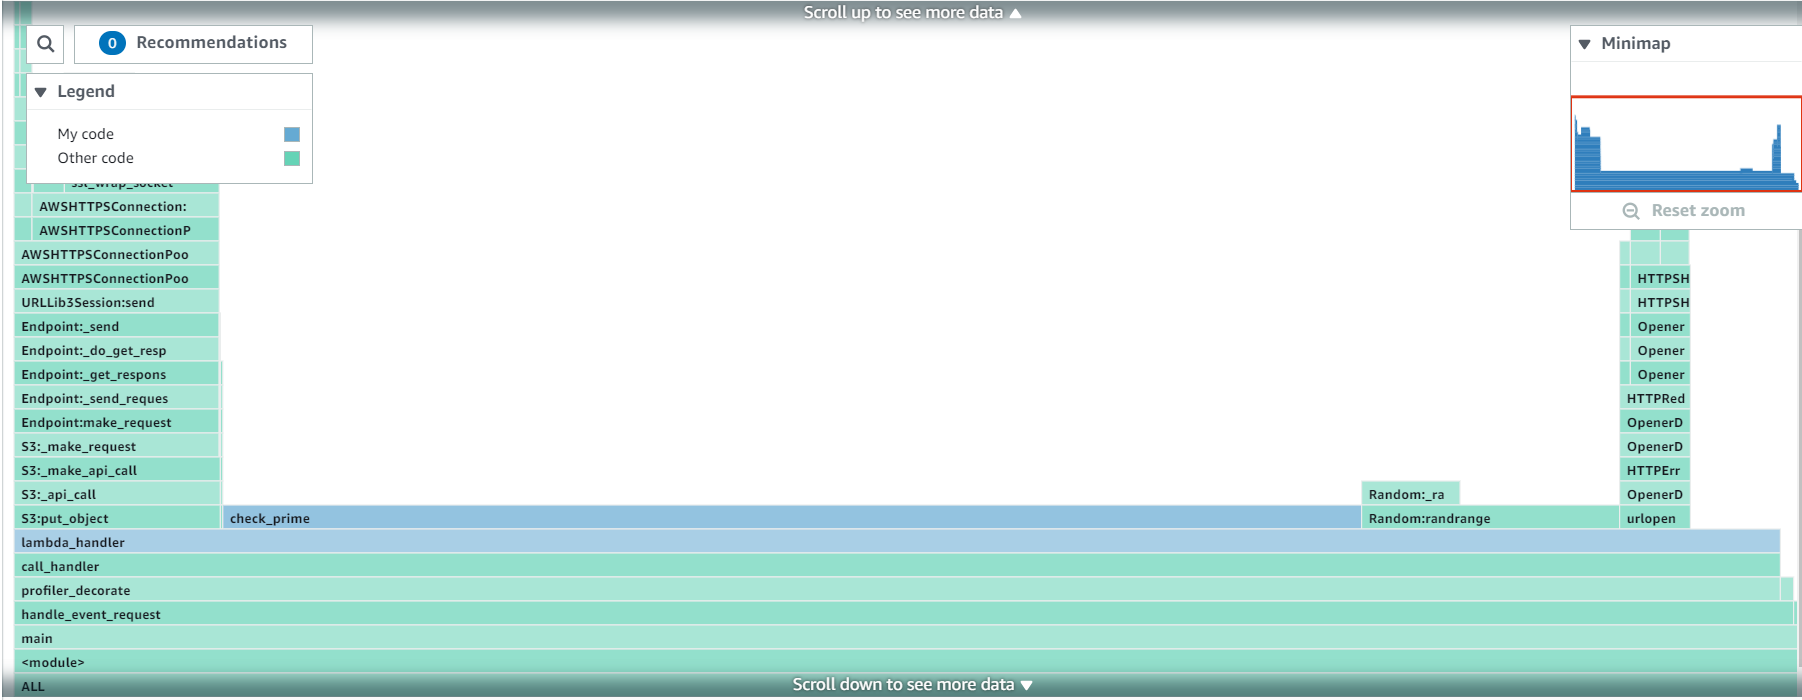
The below images show the two flame graphs (CPU Utilization and Latency) generated from profiling the Lambda function. Note that the highlighted horizontal bar (also referred to as a frame) in both images corresponds with one of the three frames that generates a recommendation. We’ll dive into more details on the recommendation in the following sections.
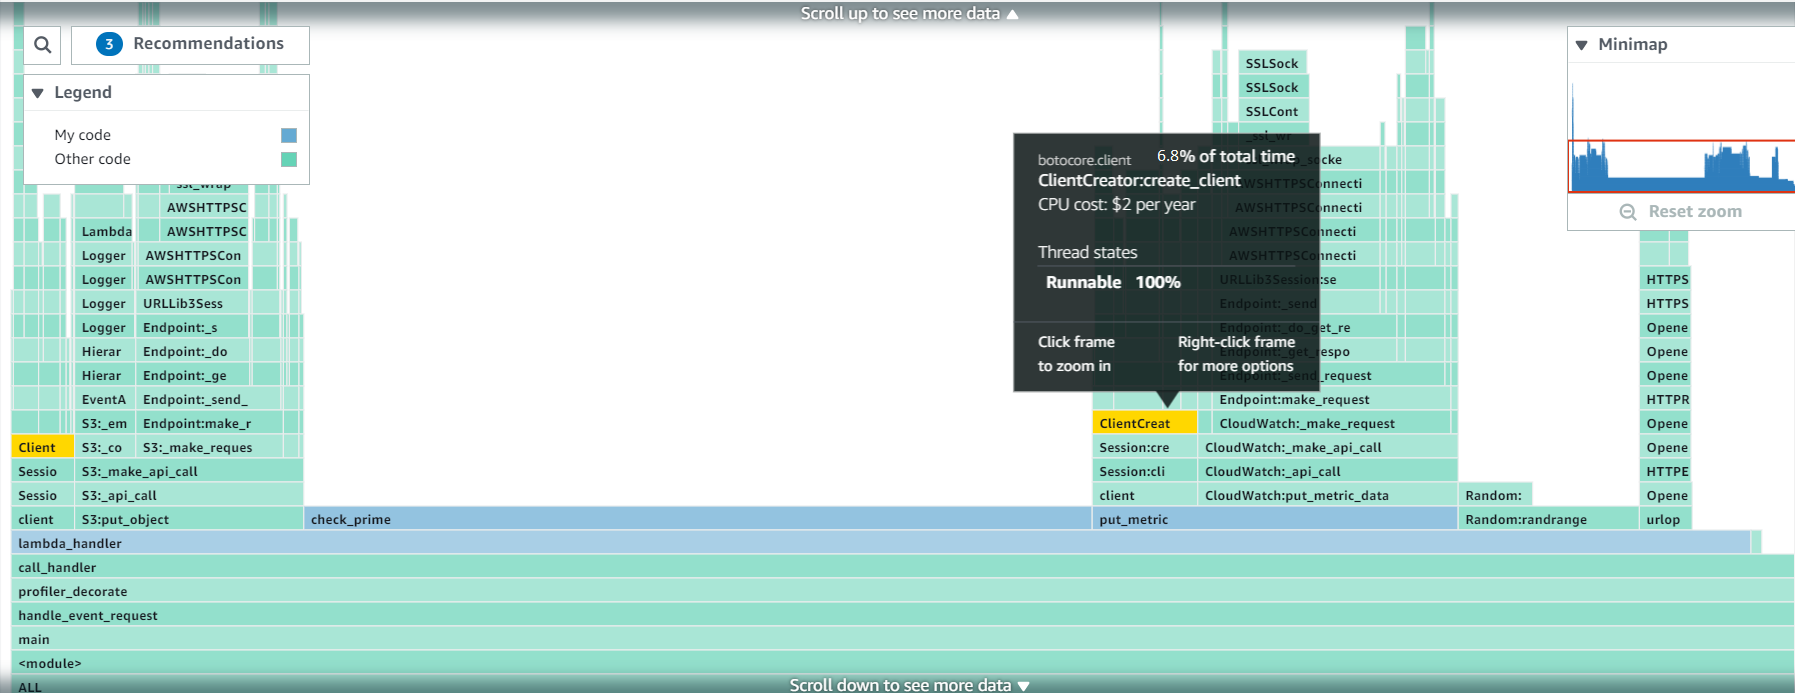
CPU Utilization Flame Graph:
Latency Flame Graph:

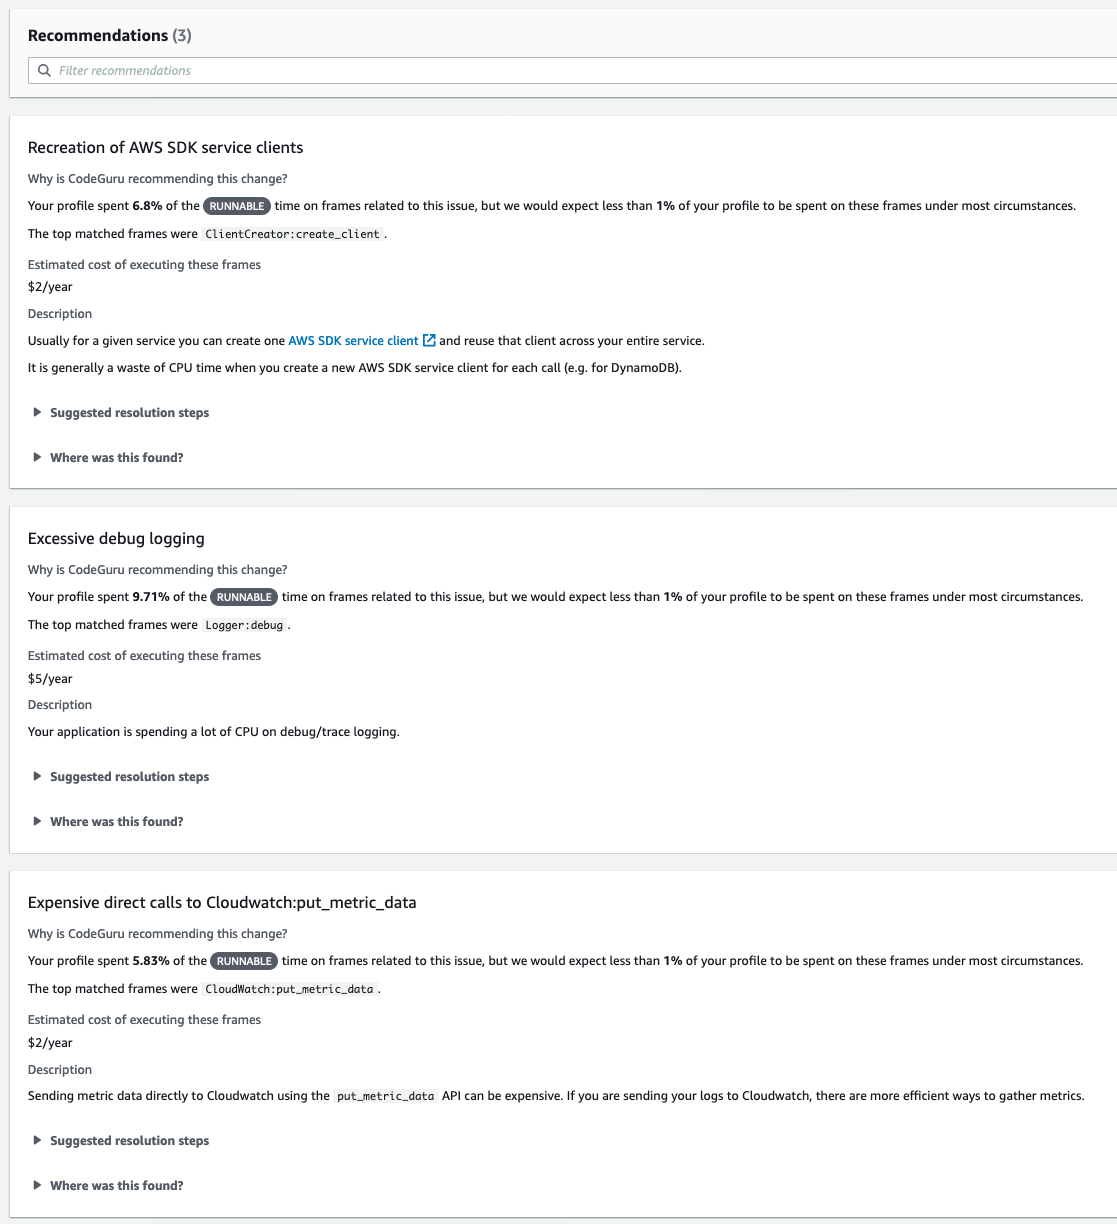
Here are the three recommendations generated from the above Lambda function:
Addressing a recommendation
Let’s dive even further into it an example recommendation. The first recommendation above notices that the Lambda function is spending more than the normal amount of runnable time (6.8% vs <1%) creating AWS SDK service clients. It recommends ensuring that the function doesn’t unnecessarily create AWS SDK service clients, which wastes CPU time.
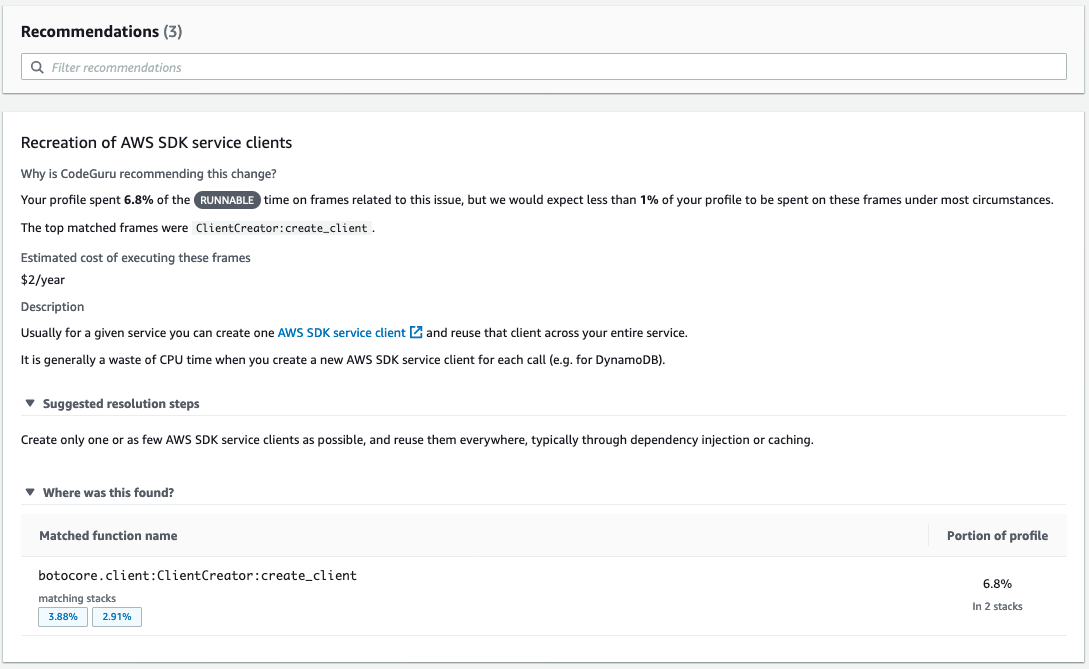
Based on the suggested resolution step, we made a quick and easy code change, moving the client creation outside of the lambda-handler function. This ensures that we don’t create unnecessary AWS SDK clients. The code change below shows how we would resolve the issue.
...
s3_client = boto3.client('s3')
cw_client = boto3.client('cloudwatch')

def lambda_handler(event, context):
...
Reviewing your savings
After making each of the three changes recommended above by CodeGuru Profiler, look at the new flame graphs to see how the changes impacted the applications profile. You’ll notice below that we no longer see the previously wide frames for boto3 clients, put_metric_data, or the logger in the S3 API call.
CPU Utilization Flame Graph:
Latency Flame Graph:

Moreover, we can run the Lambda function for one day (1439 invocations) and see the results in Lambda Insights in order to understand our total savings. After every recommendation was addressed, this Lambda function, with a 128 MB memory and 10 second timeout, decreased in CPU time by 10% and dropped in maximum memory usage and network IO leading to a 30% drop in GB-s. Decreasing GB-s leads to 30% lower cost for the Lambda’s duration bill as explained in the AWS Lambda Pricing.
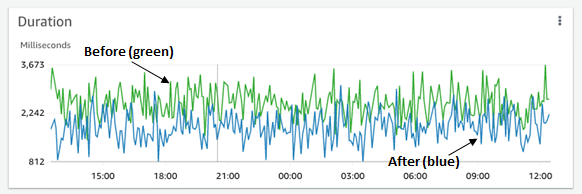
Latency (before and after CodeGuru Profiler):
The graph below displays the duration change while running the Lambda function for 1 day.
Cost (before and after CodeGuru Profiler):
The graph below displays the function cost change while running the lambda function for 1 day.

Conclusion
This post showed how developers can easily onboard onto CodeGuru Profiler in order to improve the performance of their serverless applications built on AWS Lambda. Get started with CodeGuru Profiler by visiting the CodeGuru console.
All across Amazon, numerous teams have utilized CodeGuru Profiler’s technology to generate performance optimizations for customers. It has also reduced infrastructure costs, saving millions of dollars annually.
Onboard your Python applications onto CodeGuru Profiler by following the instructions on the documentation. If you’re interested in the Python agent, note that it is open-sourced on GitHub. Also for more demo applications using the Python agent, check out the GitHub repository for additional samples.