AWS Open Source Blog
Improving the serverless developer experience with sls-dev-tools
This post was contributed by AWS Serverless Hero Ben Ellerby.
One of the most exciting things about serverless is the acceleration it can provide to teams. No longer do you have to invest time in the undifferentiated, heavy lifting of managing the infrastructure of our applications. Instead you can spend time writing code that creates value for your customers.
In this post, I explain how to get started with a new open source serverless tool that delivers serverless metrics directly to your terminal.
For teams adopting serverless for the first time, there can be a learning curve in both establishing efficient development feedback loops and building with best practices. With serverless application architectures, the development team is exposed to more infrastructure. This infrastructure must be managed with Infrastructure as Code (IaC), updated as part of the development of features, and interacted with on a more regular basis.
Development teams must adopt a new way of working with serverless architectures. As application resources now become ephemeral and pay-per-use, you are no longer limited to 3-4 environments (for example, dev, UAT, and production). Instead, every developer can have their own isomorphic infrastructure deployed to AWS, even on a per feature basis. This allows less focus on local environment replication and more focus on testing the real thing.
You can still run code locally during the development of a feature. Projects like “serverless-offline” for the Serverless Framework allow teams to run development code while interacting with deployed resources, such as Amazon DynamoDB, AWS Step Functions, and other AWS Lambda functions. This allows for a fast feedback loop on mostly deployed infrastructure; however, there are times when it is useful to run code on a deployed AWS Lambda function during the development cycle, or debug production or other environments.
Debugging a deployed Lambda function
To debug an issue on a deployed Lambda function, you must:
- Deploy your code.
- Invoke the Lambda function.
- Watch the Amazon CloudWatch Logs.
- Modify the code.
- Repeat.
This requires switching between the developer environment (IDE and terminal) and the web interface to the AWS Management Console. Any switch of context, in this case the debugging environment, has an impact on speed and establishing a state of “flow” during development and debugging.
After helping several teams debug serverless architectures, I found myself wondering why I was spending so much time on Chrome. When writing backend code, I don’t want to use my browser or navigate to CloudWatch Logs. Instead, I want the feedback where I’m working, namely my IDE and terminal. I worked with another Theodo architect, Rob Cronin, to develop a new feedback loop—no browser needed.
About sls-dev-tools
sls-dev-tools is an open source project that aims to be a set of developer tools for the serverless world. Basing the interface in the terminal allows it to run in the development environment.
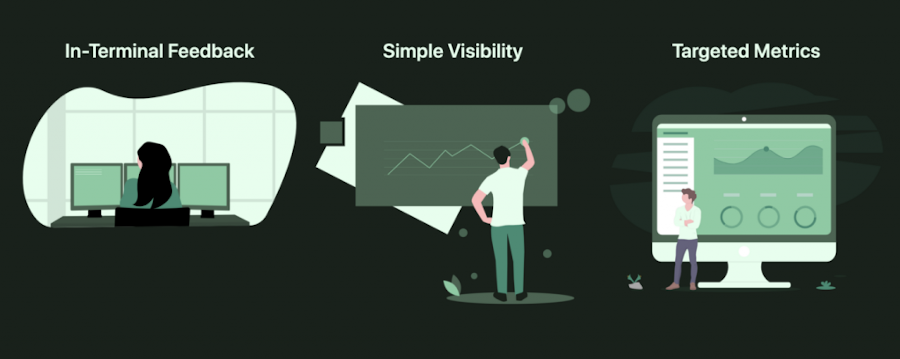
It provides:
- Rapid in-terminal feedback—no need to use the AWS Management Console.
- Targeted metrics that allow you to build fast and efficient applications.
- Powerful key bindings to deploy, open, and manipulate stack resources.
- Works with any CloudFormation-based IaC, such as Serverless Framework or AWS Serverless Application Model (AWS SAM).
- Automated best practice audit via sls-dev-tools Guardian.
Getting started with sls-dev-tools

Installation
sls-dev-tools ships as an npm package, so run the following to add it as a dev dependency to your serverless project:
yarn add -D sls-dev-tools or yarn add -D sls-dev-tools
Alternatively, install it globally with the following:
npm install -g sls-dev-tools
To open the tool, run:
yarn sls-dev-tools or sls-dev-tools if installed globally
sls-dev-tools works with any framework based on AWS CloudFormation. If you use the Serverless Framework in the directory containing the serverless.yml file, it detects the stack configuration automatically. Alternatively, you can pass the stack name as a CLI option, or run sls-dev-tools and select the Region and stack name.
Note: for full AWS SAM support (including deployments), review https://github.com/Theodo-UK/sls-dev-tools#sam-framework
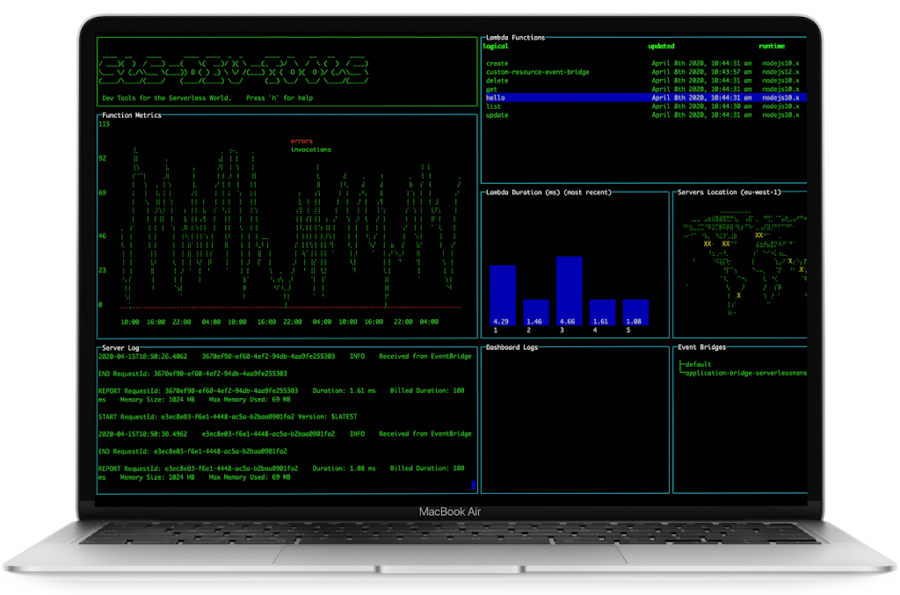
Once the tool is running, you can select a single Lambda function by using the arrow keys and selecting Enter. This gives you an overview of the invocation history, along with hot reloading logs from CloudWatch.
To invoke functions, select the i shortcut on the selected function. An event injection modal is presented, allowing you to pass a body to the request. This body data is defaulted on the next invocation for rapid feedback.
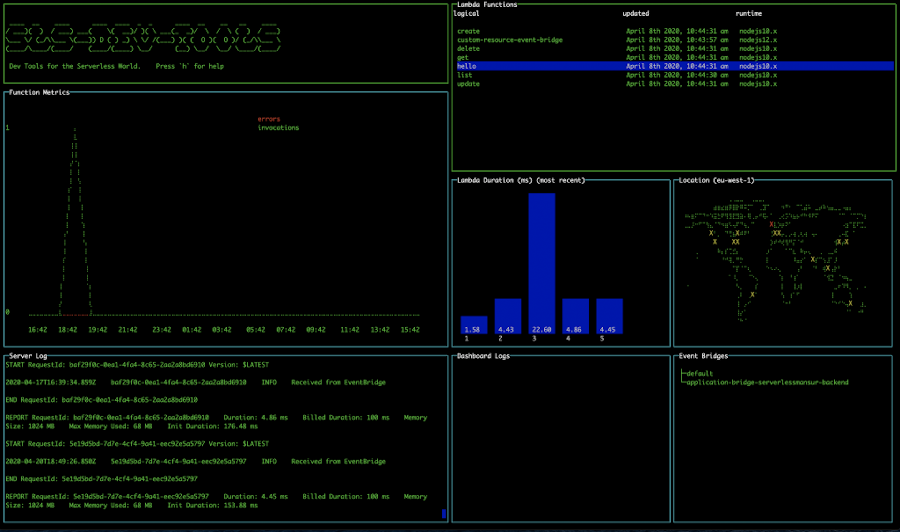
Amazon EventBridge
At Theodo, we make heavy use of Amazon EventBridge for our microservice-based architectures. It makes team collaboration easier and service interfaces simpler. EventBridge provides an event bus, which can have routing rules to trigger resources, such as Lambda.
The feedback loop for EventBridge is not as simple as triggering an API Gateway endpoint to trigger an event. Instead, you use the AWS SDK to inject an event.
By selecting TAB in sls-dev-tools, you jump down to the EventBridge section. Select an event bus and select i to do an injection, using the injection modal to build the request. If you’re using the EventBridge Schema Registry, select r (for registry) and select a pre-formatted modal based on a specified event typing. This allows rapid debugging, exploration, and development with EventBridge.
Using the console for additional functionality
Sls-dev-tools will not have complete feature parity with the AWS Management Console. Instead, it’s a targeted tool to guide the serverless development experience. Therefore, there are times where you need the console.
In sls-dev-tools, when you select any AWS resource (for example, a Lambda function, EventBridge bus, or DynamoDB Table), use the o hotkey shortcut. This opens the relevant resource page of the console in the correct Region for that specific resource.
Automating best practices—sls-dev-tools Guardian
There is a learning curve in discovering new and evolving best practices for building serverless applications. Teams need to invest in self-education and training to stay up to date. This is why we created the Serverless Transformation blog.
Sls-dev-tools Guardian is a highly opinionated, highly configurable, and automated best practice audit tool for serverless architectures. It’s open source and built by the community, for the community. It has a number of best practice rules that run across architecture resources and configurations. Documented in ESLint style, each rule has consistent naming conventions, clear steps to resolve issues, and links to useful tools and documentation.
Sls-dev-tools Guardian is built into the default sls-dev-tools CLI and is run by passing the --ci option.
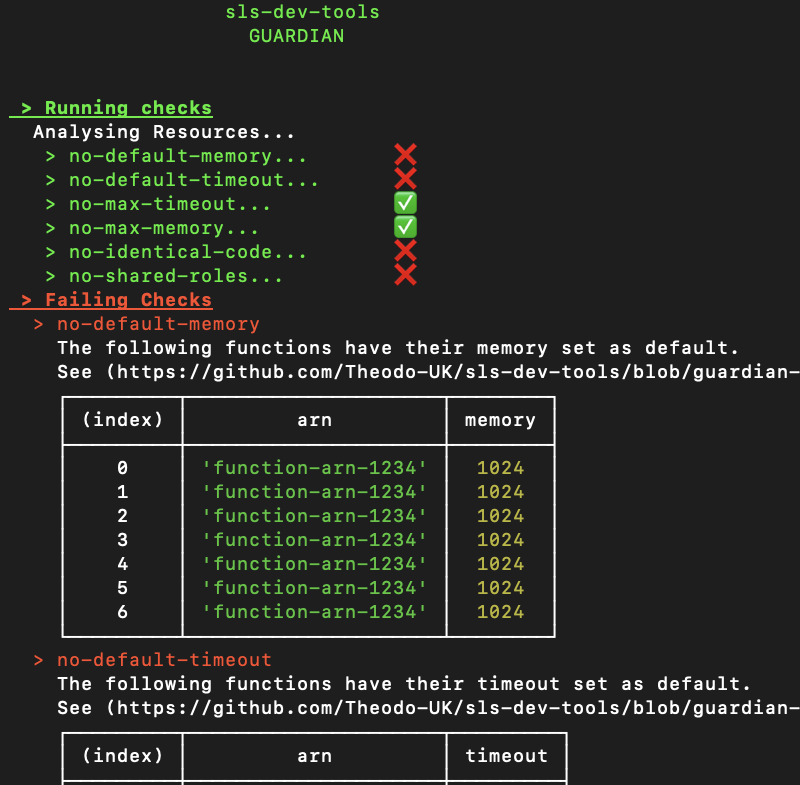
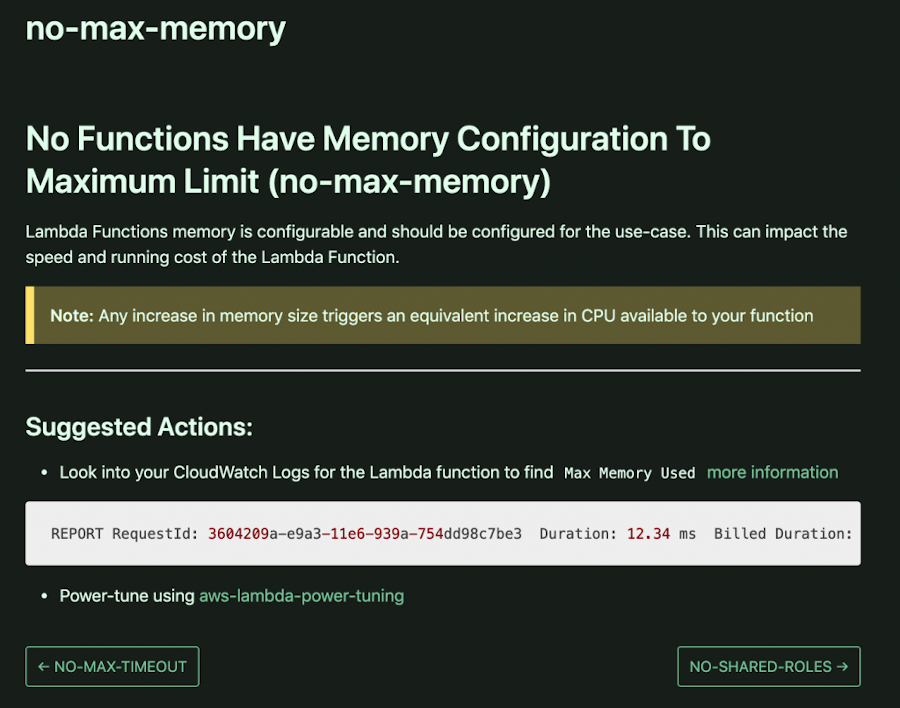
The result is a set of passing or failing checks. For failing checks, there are links to the dedicated rule pages, which explain the reason for the rule and actions to resolve the issue. It’s a tool to educate, not report. Every project is different and there are rules that work for some and not for others. You can suggest new rules by opening a PR, and configure rules on a per-resource and global basis.
Conclusion
I’ve outlined a few of the most useful features of sls-dev-tools for optimizing the serverless developer experience. There is a wide range of additional shortcuts (for example, testing and deployment) covered in the sls-dev-tools docs.
The best serverless teams invest in education and tooling. Sls-dev-tools can help teams that are adopting serverless for the first time, and those with complex distributed architectures. As more teams gain the benefits of serverless, we will continue to improve our tooling.
The sls-dev-tools project team loves feedback via GitHub issues or Twitter, and is interested in your contributions.
I would like to thank Rob Cronin, Abbie Howell, Gavin Williams, Mansur Pasha, Antoine Eudes from Theodo, as well as Serkan Özal, Arto Liukkonen, and James Mullen from the sls-dev-tools community.

Ben Ellerby
Ben is VP of Engineering for Theodo and a dedicated member of the Serverless community. He is the editor of Serverless Transformation: a blog, newsletter, and podcast which share tools, techniques, and use cases for all things Serverless. He co-organizes the Serverless User Group in London, is part of the ServerlessDays London organizing team, and regularly speaks about Serverless around the world. At Theodo, Ben works with both new startups and global organisations to deliver digital products, training, and digital transformation with Serverless across London, Paris, and New York.
The content and opinions in this post are those of the third-party author and AWS is not responsible for the content or accuracy of this post.