AWS Open Source Blog
Right-size your Kubernetes Applications Using Open Source Goldilocks for Cost Optimization
In the last few years as companies have modernized their business applications, many have moved to microservices based architectures using containers on Kubernetes. A lot of the initial focus was on designing and building new cloud native architectures to support the applications. As environments have grown, we’ve seen a shift in focus to optimize resource allocation and right-size workloads to reduce costs.
In this blog post we will share guidance on how to optimize resource allocation and right-size applications in Kubernetes environments using Goldilocks. We’ll walk through how to install Goldilocks as well as a sample application to view the suggested resource recommendations. This applies to all Kubernetes applications, including those running on Amazon Elastic Kubernetes Service (Amazon EKS), that are deployed with managed node groups, self-managed node groups, and AWS Fargate.
Right-sizing applications on Kubernetes
In Kubernetes, resource right-sizing is done through setting resource specifications in the application manifest. These settings directly impact:
- Performance — Kubernetes applications running on the same node will arbitrarily compete for resources without proper resource specifications. This can adversely impact application performance.
- Cost Optimization — Applications deployed with oversized resource specifications will result in increased costs and underutilized infrastructure.
- Autoscaling — The Kubernetes Cluster Autoscaler and Horizontal Pod Autoscaling require resource specifications to function.
The most common resource specifications in Kubernetes are for CPU and memory requests and limits.
Requests and Limits
Containerized applications are deployed on Kubernetes as Pods. CPU and memory requests and limits are an optional part of the Pod definition. CPU is specified in units of Kubernetes CPUs while memory is specified in bytes, usually as mebibytes (Mi).
Requests and limits each serve different functions in Kubernetes and affect scheduling and resource enforcement differently.
Scheduling
The Kubernetes scheduler only considers requests when determining where to place Pods in your cluster. Acceptable nodes are those that have enough available resources to satisfy the Pod’s resource requests. Limits are not considered by the scheduler.
Resource Enforcement
The container runtime on the node where your Pods are running is responsible for resource enforcement. Both requests and limits are factors in ensuring applications have access to their required compute resources. Their effect on CPU and memory is different:
- CPU — If no limits are specified, then each Pod on a node can use all the available CPU on the host. As soon as available CPU is exhausted, Pods are throttled using a Linux primitive called cgroups. This is a resource sharing primitive that ensures each Pod gets its fair share of CPU time. CPU requests determine that fair share and are weighted to give more CPU time to Pods with larger CPU requests. If a limit is specified then CPU time will not exceed the specific limit.
- Memory — Just like CPU, if no memory limits are specified, then each Pod can use all the available memory on the host. Unlike CPU, when memory is exhausted, there is no sharing mechanism. The Pod will either be terminated by the Linux Out-of-memory (OOM) killer or the kubelet will evict the Pod. The same process will happen if a Pod’s memory usage exceeds its limit.
Vertical Pod Autoscaler
So how do application owners choose the “right” values for their CPU and memory resource requests? An ideal solution is to load test the application in a development environment and measure resource usage using observability tooling. While that might make sense for your organization’s most critical applications, it’s likely not feasible for every containerized application deployed in your cluster.
Fortunately, there is a Kubernetes project that has a feature specifically designed to help provide resource recommendations — the Vertical Pod Autoscaler (VPA). VPA is a Kubernetes sub-project owned by the Autoscaling special interest group (SIG). It’s designed to automatically set Pod requests based on observed application performance. VPA collects resource usage using the Kubernetes Metric Server by default but can be optionally configured to use Prometheus as a data source.
VPA has a recommendation engine that measures application performance and makes sizing recommendations. The VPA recommendation engine can be deployed stand-alone so VPA will not perform any autoscaling actions. It’s configured by creating a VerticalPodAutoscaler custom resource for each application and VPA updates the object’s status field with resource sizing recommendations.
Creating VerticalPodAutoscaler objects for every application in your cluster and trying to read and interpret the JSON results is challenging at scale. Goldilocks is an open source project that makes this easy.
Goldilocks
Goldilocks is an open source project from Fairwinds that is designed to help organizations get their Kubernetes application resource requests “just right”. It takes its name, very appropriately, from the well known fairly tale Goldilocks and the Three Bears. Goldilocks builds on top of the Kubernetes Vertical Pod Autoscaler and provides:
- A controller that automates the creation of
VerticalPodAutoscalerobjects for workloads in your cluster. - A dashboard that displays resource recommendations for all the monitored workloads.
The default configuration of Goldilocks is an opt-in model. You choose which workloads are monitored by adding the goldilocks.fairwinds.com/enabled: true label to a namespace.
Solution Overview
Let’s walk through how to install Goldilocks, including its dependencies Metrics Server and Vertical Pod Autoscaler. Then we’ll install a sample application to view the suggested resource recommendations. The diagram shown here illustrates all of the components on an Amazon EKS cluster and their interactions.
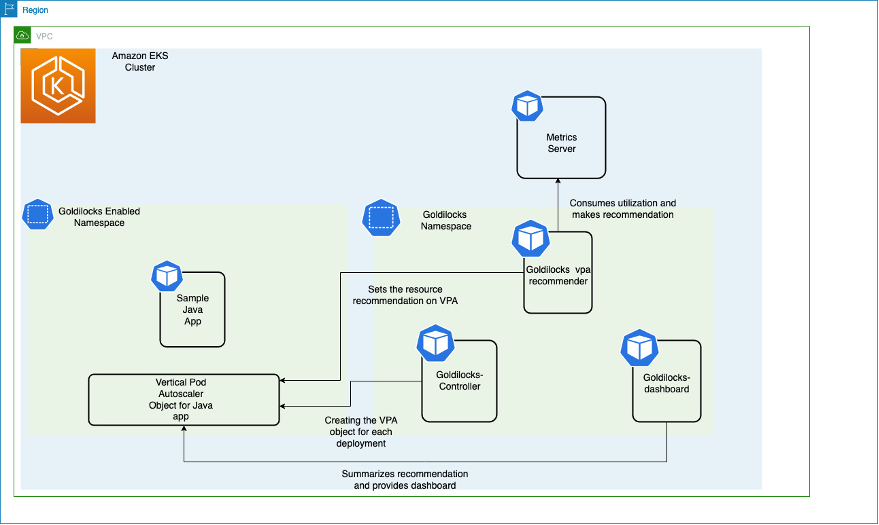
The Metrics Server collects resource metrics from the Kubelet running on worker nodes and exposes them through Metrics API for use by the Vertical Pod Autoscaler. The Goldilocks controller watches for namespaces with the goldilocks.fairwinds.com/enabled: true label and creates VerticalPodAutoscaler objects for each workload in those namespaces.
In this blog post, we will be creating a namespace called javajmx-sample and will be creating a tomcat deployment. We will label this namespace in order to get a recommendation from Goldilocks. As soon as we label the namespace, we will be able to see a VPA object called goldilocks-tomcat-example created.
Prerequisites
You will need the following to complete the steps in this post:
- AWS Command Line Interface (AWS CLI) version 2
- kubectl
- helm
- If you don’t have an Amazon EKS cluster, you can create one using the eksctl
Step 1: Deploying the Metrics Server
In this step, we will be deploying the Metrics server which provides the resource metrics to be used by Vertical Pod Autoscaler.
Let’s verify the status of the metrics-server. Once successfully deployed, you should be able to see the resource utilization of the deployments within seconds:
Step 2 : Enable namespaces which needs resource recommendation from Goldilocks
We will be deploying sample workloads in the javajmx-sample namespace and we will get the resource recommendation for the applications running on it. Let’s go ahead and create the namespace and label it.
To ensure the label was applied successfully, run describe on the javajmx-sample namespace
Step 3 : Deploy Goldilocks
We will be using a helm chart to deploy Goldilocks. The deployment creates three objects :
- Goldilocks-controller: responsible for creating the VPA objects for the workloads whose namespace is enabled for a Goldilocks recommendation
- Goldilocks-vpa-recommender: responsible for providing the resource recommendations for the workloads
- Goldilocks-dashboard: summarizes the resource recommendation of the workloads and will also provide the yaml manifest for implementing the recommendation.
To deploy Goldilocks, run the following helm commands:
Now, we will use kubectl to verify if the deployment was successful:
Step 4 : Deploy the sample application
In this step, we will be deploying a sample application in the javajmx-sample namespace to get recommendations from Goldilocks. The application tomcat-example is initially provisioned with a CPU and Memory request of 100m and 180Mi respectively and limits of 300m CPU and 300 Mi Memory.
As mentioned earlier, Goldilocks will be creating VPAs for each deployment in a Goldilocks enabled namespace. Using the kubectl command, we can verify that a VPA was created in thejavajmx-sample namespace for the goldilocks-tomcat-example:
Step 5 : Review the Goldilocks recommendation dashboard
Goldilocks-dashboard will expose the dashboard in the port 8080 and we can access it to get the resource recommendation. We now run this kubectl command to access the dashboard:
We can now open a browser to http://localhost:8080 to display the Goldilocks dashboard.
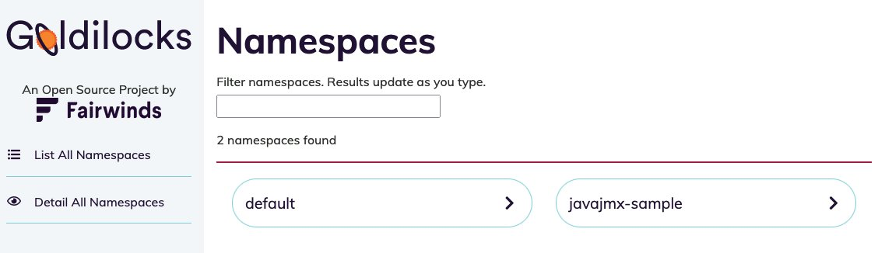
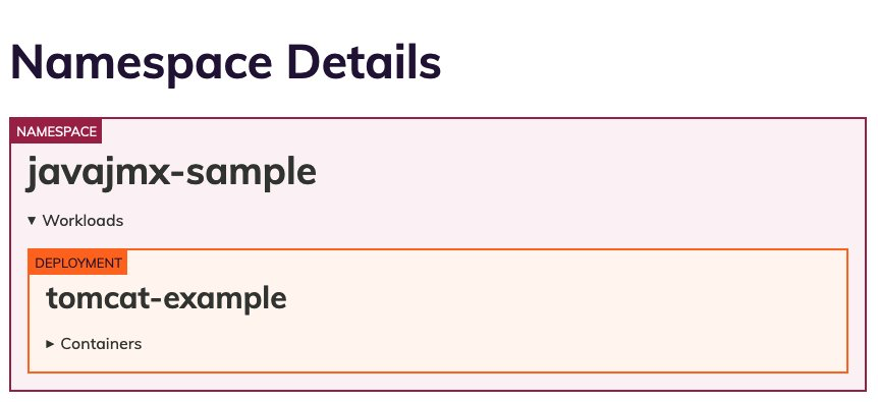
Let’s analyze the javajmx-sample namespace to see the recommendations provided by Goldilocks. We should be able to see the recommendations for the goldilocks-tomcat-example deployment.
Here the screen shows the request and limit recommendations for the javajmx-sample workload. The Current column under each Quality of Service (QoS) indicates the currently configured CPU and Memory request and limits. The Guaranteed and Burstable column under each QoS indicates the recommended CPU and Memory request limits for the respective QoS.

We can clearly notice that we have over provisioned the resources and Goldilocks has made the recommendations to optimize the CPU and Memory request. The recommended level for CPU request and CPU limit is 15m and 15m compared to the current setting of 100m and 300m for Guaranteed QoS. Memory request and limits are recommended to be 105M and 105M, compared to the current setting of 180Mi and 300 Mi.
Notice that the recommendations are available for two different Quality of Service (QoS) types: Guaranteed and Burstable. Kubernetes provides different levels of Quality of Service to pods depending on what they request and what limits are set for them. Pods that need to stay up and consistently good can request guaranteed resources, while pods with less exacting requirements can use resources with less or no guarantee.
Guaranteed (QoS) pods are considered top priority and are guaranteed to not be killed until they exceed their limits. If limits, and optionally requests, (not equal to 0) are set for all resources across all containers and limits and requests are equal, then the pod is classified as Guaranteed.
Burstable (QoS) pods have some form of minimal resource guarantee, but can use more resources when available. Under system memory pressure, these containers are more likely to be killed once they exceed their requests and no Best-Effort pods exist. If requests, and optionally limits, are set (not equal to 0) for one or more resources across one or more containers, and they are not equal, then the pod is classified as Burstable.
To follow the recommended resource specification, customers can simply copy the respective manifest file for the QoS class they are interested in and deploy the workloads which will then be right-sized and optimized.
For example, if we decide to apply the recommendations for the Guaranteed QoS, we could copy the YAML from the dashboard as shown here and apply them to the deployment object:
Let’s run the kubectl edit command to the deployment to apply the recommendations:
The resources section in the containers spec shows that we have successfully applied the recommendation of request and limits for CPU, and memory:
Once we apply the recommendations, we should be able to verify that the pod is trying to restart and come online with the updated resource configuration. Let’s verify the same by running the kubectl describe command on the tomcat-example deployment:
The output should look like the following:
Cleanup
To delete the deployments and sample workloads we created in the blog, execute the following commands:
Conclusion
This post demonstrated how Goldilocks can be used to efficiently rightsize the resource requests for Kubernetes applications. Customers in modernization efforts often have minimal time to decide the resource requirements for their applications, which usually involves a complex process of reviewing monitoring dashboards. By adopting the recommendations from Goldilocks, customers can shorten the time to market for their applications and optimize their Amazon EKS costs.