AWS Security Blog
How to visualize Amazon GuardDuty findings: serverless edition
September 9, 2021: Amazon Elasticsearch Service has been renamed to Amazon OpenSearch Service. See details.
July 20, 2020:This post has been updated to reflect the new Amazon GuardDuty support for exporting findings to an S3 bucket.
July 12, 2019: Due to a feature name change, we’ve updated some examples throughout the post.
Note: This blog post provides an alternate solution to Visualizing Amazon GuardDuty Findings, in which the authors describe how to build an Amazon Elasticsearch Service-powered Kibana dashboard to ingest and visualize Amazon GuardDuty findings.
Amazon GuardDuty is a managed threat detection service powered by machine learning that can monitor your AWS environment with just a few clicks. GuardDuty can identify threats such as unusual API calls or potentially unauthorized users attempting to access your servers. Many customers also like to visualize their findings in order to generate additional meaningful insights. For example, you might track resources affected by security threats to see how they evolve over time.
In this post, we provide a solution to ingest, process, and visualize your GuardDuty finding logs in a completely serverless fashion. Serverless applications automatically run and scale in response to events you define, rather than requiring you to provision, scale, and manage servers. Our solution covers how to build a pipeline that ingests findings into Amazon Simple Storage Service (Amazon S3), transforms their nested JSON structure into tabular form using Amazon Athena and AWS Glue, and creates visualizations using Amazon QuickSight. We aim to provide both an easy-to-implement and cost-effective solution for consuming and analyzing your GuardDuty findings, and to more generally showcase a repeatable example for processing and visualizing many types of complex JSON logs.
Many customers already maintain centralized logging solutions using Amazon Elasticsearch Service (Amazon ES). If you want to incorporate GuardDuty findings with an existing solution, we recommend referencing this blog post to get started. If you don’t have an existing solution or previous experience with Amazon ES, if you prefer to use serverless technologies, or if you’re familiar with more traditional business intelligence tools, read on!
Before you get started
To follow along with this post, you’ll need to enable GuardDuty in order to start generating findings. See Setting Up Amazon GuardDuty for details if you haven’t already done so. Once enabled, GuardDuty will automatically generate findings as events occur. If you have public-facing compute resources in the same region in which you’ve enabled GuardDuty, you may soon find that they are being scanned quite often. All the more reason to continue reading!
You’ll also need Amazon QuickSight enabled in your account for the visualization sections of this post. You can find instructions in Setting Up Amazon QuickSight.
Architecture from end to end
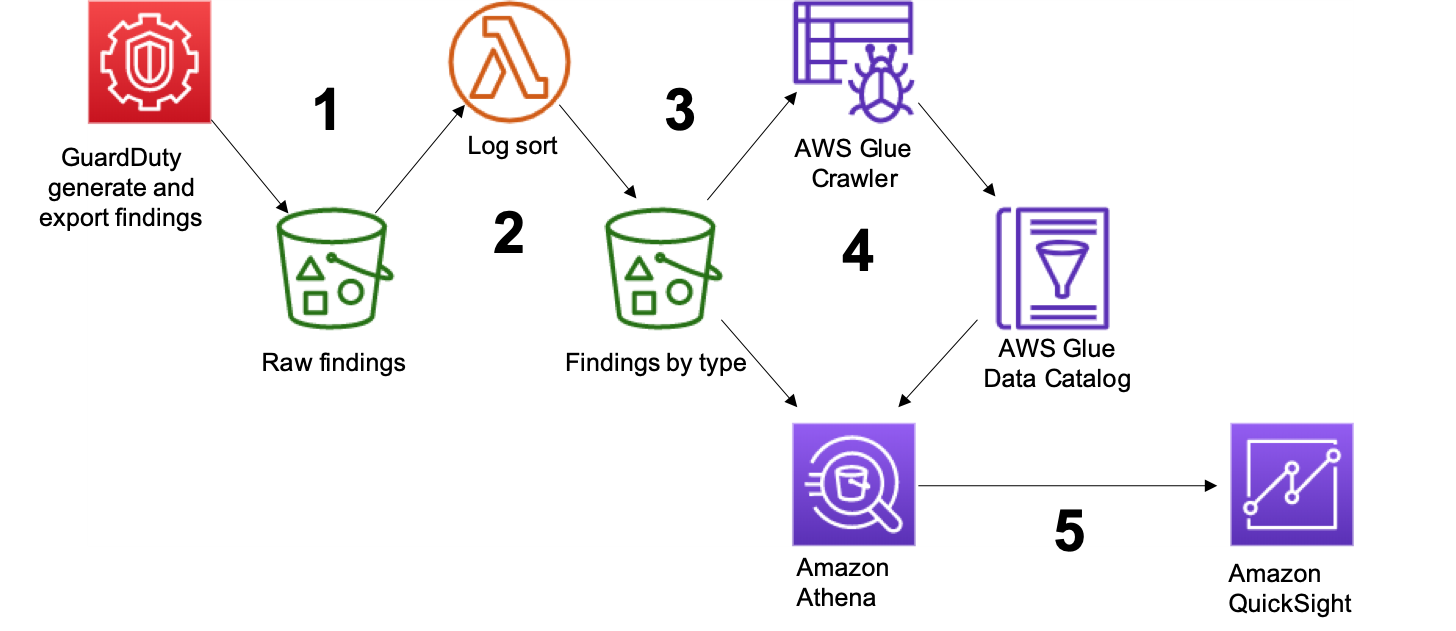
Figure 1: Complete architecture from findings to visualization
Figure 1 highlights the solution architecture, from finding generation all the way through final visualization. The steps are as follows:
- Export GuardDuty findings to S3
- Use AWS Lambda to reorganize S3 folder structure
- Catalog your GuardDuty findings using AWS Glue
- Configure Views with Amazon Athena
- Build a GuardDuty findings dashboard in Amazon QuickSight
Below, we’ve included an AWS CloudFormation template that launches resources to quickly configure export from GuardDuty to S3 (Steps 1-3) along with a complete ingest pipeline so that we can focus this post on the steps dedicated to building the actual visualizations (Steps 4-5). We briefly cover how to figure GuardDuty export and build the rest of the ingest pipeline in the next section to provide context, and we provide links to the pertinent pages in the documentation for those of you interested in building your own custom ingest pipeline.
![]()
Ingest (Steps 1-3): Get Amazon GuardDuty findings into Amazon S3 and AWS Glue Data Catalog
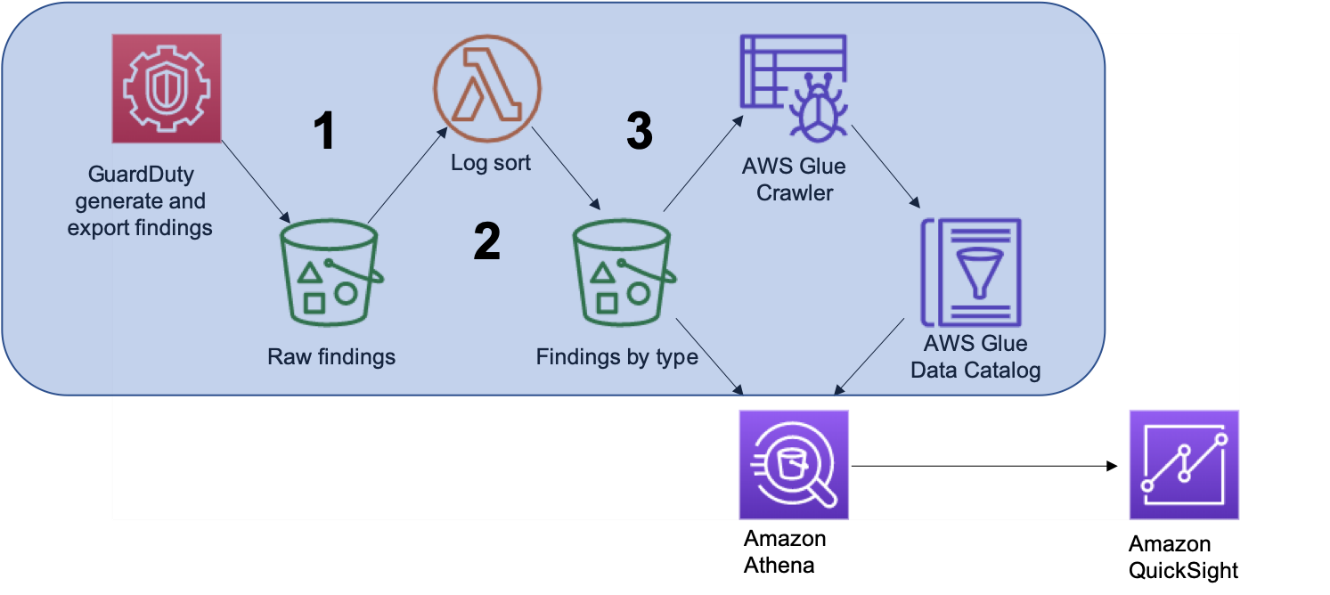
Figure 2: In this section, we’ll cover the services highlighted in blue
Step 1: Deliver GuardDuty findings to Amazon S3
GuardDuty has integration with and can deliver findings directly to S3, which you can configure by following these instructions. For the purposes of this blog, configure your findings to output to the default path (i.e. leave Log file prefix blank) of the S3 bucket created by CloudFormation (See the ‘Outputs’ tab of your CloudFormation stack) and encrypted by the KMS key named ‘GuardDuty-Blog-Key’ as shown below in figure 3. If you are using GuardDuty in a multi-account environment, and are operating from a GuardDuty master account then findings from all member accounts will be automatically aggregated to the S3 bucket defined by the master account.
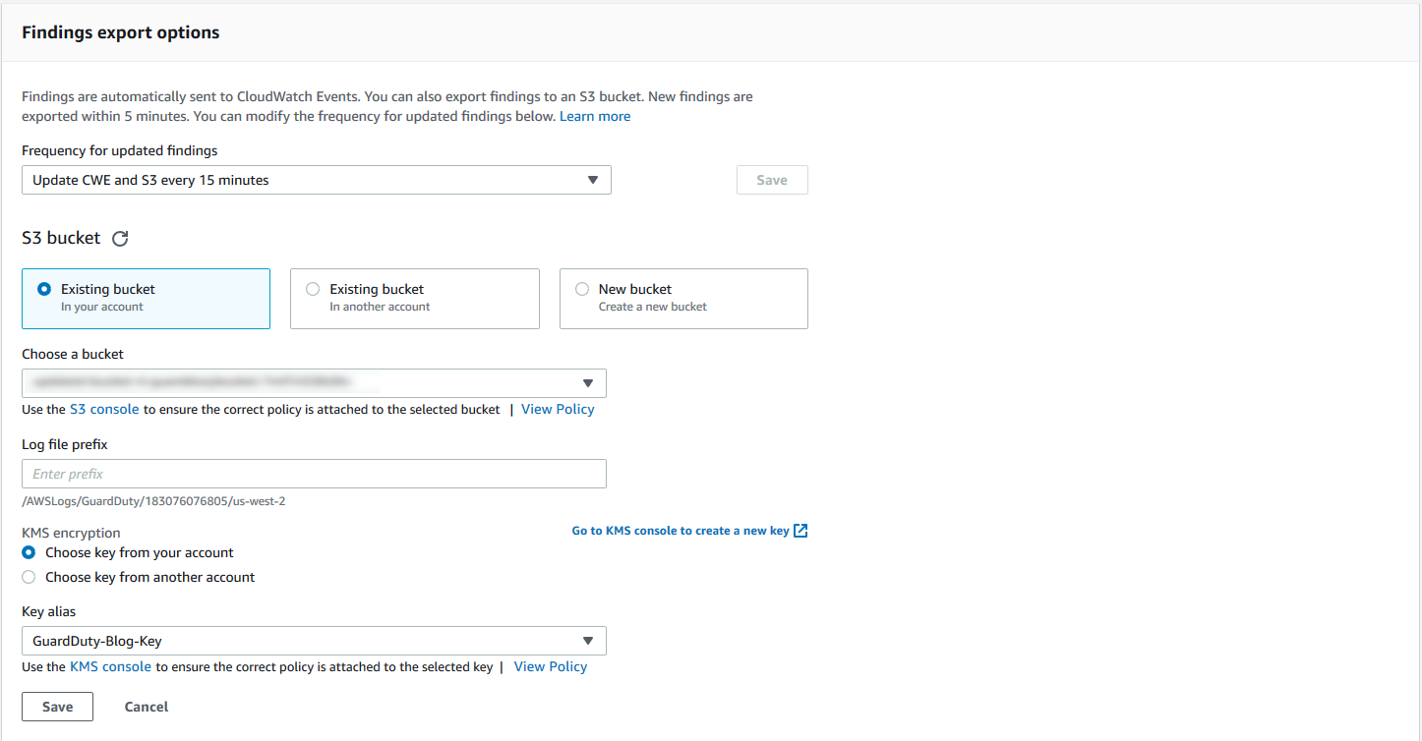
Figure 3: Configure GuardDuty export by selecting the S3 bucket created by the CloudFormation template and the ‘GuardDuty-Blog-Key’ KMS key
Step 2: Use AWS Lambda to reorganize Amazon S3 folder structure
GuardDuty will automatically create a datetime-based file hierarchy to organize the findings as they come in. Due to the variability of the GuardDuty finding types, we recommend reorganizing the file hierarchy with a folder for each finding type, with separate datetime subfolders for each. This will make it easier to target findings that you want to focus on in your visualization. The provided AWS CloudFormation template utilizes an AWS Lambda function to rewrite the files in a new hierarchy as new files are written to S3. You can use the code provided in it along with Using AWS Lambda with S3 to trigger your own function that reorganizes the data. Once the Lambda function has run, the S3 bucket structure should look similar to the structure we show in figure 4.
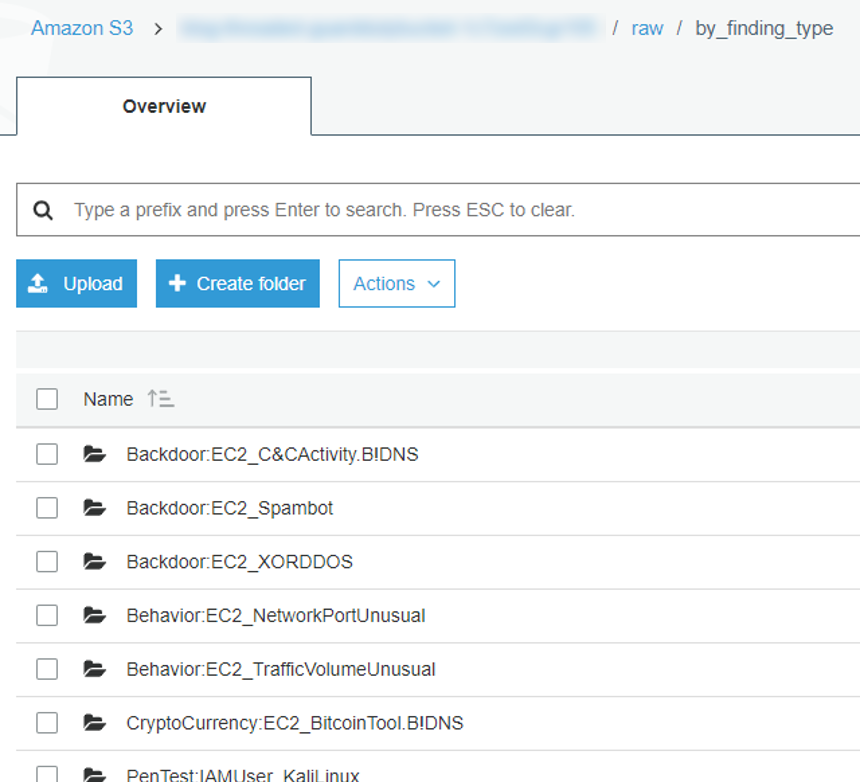
Figure 4: Sample S3 bucket structure
Step 3: Catalog the GuardDuty findings using AWS Glue
With the reorganized findings stored in S3, use an AWS Glue crawler to scan and catalog each finding type. The CloudFormation template we provided schedules the crawler to run once a day. You can also run it on demand as needed. To build your own crawler, refer to Cataloging Tables with a Crawler. Assuming GuardDuty has generated findings in your account, you can navigate to the GuardDuty findings database in the AWS Glue Data Catalog. It should look something like figure 5:
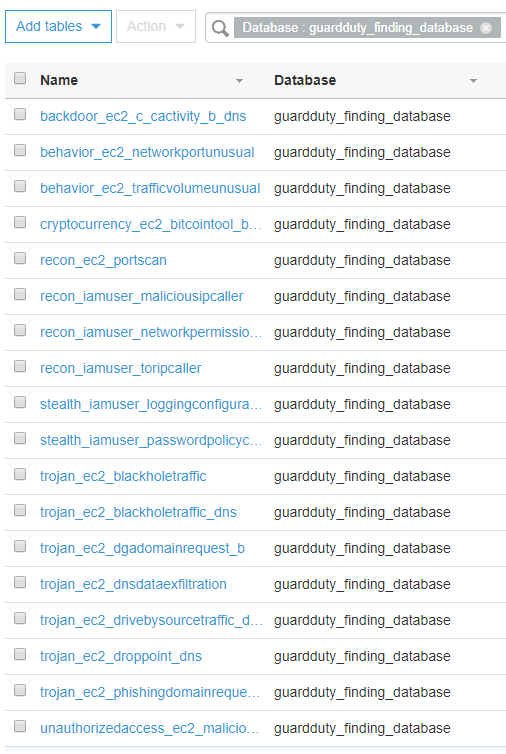
Figure 5: List of finding type tables in the AWS Glue Catalog
Note: Because AWS Glue crawlers will attempt to combine similar data into one table, you might need to generate sample findings to ensure enough variability for each finding type to have its own table. If you only intend to build your dashboard from a small subset of finding types, you can opt to just edit the crawler to have multiple data sources and specify the folder path for each desired finding type.
Explore the table structure
Before moving on to the next step, take some time to explore the schema structure of the tables. Selecting one of the tables will bring you to a page that looks like what’s shown in figure 5.
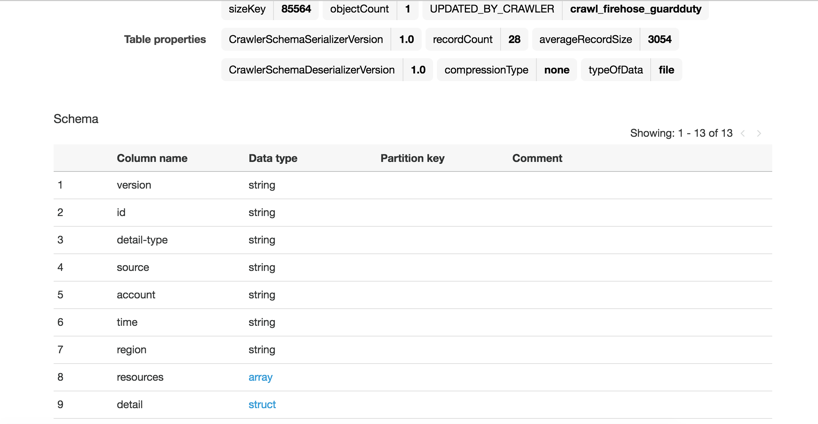
Figure 6: Schema information for a single finding table
You should see that most of the columns contain basic information about each finding, but there’s columns named service and resource that are of type struct. Select service to expand, as shown in figure 7.
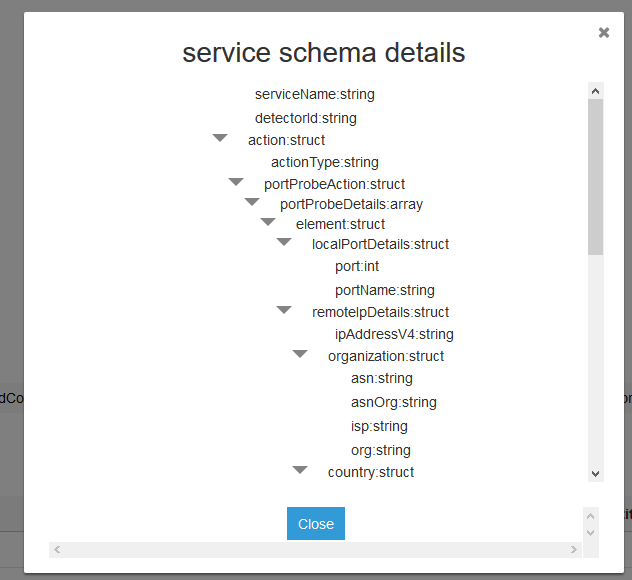
Figure 7: The “service” column expanded
Ah, this is where the most of the interesting information is tucked away! The tables for each finding may differ slightly, but in all cases the service and resource columns will hold the bulk of the information you’ll want to visualize. See GuardDuty Active Finding Types for information on what you should expect to find in the logs for each finding type. In the next step, we’ll focus on unpacking service and resource to prepare for visualization!
Process (Step 4): Unpack nested JSON and configure views with Amazon Athena
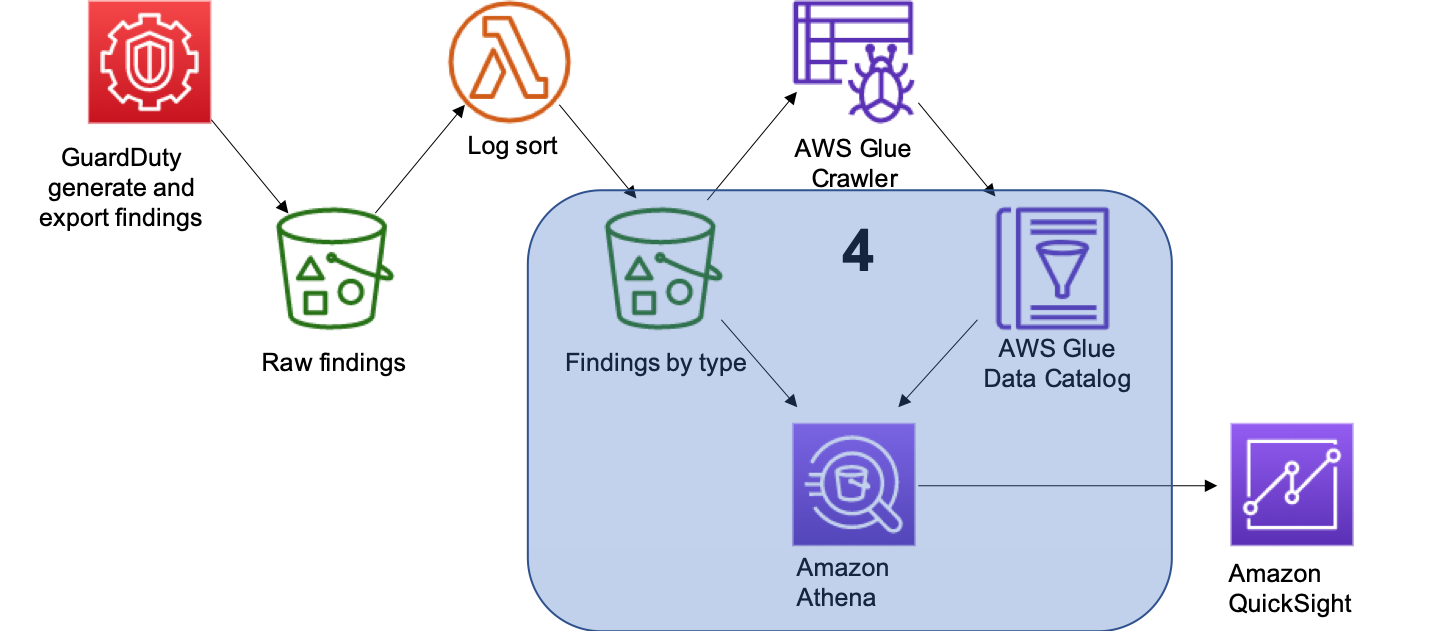
Figure 8: In this section, we’ll cover the services highlighted in blue
Note: This step picks up where the CloudFormation template finishes
Explore the table structure (again) in the Amazon Athena console
Begin by navigating to Athena from the AWS Management Console. Once there, you should see a drop-down menu with a list of databases. These are the same databases that are available in the AWS Glue Data Catalog. Choose the database with your GuardDuty findings and expand a table.
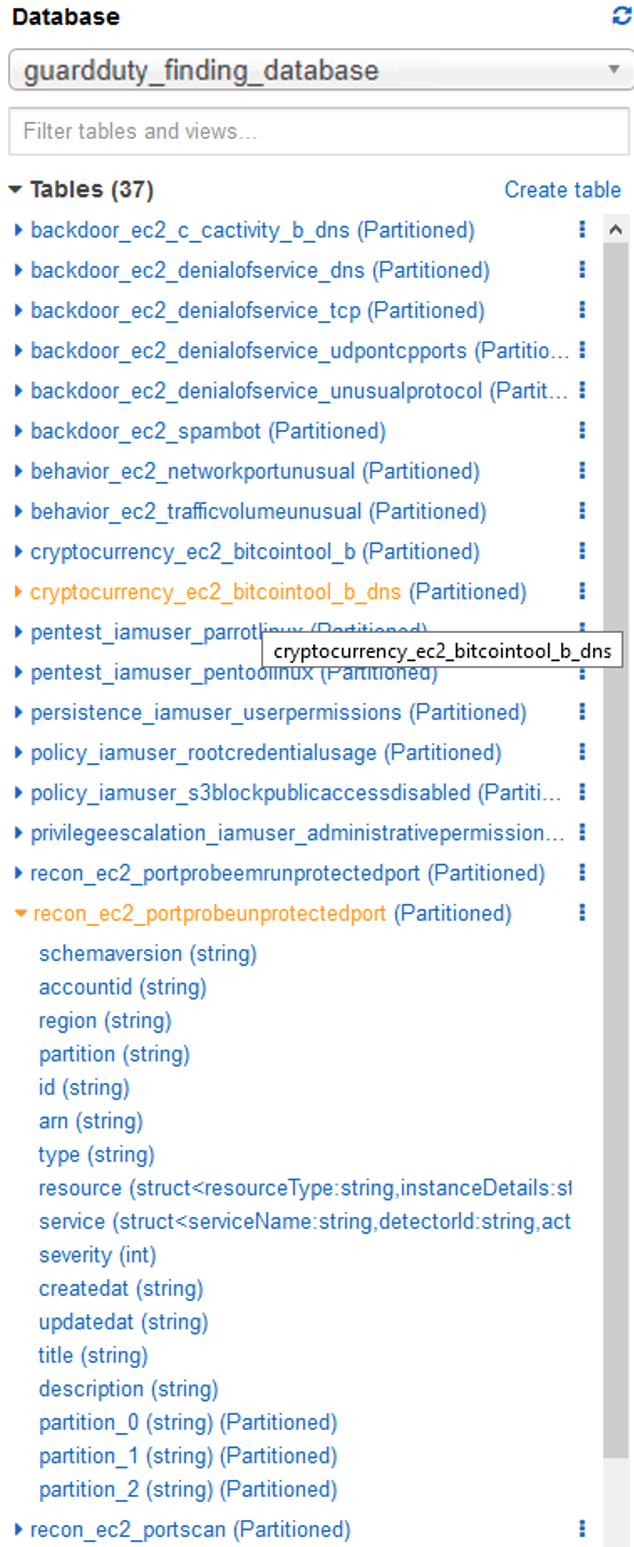
Figure 9: Expanded table in the Athena console
This should look very familiar to the table information you explored in step 4, including the service and resource structs!
You’ll need a method to unpack the structs in order to effectively visualize the data. There are many methods and tools to approach this problem. One that we recommend (and will show) is to use SQL queries within Athena to construct tabular views. This approach will allow you to push the bulk of the processing work to Athena. It will also allow you to simplify building visualizations when using Amazon QuickSight by providing a more conventional tabular format.
Extract details for use in visualization using SQL
The following examples contain SQL statements that will provide everything necessary to extract the necessary fields from the service and resourc structs of the Recon:EC2/PortProbeUnprotectedPort finding to build the Amazon QuickSight dashboard we showcase in the next section. The examples also cover most of the operations you’ll need to work with the elements found in GuardDuty findings (such as deeply nested data with lists), and they serve as a good starting point for constructing your own custom queries. In general, you’ll want to traverse the nested layers (i.e. root.service.count) and create new records for each item in an embedded list that you want to target using the UNNEST function. See this blog for even more examples of constructing queries on complex JSON data using Amazon Athena.
Simply copy the SQL statements that you want into the Athena query field to build the port_probe_geo and affected_instances views.
Note: If your account has yet to generate Recon:EC2/PortProbeUnprotectedPort findings, you can generate sample findings to follow along.
Visualize (Step 5): Build a GuardDuty findings dashboard in Amazon QuickSight
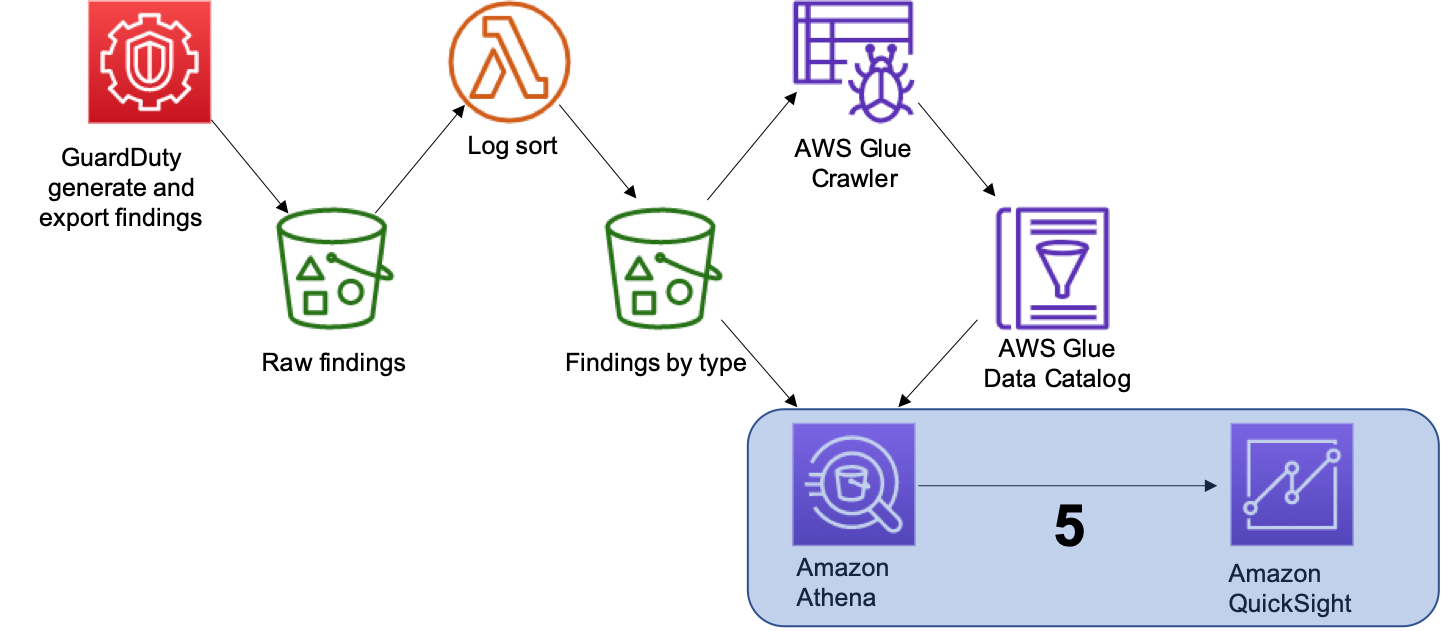
Figure 10: In this section we will cover the services highlighted in blue
Now that you’ve created tabular views using Athena, you can jump into Amazon QuickSight from the AWS Management Console and begin visualizing! If you haven’t already done so, enable Amazon QuickSight in your account by following the instructions for Setting Up Amazon QuickSight.
For this example, we’ll leverage the geo_port_probe view to build a geographic visualization and see the locations from which nefarious actors are launching port probes.
Creating an analysis
In the upper left-hand corner of the Amazon QuickSight console select New analysis and then New data set.
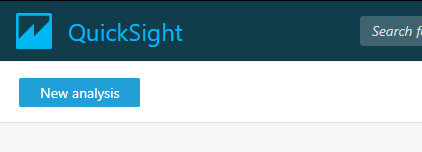
Figure 11: Create a new analysis
To utilize the views you built in the previous step, select Athena as the data source. Give your data source a name (in our example, we use “port probe geo”), and select the database that contains the views you created in the previous section. Then select Visualize.
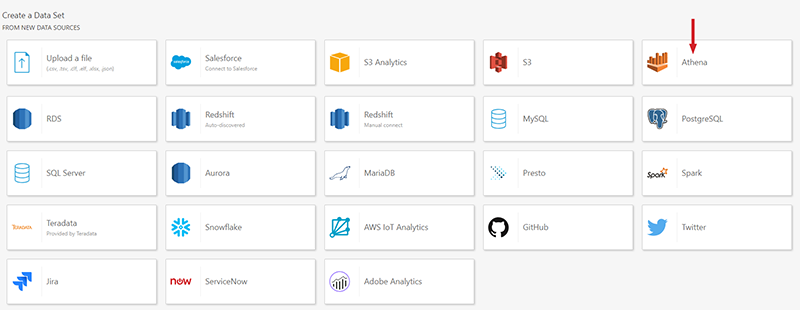
Figure 12: Available data sources in Amazon QuickSight. Be sure to choose Athena!
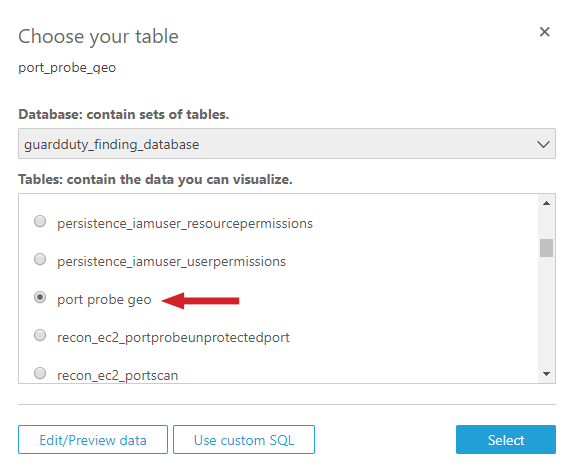
Figure 13: Select the “port probe geo view” you created in step 5
Viz time!
From the Visual types menu in the bottom left corner, select the globe icon to create a map. Then select the latitude and longitude geospatial coordinates. Choose occurrences (with a max aggregation) for size. Finally, select localportname to break the data down by color.
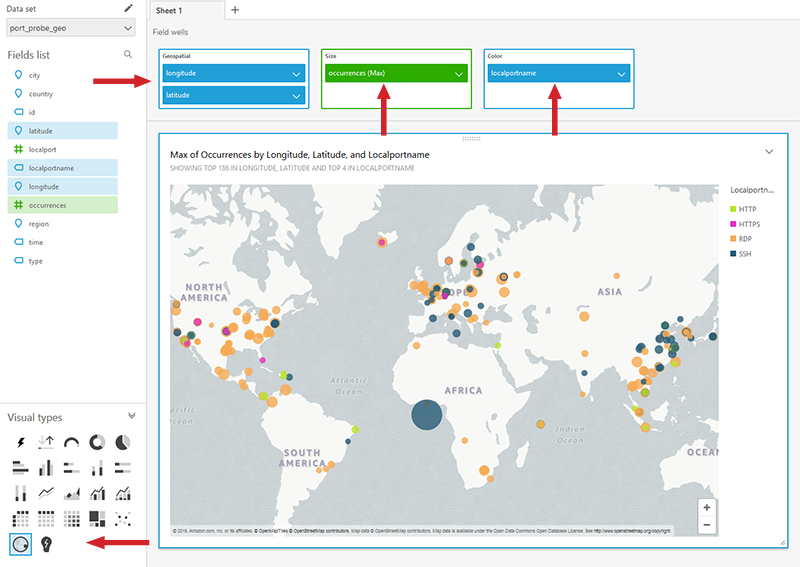
Figure 14: A visual containing a map of port probe scans in Amazon QuickSight
Voila! A detailed map of your environment’s attackers!
Build out a dashboard
Once you like how everything looks, you can move on to adding more visuals to create a full monitoring dashboard.
To add another visual to the analysis, select Add and then Add visual.
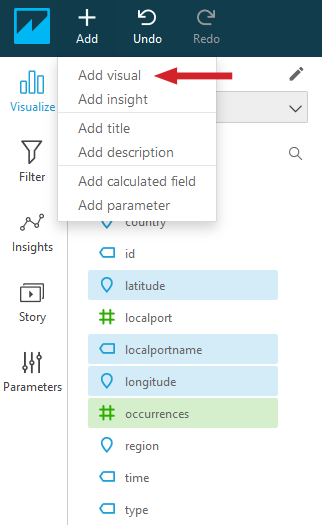
Figure 15: Adding another visual
If the new visual will use the same dataset, then you can immediately start selecting fields to build it. If you want to create a visual from a different data set (our example dashboard below adds the affected_instances view), follow the Creating Data Sets guide to add a new data set. Then return to the current analysis and associate the data set with the analysis by selecting the pencil icon shown below and selecting Add data set.
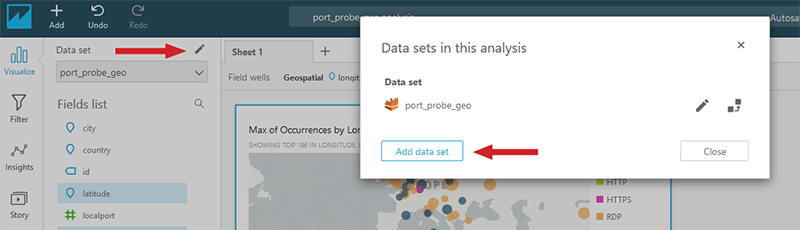
Figure 16: Adding a new data set to your Amazon QuickSight analysis
Repeat this process until you’ve built out everything you need in your monitoring dashboard. Once it’s completed, you can publish the dashboard by selecting Share and then Publish dashboard.
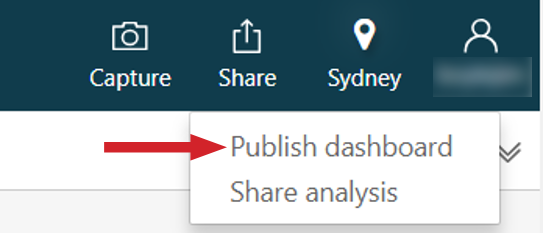
Figure 17: Publish your dashboard using the “Share” option of the Amazon QuickSight menu
Here’s an example of a dashboard we created using the port_probe_geo and affected_instances views:
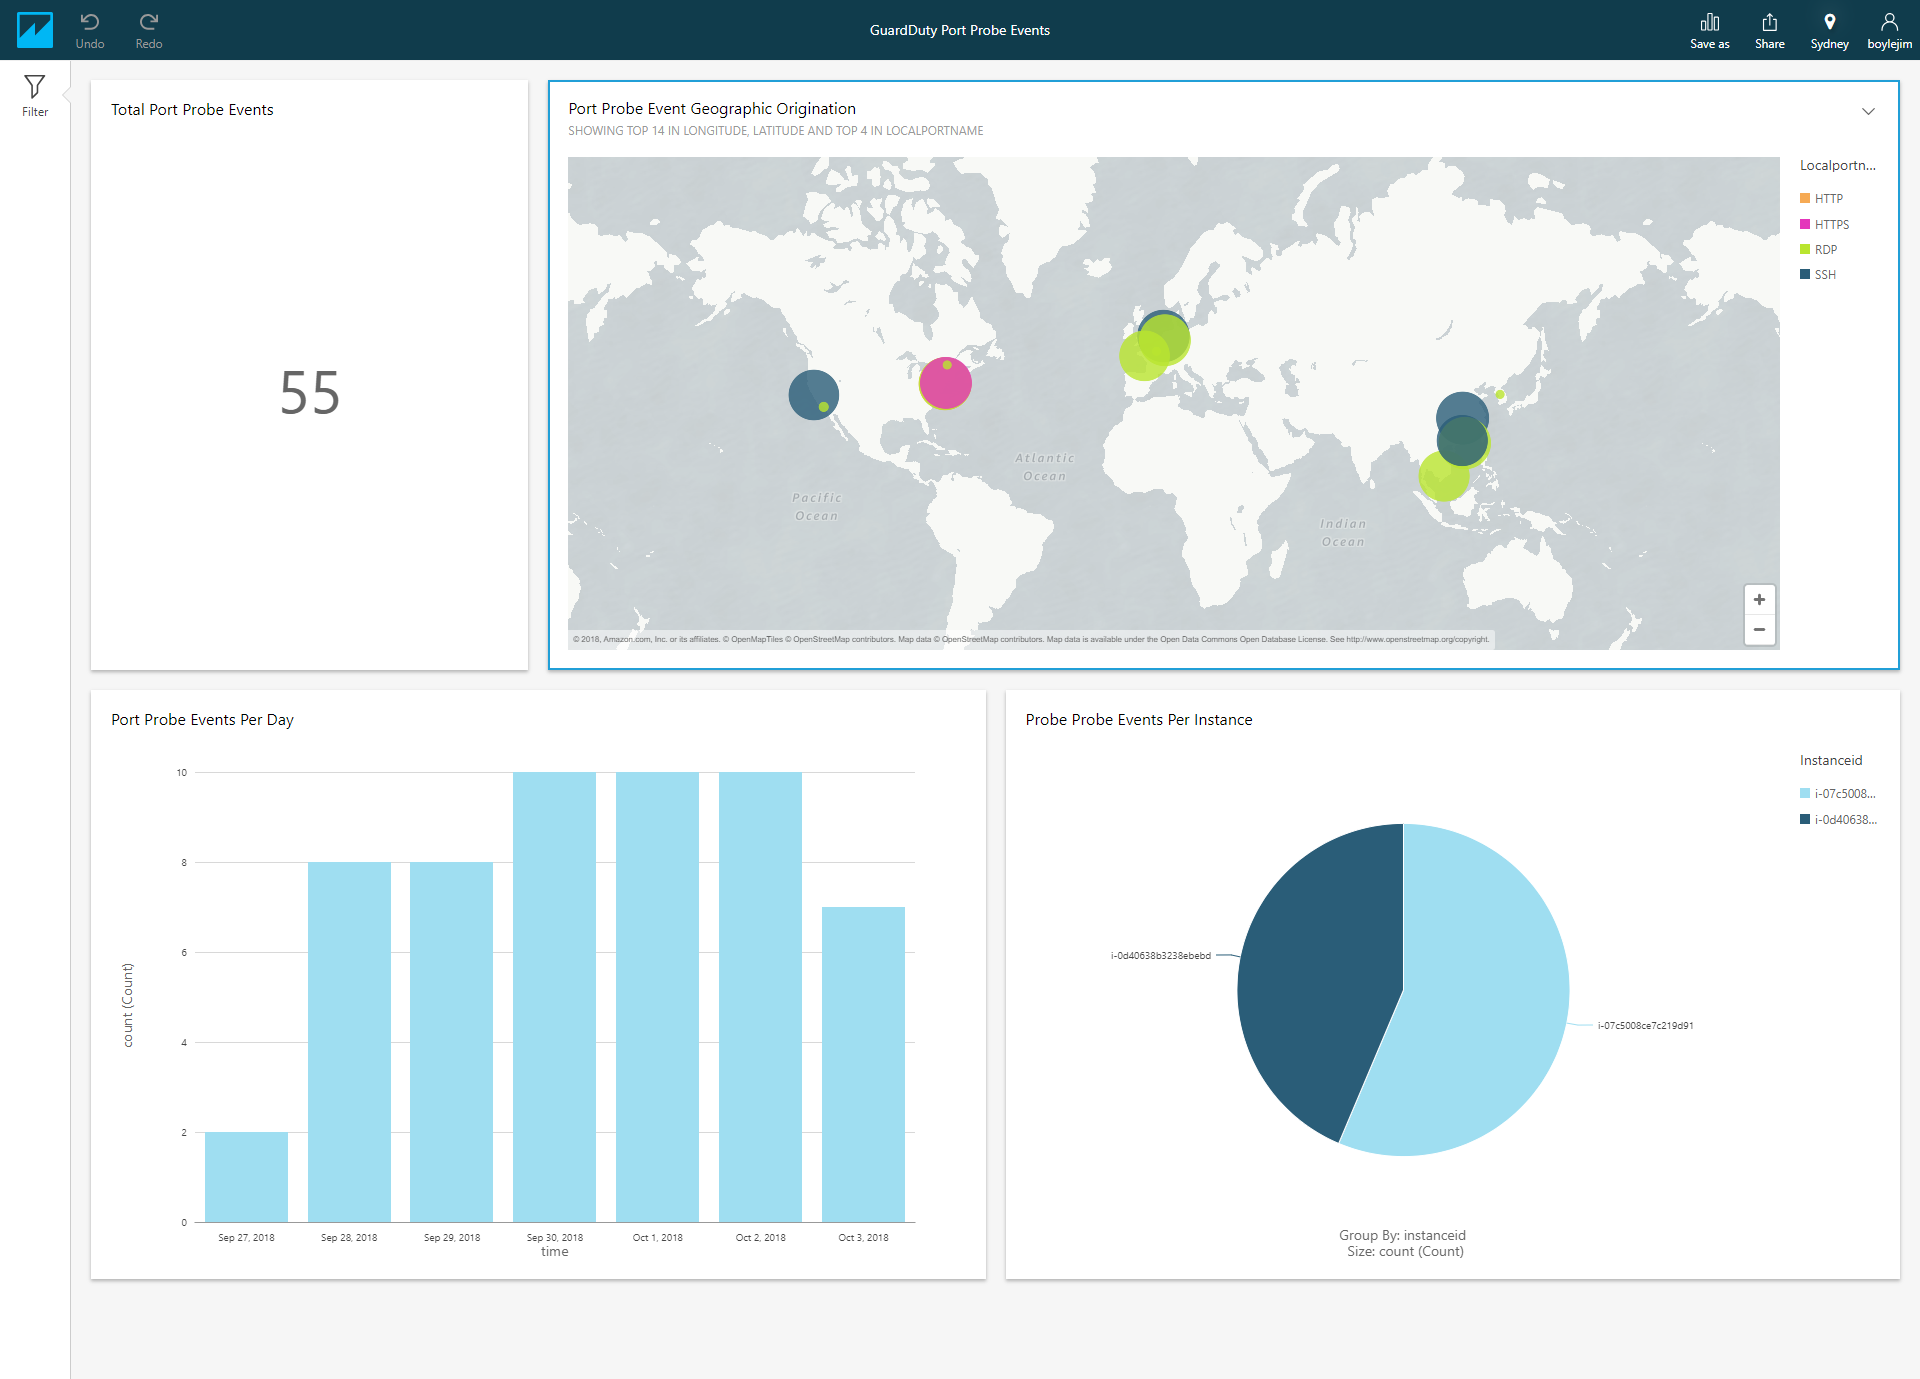
Figure 18: An example dashboard created using the “port_probe_geo” and “affected_instances” views
What does something like this cost?
To get an idea of the scale of the cost, we’ve provided a small pricing example (accurate as of the writing of this blog) that assumes 10,000 GuardDuty findings per month with an average payload size of 5KB.
| Service | Pricing Structure | Amount Consumed | Total Cost |
| Amazon CloudWatch Events | $1 per million events | 10000 events | $0.01 |
| Amazon Kinesis Data Firehose | $0.029 per GB ingested | 0.05GB ingested | $0.00145 |
| Amazon S3 | $0.029 per GB stored per month | 0.1GB stored | $0.00230 |
| AWS Lambda | First million invocations free | ~200 invocations | $0 |
| Amazon Athena | $5 per TB Scanned | 0.003TB scanned (Assume 2 full data scans per day to refresh views) | $0.015 |
| AWS Glue | $0.44 per DPU hour (2 DPU minimum and 10 minute minimum) = $0.15 per crawler run | 30 crawler runs | $4.50 |
| Total Processing Cost | $4.53 |
Oh, the joys of a consumption-based model: Less than five dollars per month for all of that processing!
From here, all that remains are your visualization costs using Amazon QuickSight. This pricing is highly dependent upon your number of users and their respective usage patterns. See the Amazon QuickSight pricing page for more specific details.
Summary
In this post, we demonstrated how you can ingest your GuardDuty findings into S3, process them with AWS Glue and Amazon Athena, and visualize with Amazon QuickSight. All serverless! Each portion of what we showed can be used in tandem or on its own for this or many other data sets. Go launch the template and get started monitoring your AWS environment!
Want more AWS Security how-to content, news, and feature announcements? Follow us on Twitter.