AWS Partner Network (APN) Blog
Rapid Accelerators for SAP Business Content with the Atos AWS Data Lake Accelerator for SAP
By Sachidananda Sahoo, Partner Solutions Architect – AWS
By Ganesh Suryanarayanan, Partner Solutions Architect – AWS
By Naresh Sigamani, Director, Data and Analytics – Atos
 |
| Atos |
 |
With more than 20,000 data lakes already deployed on Amazon Web Services (AWS), customers are benefiting from storing their data in Amazon Simple Storage Service (Amazon S3) and analyzing that data with the broadest set of analytics and machine learning services to increase their pace of innovation.
Many SAP enterprise customers have deployed data lakes to optimize manufacturing outcomes, track business performance, improve forecast, and accelerate product lifecycle management.
The initial process of data extraction involves bringing data from commercial off-the-shelf (COTS) applications and non-COTS applications. There are several approaches to extracting SAP data, as outlined in this AWS blog post about building data lakes with SAP on AWS.
In this post, we will describe how the Atos AWS Data Lake Accelerator for SAP helps customers build a scalable data lake for SAP systems such as SAP S4/HANA or SAP ECC.
Atos is an AWS Advanced Tier Services Partner with the SAP Consulting Competency. Atos is a leader in digital services that believes bringing together people, business, and technology is the way forward.
Customer Challenges
Customers implementing SAP analytics in Amazon Redshift can struggle with the underlying SAP data models and information providers due to a large volume of tables and their underlying relationships.
The effort to convert flat tables and hierarchies to star and snowflake schemas (dimensions, measures key figures, and hierarchies) is usually complex and time consuming. Customers also require a reliable data pipeline from extraction, transformation, and load (ETL) to visualization and virtualization.
The Atos Data Lake Accelerator for SAP combines years of experience in SAP data warehousing technologies with scalable AWS microservices for ingestion, transformation, and data modelling. This solution accelerates the process of building a Redshift data mart anchored by SAP data, and can be used for advanced analytics and reporting on SAP data, or combined with non-SAP data for even more insights.
The solution offers best practices that support current and future business demands and reduces effort, cost, and implementation time (24 months down to six months). The self-service reporting features provide meaningful insights into daily changes that quickly impact decisions to drive your business’s bottom line.
Business Outcomes and Key Performance Indicators
The Atos AWS Data Lak Accelerator for SAP comes with pre-built key performance indicators (KPIs) and the data pipelines needed for a productive run on a daily basis.
KPIs are a group of numerical metrics that may be used to assess the performance of your company over time. They specifically give you the ability to keep track how well you are accomplishing intended aims.
Here are few KPIs which come out of the box with the Atos AWS Data Lake Accelerator for SAP. Please note this is only a sample and not the complete list.
Finance
- Cost for processing a single invoice/cost per invoice: Cost-per-invoice is a key accounts payable metric and is the average cost of processing a single invoice through the organization.
- Aging for accounts receivable/accounts payable: The accounts receivable aging report outlines the amount of uncollected credits (unpaid customer invoices and other receivables), broken down by age range (number of delayed days like 0-30 and 31-60).
- Average profit margin: Profit margin indicates a company’s profitability and whether it made a profit. It’s the ratio of a company’s income (or profit) to its revenue. An average profit margin of a company is their profit margin over a long period.
Purchasing
- Days sales outstanding (DSO): DSO is a measure of the number of days it takes a company to collect its credit sales. It’s a key KPI in calculating cash conversion cycle.
Sales
- Monthly sales growth: This is among the most important KPIs used to measure a company’s growth. It’s the rate of change in sales for a month, compared to the previous month.
- Sales by contact method: A contact method is the “how” of communication with a customer. It ranges from in-person contact to telephone/email to self-service contact methods. ‘Sales by contact’ measures the revenue generated by each of the contact methods used by a company to communicate with its customers. It’s a key indicator of which contact methods bring in the most value in terms of revenue to the company.
Inventory
- On-hand units: This refers to the gross number of units of a product available on hand in the warehouse inventory. It’s a good indicator of the capacity of the business to meet current and future demand. An optimal number of ‘on-hand units’ will be a number that helps meet current and to-be demand, as well as any unforeseen demand spike, while at the same time ensuring a product’s shelf life does not exceed acceptable limits.
- On-hand amount: While ‘on-hand units’ is the quantity of products in store, the ‘on-hand amount’ metric measures the value of goods/products stored in inventory. In addition to helping plan for demand, ‘on-hand amount’ identifies the cost of the products and weighs this against the possibility of wastages. This helps drive decisions around the acceptable risks of wastages to high value products vs. moderate/low value products.
- Inventory turnover rate: This rate is a key supply chain metric that reveals how many times a company’s inventory was replaced (or turned over) in a certain period. That is, how many times has the company completely sold its inventory and stocked up again. It’s a key indicator of efficient use of a company’s assets.
- Average inventory: This is an estimate of the inventory on hand during a particular period. When viewed over a period of time, it’s a key metric that helps companies decide on inventory value and volumes, based on demand, seasonality, shelf life, and other factors.
Sales/Inventory
- Stock to sales ratio: Every company needs to know if its inventory meets sales needs and maintain a healthy volume. The ‘stock to sales ratio’ is a crucial inventory management KPI which measures the value of inventory compared to the value of sales in a certain period. A low ‘stock to sales ratio’ indicates a healthy, strong movement of products from inventory to sales.
Sales/Finance/Procurement
- Aging for invoice count: While ‘accounts receivable aging’ and ‘accounts payable aging’ reports provide aging data in terms of amount, the ‘invoice count aging’ report provides aging information in terms of number of invoices due (to be paid or received), broken down by age range. This helps identify customer credit risks (a customer with a consistently large number of due invoices may be a credit risk) and fine-tune collection/payment practices to improve the outcomes for the company.
Solution Architecture
The architecture diagram below provides a high-level data platform design from source to consumer. It should be read from left to right which comprises four sections:
- Source system
- Extraction and loading
- Transformation
- Consumer
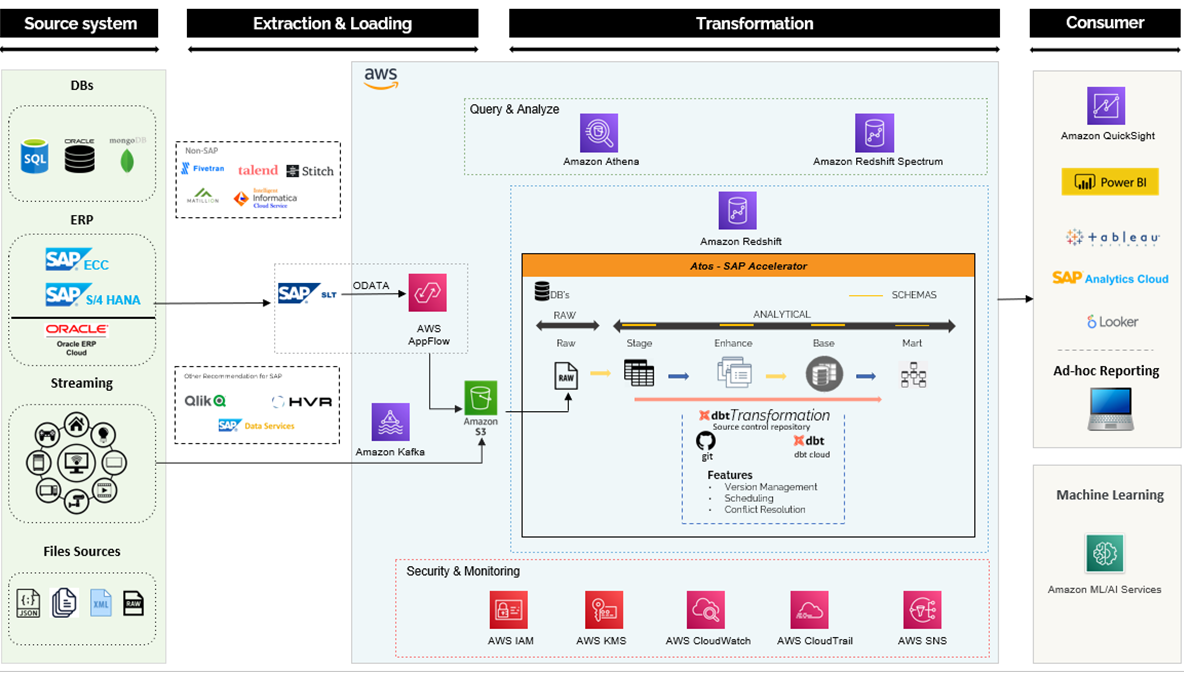
Figure 1 – Technical architecture.
Source Systems
The source system could be SAP ECC or S/4HANA. The instances could be hosted in AWS or on-premises environments.
Data Ingestion
Data ingestion is the process of moving and replicating data from data sources to destinations such as a cloud data lake, data warehouse, or database.
For SAP systems like SAP ECC or S4/HANA, data ingestion will be accomplished through a few distinct ways.
- SAP systems: Data ingestion for SAP systems like SAP ECC or S4/HANA will be achieved through few different mechanisms:
- The Amazon AppFlow SAP OData connector provides the ability to fetch, create, and update records exposed by SAP through OData APIs. For mass data extraction with change data capture (CDC), AppFlow uses SAP’s operational data provisioning framework. More information on this mode of extraction is available in this AWS blog post.
- Utilizing partner tools like Qlik, HVR, and SAP data service (an SAP-native product) to do data ingestion based on various replication techniques is another option.
- Non-SAP systems: The method suggested for the SAP system may not be appropriate for data ingestion for non-SAP systems. The simple, recommended lightweight utility below will effortlessly lift and move data from a source to a destination.
- AWS Glue
- Fivetran
- Talend
- Stitch
- Matillion
- Informatica Cloud Service
Extract, Transform, and Load
ETL is a traditional way of a data orchestration process. Modern business intelligence (BI) solutions enable organizations with more compute options at a low cost. ETL is a modern way of the data orchestration process which extracts and loads the data into a warehouse like Amazon Redshift.
ETL describes the three stages of the contemporary data processing method. Combined with cloud-based data warehousing, this offers many advantages including quick time to value, stability, and flexibility.
Data Warehouse
The Atos AWS Data Lake Accelerator for SAP will be deployed within Amazon Redshift which has two databases:
- Raw: All raw tables will be loaded into the raw database without any transformation.
- Analytics: Analytics will be segregated into four layers:
- Stage (views)
- Change field names to readable forms
- Consistent data type casting
- Date/time validation
- Enhance (tables)
- Maintain the data at a more granular level
- Create dimensions
- Create facts
- Base (tables)
- Create aggregate tables
- Create flatten tables
- Mart (view)
- Create a certified business view
- Stage (views)
Transformation
Data transformation is the process of revising, cleaning, separating, and combining raw data into analysis-ready data models.
DBT (data build tool) is the “T” in the modern ETL stack. It takes select statements and deploys them into your warehouse as tables and views. DBT offers the following benefits:
- Build a complex Directed Acyclic Graph (DAG) with ease by providing data lineage and data dictionary.
- Version management.
- Unit testing.
- CI/CD workflow incorporation (spawn events and processes from code commits).
- Built-in logging and environment management.
Data Visualization
Self-service analytics can be consumed from materialized views in Amazon Redshift, which provides connectors for several visualization tools in the marketplace. A sample of the accounts receivable KPI is provided below, beginning with the Amazon QuickSight dashboard for accounts receivable.
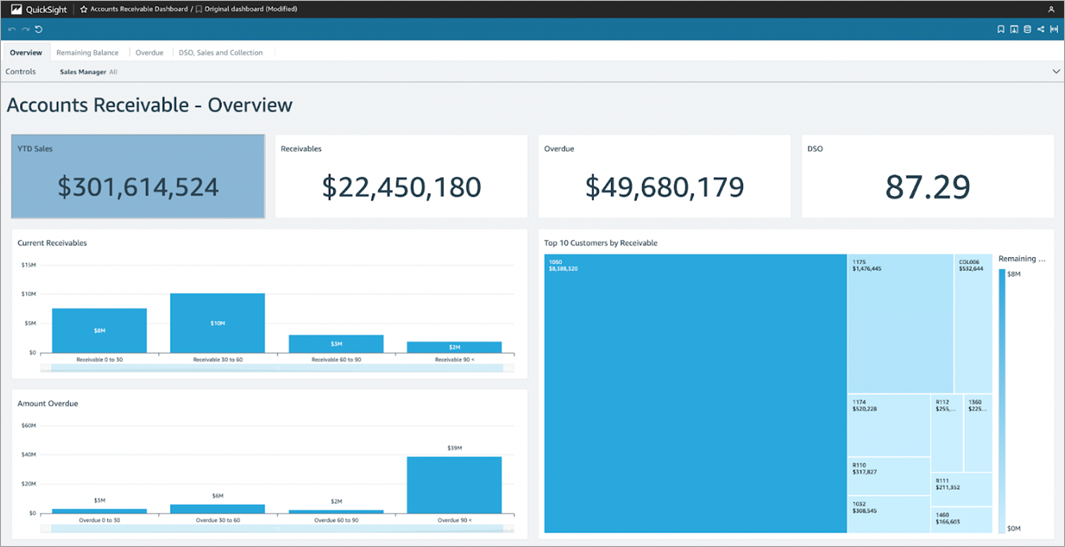
Figure 2 – Amazon QuickSight dashboard for accounts receivable.
The dashboard for accounts receivable can also be configured in Power BI.

Figure 3 – Accounts receivable dashboard (Power BI).
The Atos AWS Data Lake Accelerator for SAP can also be extended to include data virtualization for API-based consumption of data marts. The consumers include SAP data warehouse cloud and SAP analytics cloud.
Summary
This post focused on building data lakes with SAP data and accelerating the process with preconfigured data marts from Atos for SAP. The solution provided end-to-end capabilities for data ingestion, ETL, and visualization.
For more information on how Atos can support your SAP to AWS data lake project, contact Atos for a consultation.
You can also try out the Atos AWS Data Lake Accelerator for SAP on AWS Marketplace.
.

.
Atos – AWS Partner Spotlight
Atos is an AWS Advanced Tier Services Partner and MSP that supports clients’ digital ambitions and believes that bringing together people, business, and technology is the way forward.