AWS Security Blog
How to analyze AWS WAF logs using Amazon Elasticsearch Service
September 9, 2021: Amazon Elasticsearch Service has been renamed to Amazon OpenSearch Service. See details.
Log analysis is essential for understanding the effectiveness of any security solution. It can be valuable for day-to-day troubleshooting and also for your long-term understanding of how your security environment is performing.
AWS WAF is a web application firewall that helps protect your web applications from common web exploits that could affect application availability, compromise security, or consume excessive resources. AWS WAF gives you control over which traffic to allow or block to your web applications by defining customizable web security rules.
With the release of access to full AWS WAF logs, you now have the ability to view all of the logs generated by AWS WAF while it’s protecting your web applications. In addition, you can use Amazon Kinesis Data Firehose to forward the logs to Amazon Simple Storage Service (Amazon S3) for archival, and to Amazon Elasticsearch Service to analyze access to your web applications.
In this blog post, I’ll show you how you can analyze AWS WAF logs using Amazon Elasticsearch Service (Amazon ES). I’ll walk you through how to find out in near-real time which AWS WAF rules get triggered, why, and by which request. I’ll also show you how to create a historical view of your web applications’ access trends for long-term analysis.
Architecture overview
When enabled, AWS WAF sends logs to Amazon Kinesis Data Firehose. From there, you can decide what to do with them next. In my architecture, I’ll forward the relevant logs to Amazon ES for analysis and to Amazon S3 for long-term storage.
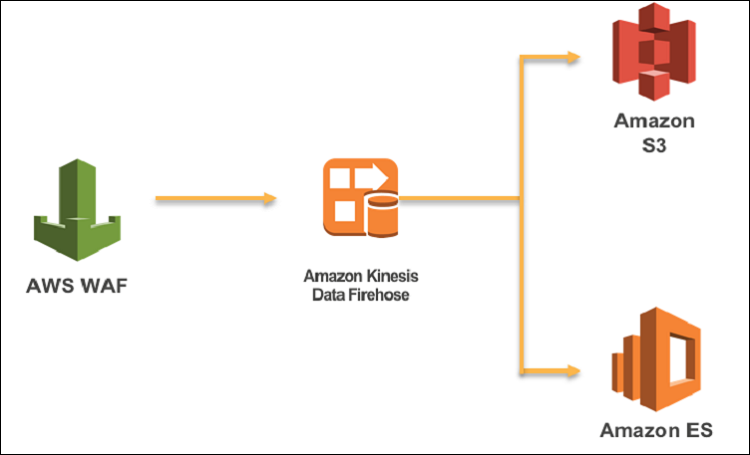
Figure 1: Architecture overview
In this blog, I will show you how to enable AWS WAF logging to Amazon ES in the following steps:
- Create an Amazon Elasticsearch Service domain.
- Configure Kinesis Data Firehose for log delivery.
- Enable AWS WAF logs on a web access control list (ACL) to send data to Kinesis Data Firehose.
- Analyze AWS WAF logs in Amazon ES.
Note: The region in which you should enable Kinesis Data Firehose must match the region where your AWS WAF web ACL is deployed. If you’re enabling logging for AWS WAF deployed on Amazon CloudFront, then Kinesis Data Firehose must be created in the Northern Virginia AWS Region.
Preparing Amazon Elasticsearch Service
If you don’t have your Amazon ES environment already running on AWS, you’ll need to create one. Start by navigating to the Elasticsearch Service from your AWS Console and choosing Create a new domain. There, you will be able to define the namespace for your Elasticsearch cluster and choose the version you’d like to use. In my setup, I’ll be using awswaf-logs as my namespace and version 6.3 of Elasticsearch.
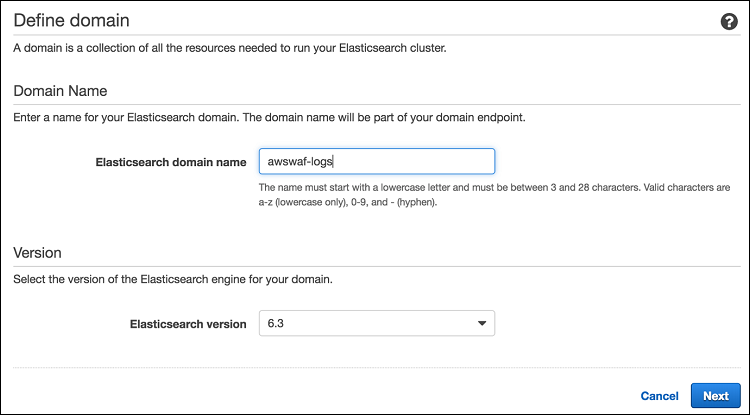
Figure 2: Defining Amazon ES Domain
You can also decide on other parameters, like the number of nodes in your cluster or how to access the dashboards. See the Amazon Elasticsearch Service Documentation to find out more details about setting up your environment, or review this previous blog post, which goes deeper into Amazon ES setup.
When your environment is ready, you’ll be able to click on your namespace and find the link to your Kibana dashboard. Kibana is the data visualisation plugin for Elasticsearch that you’ll use to analyze your logs.
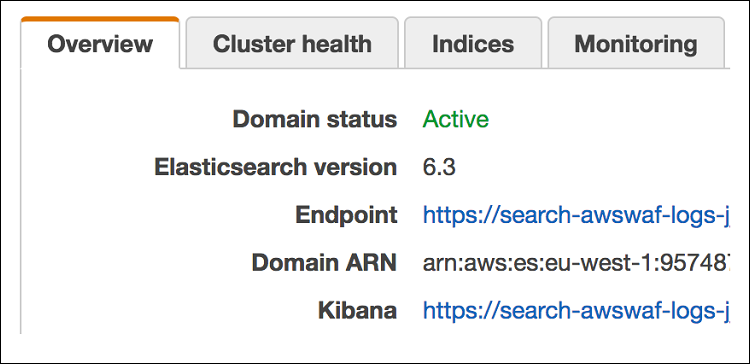
Figure 3: Identifying the Kibana management URL
While Elasticsearch can automatically classify most of the fields from the AWS WAF logs, you need to inform Elasticsearch how to interpret fields that have specific formatting. Therefore, before you start sending logs to Elasticsearch, you should create an index pattern template so Elasticsearch can distinguish AWS WAF logs and classify the fields correctly.
The pattern template I’m using below will be applied to all indexes beginning with the string awswaf-. That’s because in my setup all AWS WAF log index files created in Elasticsearch will always begin with the character string awswaf- followed by a date.
The pattern template is defining two fields from the logs. It will indicate to Elasticsearch that the httpRequest.clientIp field is using an IP address format and that the timestamp field is represented in epoch time. All the other log fields will be classified automatically.
In the template, I’m also setting the number of Elasticsearch shards that should be used for the index. Shards help with distributing large amount of data and their number depends on the size of the index—the larger the index the more shards it should be deployed across. I’m going to use only one shard since I expect my index to be less than 30 GB. For recommendations on sizing your shards appropriately, refer to Jon Handler’s blog post on using Amazon Elasticsearch Service.
I’m going to apply this template to Elasticsearch through the Kibana developer interface (from the Dev Tools tab in the Kibana dashboard), but it can also be done through an API call to the Amazon ES endpoint.
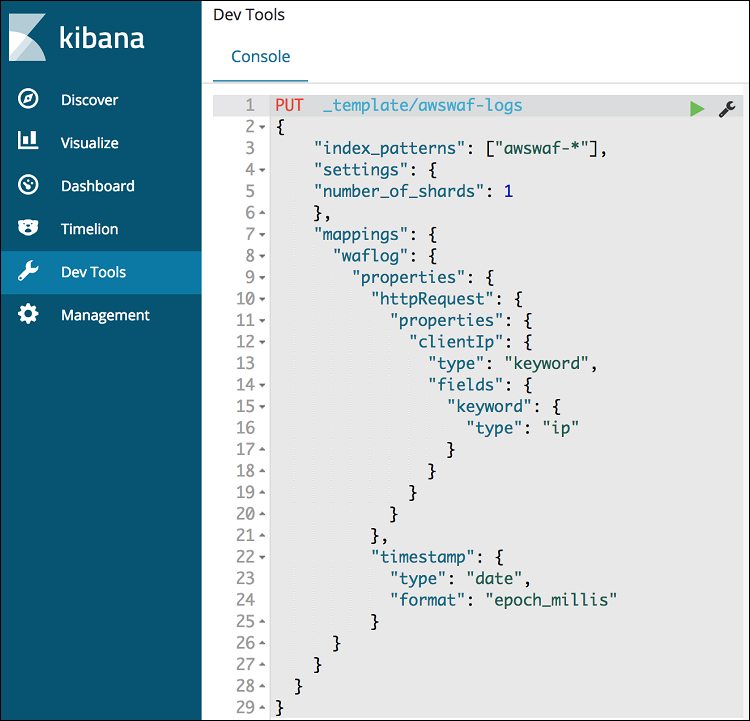
Figure 4: Applying the index pattern template in Kibana
The template will be applied to all log indexes starting with the awswaf- prefix. This is the prefix name you’ll use at a later stage in the Kinesis Data Firehose configuration.
Setting up Kinesis for log delivery
With Amazon ES now ready to receive AWS WAF logs, I’ll show you how to use Amazon Kinesis Data Firehose to deliver your logs to Amazon S3 and Amazon ES. This is a prerequisite before you enable logging in AWS WAF.
First, go to the Kinesis service in the AWS Console and under the Data Firehose tab choose Create delivery stream. If the Data Firehose stream is going to be used for WAF logs, its name must start with aws-waf-logs-. I’ll enable logging for the already existing web ACL that I’m using for OWASP top 10 protection, therefore I’ll name my delivery stream aws-waf-logs-owasp.
Keep all the settings at the default until you get to the Select destination page. On this page, you’ll configure Amazon Elasticsearch Service as the destination for your logs. Make sure you enter awswaf as the index name and waflog as the type to match the index pattern template you already created in Elasticsearch earlier.
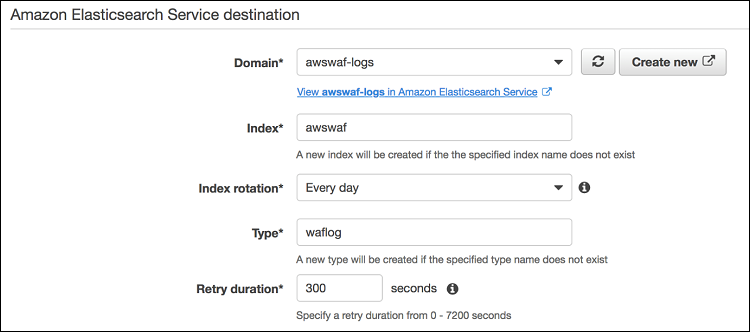
Figure 5: Setting up Amazon ES as Data Firehose log destination
On this page, you can also set what to back up to Amazon S3—either all records or just the failed ones. You’ll then need to decide on the bucket to use, specify the prefix, and then select Next.
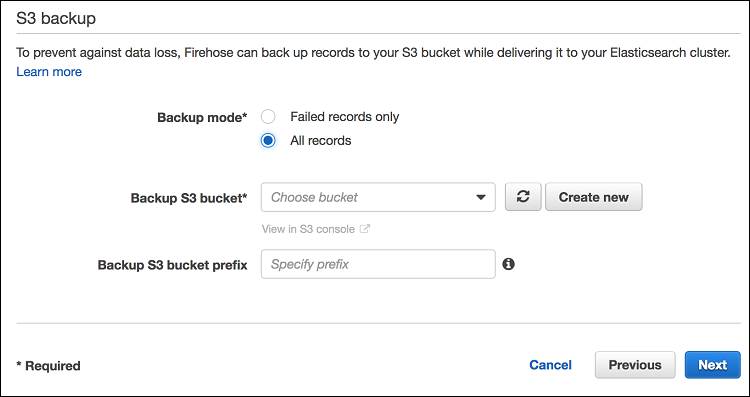
Figure 6: Setting up S3 backup in Data Firehose
On the next page, you’ll have the option to update the buffer conditions—size and interval. These indicate how often Kinesis Data Firehose will send new data to Amazon ES. The lower the values you set, the closer to real time your log delivery will be. In my example, I’ve configured a buffer size of 1 MB and a buffer interval of 60 seconds.
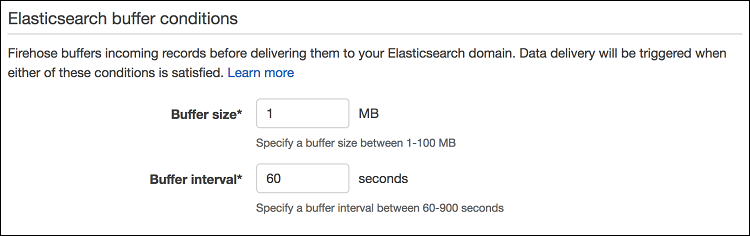
Figure 7: Setting up Data Firehose buffer conditions
Next, you’ll need to specify an IAM role that enables Kinesis Data Firehose to send data to Amazon S3 and Amazon ES. You can select an existing IAM role or create a new one. For more information about creating a role, see Controlling Access with Amazon Kinesis Data Firehose.
Finally, review all the settings, and complete the creation of your Kinesis Data Firehose.
Enabling AWS WAF logging
Now that you have Kinesis Data Firehose prepared, you can enable logging for an existing AWS WAF Web ACL. You can do this in the AWS Console under the AWS WAF & AWS Shield service. Go to the Web ACLs tab and select the Web ACL for which you want to start logging. Then, under the Logging tab, choose Enable Logging.
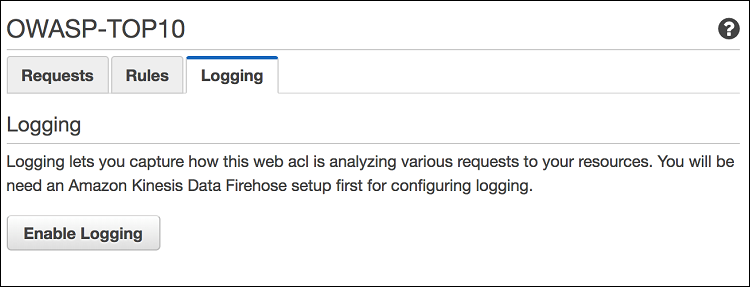
Figure 8: Enabling logging for AWS WAF web ACL
On the next page, specify the Kinesis Data Firehose that the logs should be delivered to. If you can’t see any options in the drop-down list, make sure that the Kinesis Data Firehose you configured earlier is deployed in the same region as the web ACL you’re enabling logging for and that its name begins with aws-waf-logs-. Remember that for CloudFront web ACL deployments, the Kinesis Data Firehose should be created in the Northern Virginia Region.
Searching through logs
As soon as you log back into your Kibana dashboard for Amazon ES, you should see a new index appear called awswaf-<date>. You’ll need to define an index pattern that will encompass all the potential awswaf log entries. Configure your index pattern description as awswaf-*, and on the next screen select timestamp as the time filter.
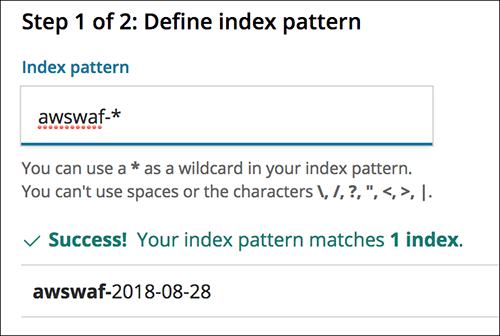
Figure 9: Configuring the Kibana index pattern
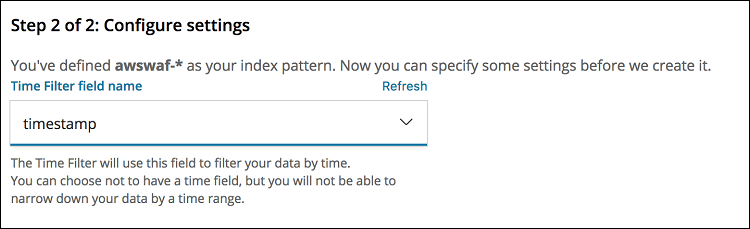
Figure 10: Configuring a time filter for the index pattern
After you complete the setup of your index pattern, you’ll be able to run searches through your logs by going into the Discover tab in Kibana. The searches can be based on any fields in the AWS WAF logs. For example, you can look for specific HTTP headers, query strings, or source IP addresses to find out what action has been applied to them. To find out more about what fields are available in the AWS WAF logs, see the AWS WAF Developer Guide.
In the example search that follows, I’m looking for all of the log entries where a web ACL has blocked the traffic and the HTTP arguments were equal to name=badname.
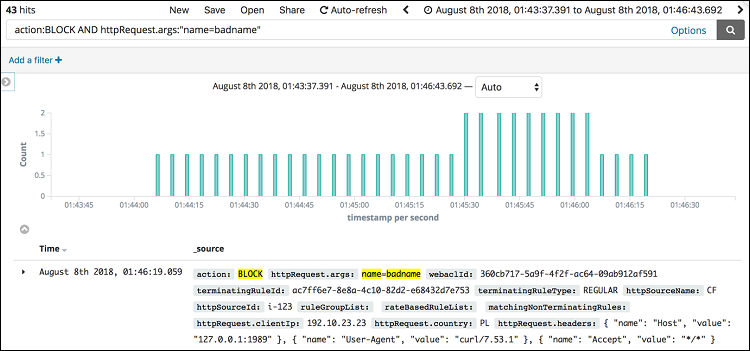
Figure 11: An example ad-hoc search
This approach can help you identify specific request based on their parameters, such as a cookie, host header, query string, and understand why they are being blocked (or allowed) and by which web ACL. It is especially useful for tuning AWS WAF to match your web application.
Building a dashboard
You can also use Amazon ES to create custom graphs to look at long-term trends—and you can combine your graphs into a dashboard. For example, you may want to see the number of blocked and allowed requests by IP address to identify potentially hostile IP addresses.
To understand the breakdown of the requests per IP address, you should first set up a graph showing the number of requests that were blocked and allowed by AWS WAF per source. To do this, go to the Visualize section of your Kibana dashboard and create a new visualization. You can select from a variety of visualization options, but I’m going to use the horizontal bar chart for the example that follows.
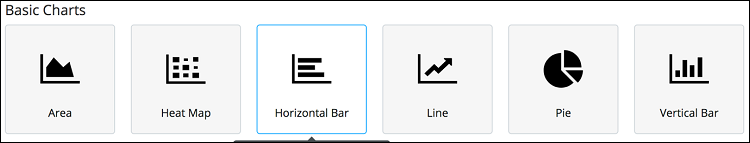
Figure 12: Configuring primary bucket parameters
- Select your index and then configure your graph options. For a horizontal bar chart, leave the Y axis to represent the count of requests, but expand the primary bucket (X-Axis) form and change the fields to show the source IP address and action:
- From the Aggregation dropdown, select Terms.
- From the Field dropdown, select httpRequest.clientIP.
- From the Order By dropdown, select metric: Count.

Figure 13: Configuring bucket series
- Next, expand the Split Series section and adjust the following dropdown fields:
- From the Sub Aggregation dropdown, select Terms.
- From the Field dropdown select action.keyword.
- From the Order By dropdown, select metric: Count.

Figure 14: Sample Kibana graphs
- Apply your changes by selecting the play button at the top of the page. You should see the results appear on the right side of the screen.

Figure 15: Select the “Apply changes” button
You can combine graphs into dashboards that aggregate relevant information about AWS WAF functionality. In the sample dashboard below, I’m showing multiple visualisations focusing on different dimensions like request per country, IP address, and even which WAF rules get the most hits.
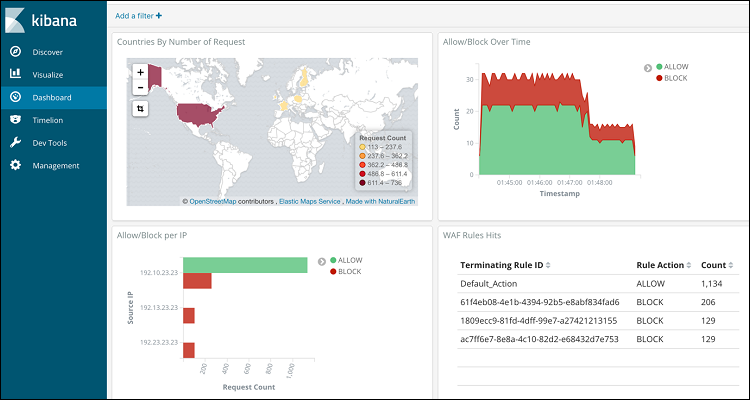
Figure 16: You can combine graphs
I’ve made the sample dashboard and sample visualizations available for download. They can be imported to your Kibana instance in the Management/SavedObjects section of the dashboard.
Conclusion
The ability to access AWS WAF logs for any web ACL allows you to start analyzing the requests coming to your web applications. In this post, I’ve covered an example of how you can use Amazon Elasticsearch Service as a destination for AWS WAF logs and shown you how to run searches on the log data as well as build graphs and dashboards. Amazon ES is just one of the destination options for native log delivery. To learn more, please refer to the documentation on how to send data directly to Amazon S3, Amazon Redshift, and Splunk.
If you have feedback about this blog post, submit comments in the Comments section below. If you have questions about this blog post, start a new thread on the WAF forum or contact AWS Support.
Want more AWS Security news? Follow us on Twitter.