AWS News Blog
CloudWatch Contributor Insights for DynamoDB – Now Generally Available

|
Amazon DynamoDB provides our customers a fully-managed key-value database service that can easily scale from a few requests per month to millions of requests per second. DynamoDB supports some of the world’s largest scale applications by providing consistent, single-digit millisecond response times at any scale. You can build applications with virtually unlimited throughput and storage. DynamoDB global tables replicate your data across multiple AWS Regions to give you fast, local access to data for your globally distributed applications. For use cases that require even faster access with microsecond latency, DynamoDB Accelerator (DAX) provides a fully managed in-memory cache.
In November 2019, we announced Amazon CloudWatch Contributor Insights for Amazon DynamoDB as Preview, and today, I am happy to announce it is Generally Available for all AWS Regions.
Amazon CloudWatch Contributor Insights for Amazon DynamoDB
Amazon CloudWatch Contributor Insights, which also launched in November 2019, analyzes log data and creates time-series visualizations to provide a view of top contributors influencing system performance. You do this by creating Contributor Insights rules to evaluate CloudWatch Logs (including logs from AWS services) and any custom logs sent by your service or on-premises servers. For example, you can find bad hosts, identify the heaviest network users, or find the URLs that generate the most errors.
For developers building applications on top of DynamoDB, it’s useful to understand your database access patterns, such as traffic trends and frequently accessed keys, to help optimize DynamoDB costs and performance. You can create visualizations of these patterns with just a few clicks in the console using CloudWatch Contributor Insights for DynamoDB. DynamoDB automatically creates the required CloudWatch resources, then provides a summary view of the graphs. This summary view lives in the DynamoDB console, but you can also see the individual rule details in the CloudWatch console with other CloudWatch Contributor Insights rules, reports, and graphs of report data.
You can use these graphs to view traffic trends and pinpoint any hot keys in your DynamoDB tables.
How it works
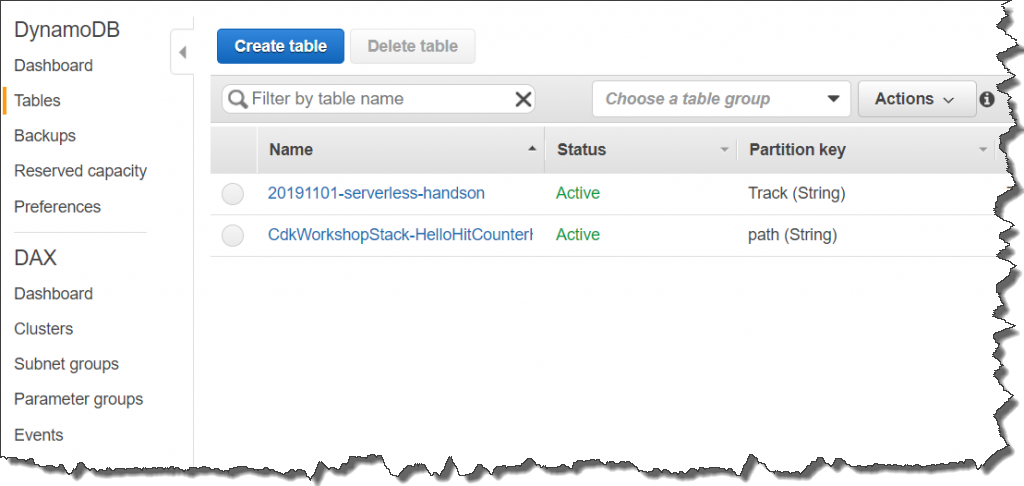
Let’s see how it works and how it benefits developers. Here is a table on DynamoDB.
If we select any table, we can see details of the table. Click the new tab called [Contributor Insights].
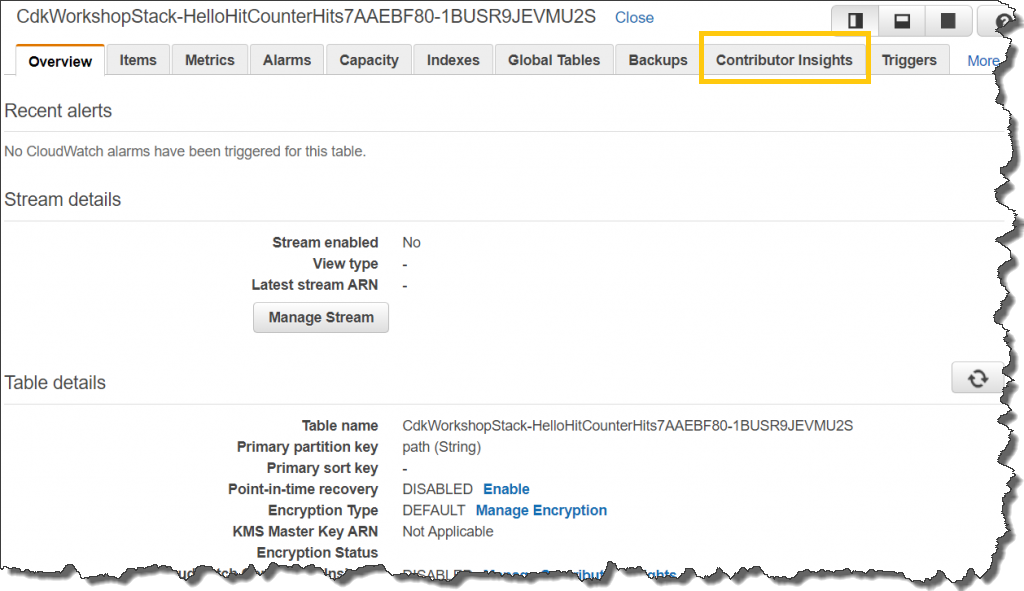
CloudWatch Contributor Insights is now DISABLED. You can enable by selecting the upper [Contributor Insights] tab.

When you access the [Contributor Insights] tab, you can check its status. The activation process is very easy (this is one of my favorite points of this feature!) If you click [Manage Contributor Insights], a dialog pop-up comes up.

If you choose [Enabled] and click [Confirm], Dashboard comes up, and CloudWatch Contributor Insights for DynamoDB will record every access to the table.
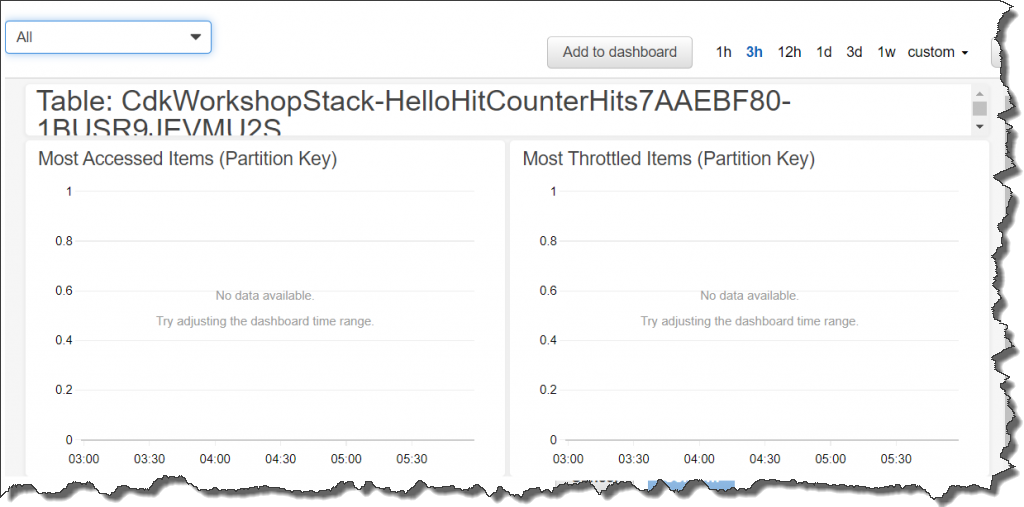
After a while, you will see table insights by some graphs.

You can change the time range in the upper right corner of the dashboard, or simply click and drag a graph directly.
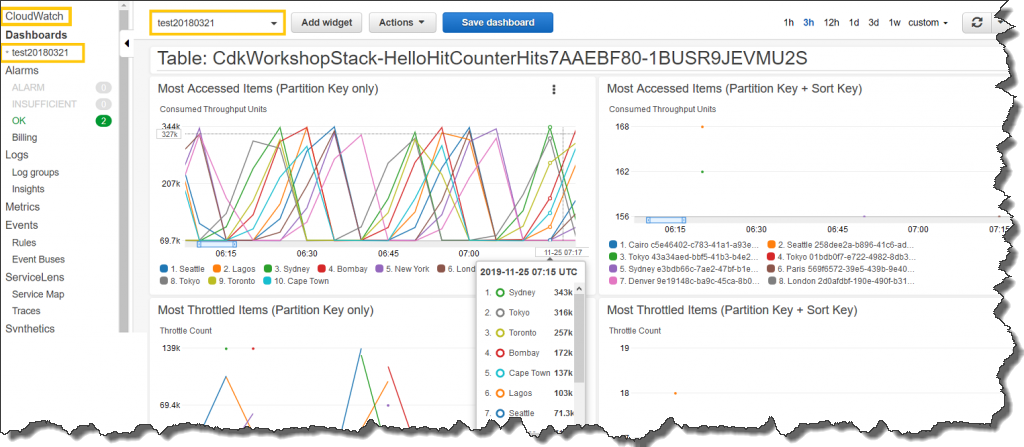
What does the dashboard tell us?
The dashboard shows us 4 metrics, which are powerful insights for application performance tuning. DynamoDB creates separate visualizations for partition key vs. partition+sort key, so if your table doesn’t have a sort key, then you will only see two graphs, not all four.
- Most Accessed Items (Partition Key only) – Identifies the partition keys of the most accessed items in your table or global secondary index.
- Most Accessed Items (Partition Key + Sort Key) – Identifies the partition and sort keys of the most accessed items in your table or global secondary index.
- Most Throttled Items (Partition Key only) – Identifies the partition keys of the most throttled items in your table or global secondary index.
- Most Throttled Items (Partition Key + Sort Key) – Identifies the partition and sort keys of the most throttled items in your table or global secondary index.
Most Accessed Items
Let’s break down what these metrics and graphs mean, starting with the “Most Accessed Items” metrics. This metric shows the frequency of which a key is accessed, based on both read and write traffic.
Outliers in these graphs are your most frequently accessed, or hottest, keys. Many DynamoDB workloads have at least some imbalanced traffic, but you can use this graph to see whether your workload will bump against DynamoDB’s per-key limits. On the other hand, if you see several closely clustered lines without any obvious outliers, it indicates that your workload is relatively balanced across items over the given time window (great job balancing your workload!)
Most Throttled Items
The “Most Throttled Items” shows just that, a graph of throttle count over time for your most throttled keys. If you see no data in this graph, it means your requests have not been throttled. If you see isolated points instead of connected lines, that indicates an item was throttled only for a brief period.
This blog article “Choosing the Right DynamoDB Partition Key” tells us the importance of considerations and strategies for choosing the right partition key for designing a schema that uses Amazon DynamoDB. Choosing the right partition key is an important step in the design and building of scalable and reliable applications on top of DynamoDB. Also, you can check our DynamoDB documentation page “Best Practices for Designing and Using Partition Keys Effectively“.
Integrating with CloudWatch Dashboard
This feature is integrated with CloudWatch for ease of use. You can integrate any of these graphs onto an existing CloudWatch dashboard. Let’s see how to do it. Going back to the DynamoDB dashboard, click [Add to dashboard].
You are redirected to CloudWatch Management Console, and are asked which dashboard to add in.
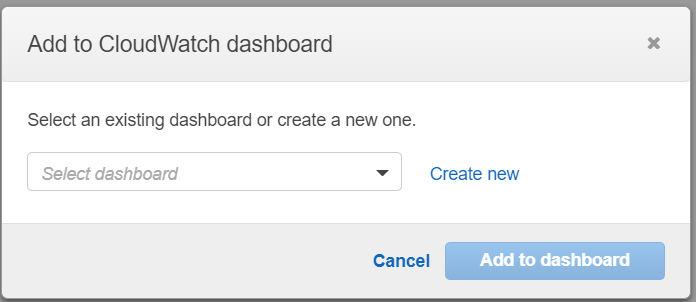
You can choose any existing dashboard or create a new one. For example, I put these metrics into my existing test dashboard as [test20180321].
Activating the feature does not affect anything in your existing production environment. You can enable it or disable it ay any time.
Generally Available Today
This feature is generally available today for all AWS regions.
– Kame;