AWS Big Data Blog
Query and Visualize AWS Cost and Usage Data Using Amazon Athena and Amazon QuickSight
If you’ve ever wondered if a serverless alternative existed for consuming and querying your AWS Cost and Usage report data, then wonder no more. The answer is yes, and this post both introduces you to that solution and illustrates the simplicity and effortlessness of deploying it.
This solution leverages AWS serverless technologies Amazon Athena, AWS Lambda, AWS CloudFormation, and Amazon S3. But it doesn’t stop there, as you can also use Amazon QuickSight, a Serverless cloud-powered business analytics service, to build visualizations and perform ad-hoc analysis of your sanitized AWS Cost and Usage report data.
Amazon Athena, what’s that?
Amazon Athena is an interactive query service that makes it easy to analyze data directly in Amazon S3 using standard SQL. It’s a Serverless platform in which there is no need to set up or manage infrastructure. Athena scales automatically—executing queries in parallel—so results are fast, even with large datasets and complex queries.
Athena exposes several API operations that allow developers to automate running queries or using services like Lambda to trigger queries in response to events in other services like S3. This solution takes advantage of these abilities and allows you to focus on running the SQL queries that yield the results you are looking for. This solution builds the components in Athena that are needed for you to run these queries, for example, building and maintaining a database and corresponding table.
So, what’s the solution?
Today, the Billing and Cost Management service writes your AWS Cost and Usage report to an S3 bucket that you designated during the time of creation. You have the option to have AWS write these files as a GZIP or ZIP file on a schedule basis. This schedule can either be hourly or daily.
The CloudFormation template that accompanies this blog post builds a Serverless environment that contains a Lambda function that takes a CUR file, unzips it in memory, removes the header row and writes the modified report to an S3 bucket. The Lambda function writes this file into an S3 Bucket with a directory structure of “year=current-year” and “month=current-month”. For example, if a file is written for June 1st, 2017 then the Lambda function writes the file in the folder path “bucket-name/year=2017/month=06/file_name”. The S3 bucket in which the Lambda function creates the aforementioned directory structure is constructed at the time the environment is built by the CloudFormation template.
The following diagram provides an example of what you should see in the AWS Management Console after your Lambda function runs.

You might be wondering why the Lambda function writes the files in a directory structure like the following.

The Lambda function writes data in this folder structure to allow you to optimize for query performance and cost when executing queries in Athena against your transformed AWS Cost and Usage report billing data stored in S3. For example, if you wanted to run a query to retrieve all billing data for the month of June, you could run the following query:
This query would only scan the folder path month=06 and return the files within that folder. This means that you only scan the data that you need, which is a smaller subset of your overall stored billing data/reports. Given that Athena only charges you for the amount data scanned (which is $5 per TB), partitioning your data allows you to reduce the cost of querying data using Athena.
The following diagram shows what that query looks like in Athena.
What happens after the Lambda function extracts, transforms, and re-writes this file? After writing the newly transformed file, the Lambda function checks Athena to see if the database “aws_billing_report” exists. If not, then the function creates it. After it’s created, the function then creates the table “my_cur_report” that is partitioned by “year” and “month”. After this table is created, the Lambda function takes the folder structure that you created in your S3 bucket and adds that folder structure to your Athena metadata store as database partitions.
Note: Athena is not a database; it simply projects the schema that you define for your table on top of the data stored in S3. When you delete a table or database, you are deleting the metadata for the table or database in Athena. You can’t use Athena to delete your data stored in S3. For more information, see the Amazon Athena User Guide.
Things to note
This solution only processes the current and previous month’s bills. This release does not process bills written before that. Today, this solution only supports GZIPPED files of any size. Future releases of the Lambda code will also process ZIP files and Parquet.
Athena queries
The following table provides a step-by-step guide as to what happens in your serverless environment from start to finish.
Solution Updates (as of 1/8/2019)
The activities described above, are the fundamental day to day operational functions this solution performs on your Amazon Cost and Usage reports. In addition to these features, this upgraded solution has new functionality that adds benefits to your organization in the area of cost reduction and query ability.
The first version of this solution only allowed for the processing of the current month’s CUR and the previous month. Today, this solution has been upgraded to process all previous month’s bills. That is, this solution automatically executes an Amazon Lambda function that retroactively processes all Cost and Usage Reports (CUR) that has ever been written to your designated Amazon S3 bucket. It also creates an Amazon Athena table for each month.
In addition to the new feature mentioned above, this solution also, automatically executes a suite of new Lambda functions that removes duplicated Cost and Usage reports from the S3 bucket that has been designated to store your raw reports. That is, all historically duplicated report information is deleted, leaving only the current relevant raw files in your source bucket.
Lastly, this solution can now be launched in seven additional Amazon Region, that ranges from Oregon to Tokyo.
If your environment was built using the first version of this solution, then you can gain all the above new features by updating your stack. Instructions on how to update or launch new stack are listed below.
Note: All tables created in Amazon Athena with the old solution should be manually deleted prior to launching or updating your CloudFormation stack.
Setting up the AWS Cost and Usage report
There are two things you must know and two things you must do in order to launch this solution successfully. First, you must know both the name of your AWS Cost and Usage report, and the name of the S3 bucket in which the reports are currently stored.
If you already have your report set up, ensure that there is a manifest file written to the /date-path folder in your reports folder. The manifest file is important because it’s a map to where the latest reports are stored. For example, if your report name is “andro-cost-n-usage-report”, the name of your bucket is “my-report-bucket” and the current month is August (in the year 2017) then the path you should check is “my-report-bucket/ andro-cost-n-usage-report/20170801-20170901”.
If you don’t have a report set up, then follow the steps in Turning on the AWS Cost and Usage Report. For Include, choose Redshift Manifest. For Enable support for, choose Redshift.
Launching the CloudFormation template
Now for the things that you must do. First, given the name of your AWS Cost and Usage report, launch the CloudFormation template that builds all the serverless components to make running queries against your billing data effortless.
Choose the same AWS Region in which your S3 bucket is located, to which AWS writes your bills. Also, I have only included options for the regions in which Athena, Lambda, and Amazon QuickSight are currently available.
| Northern Virginia | |
Ohio | |
| Ireland | |
Oregon | |
| Singapore | Sydney | ||
| Tokyo | Seoul | ||
| Mumbai | London | ||
| Germany |
If your Amazon Cost and Usage billing reports currently reside in an S3 bucket that is not in any of the Regions listed above then you will need to create a new Cost & Usage Report and specify a bucket that is in one of the Regions listed above. Please follow the instructions in the “Launching the CloudFormation Template that Build Your Serverless Environment” section above to create your report.
Upon clicking on one of the buttons listed above, you will be taken to the Amazon CloudFormation console. The page should resemble the below image. Simply select the “Next” button to get started.
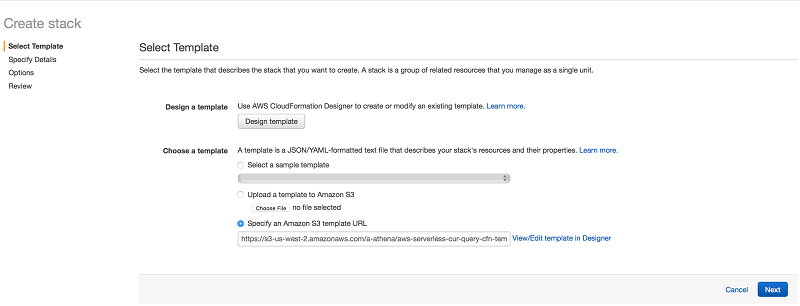
Upon selecting next, a page resembling the following image should be displayed:

The “Parameter” section has five text box that will need to be filled out. The first text box with the label “CostnUsageReport” requires that you enter the name of your Cost and Usage report.
The next two text box with the label “NDJSONS3BucketName” and “S3BucketName” requires that you enter unique names that will be given to two new S3 bucket that will be created by this CloudFormation template. “S3BucketName” is used to store processed reports and “NDJSONS3BucketName” is used to store metadata for Amazon Athena.
The fourth text box is labeled “s3CURBucket”. CUR is the abbreviation for Cost and Usage report. You are required to enter the name of the bucket in which your current Cost & Usage reports are written by the Amazon Billing System.
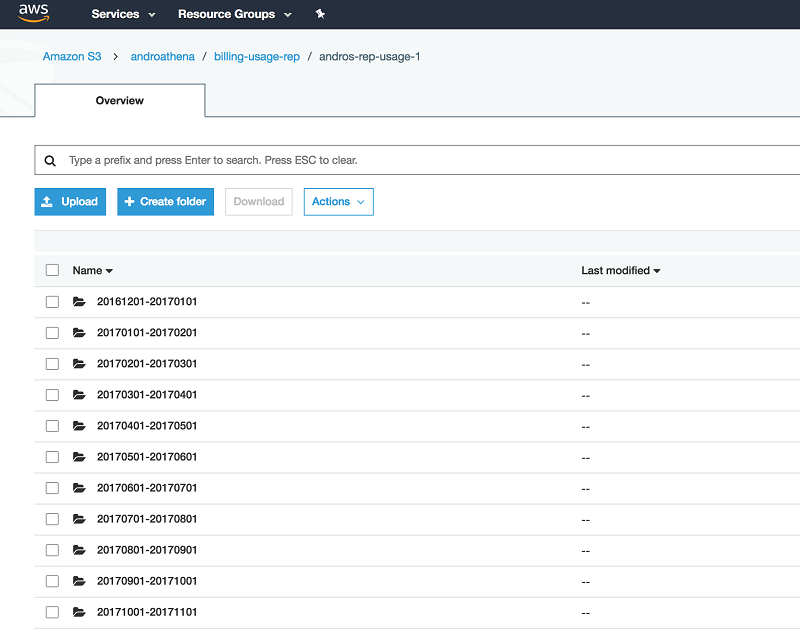
The fifth and final text box with the label “S3PrefixPath” requires that you enter any Amazon S3 prefix that appears after the bucket-name (for your S3 bucket that stores yours raw Cost and Usage reports) and before the S3 prefix that has the same name as your report. For example, in the below image, the name of my S3 bucket in which my raw reports are store is “androathena”, I created a prefix path, “billing-usage-rep”, and AWS created another prefix for me with the name I gave my Cost and Usage Reports when I created them in the billing console. Therefore, in the fifth text box, I would simply enter billing-usage-rep (with no slash at the end).
Follow the instructions in the CloudFormation wizard, using the following options, and then choose Create.
- For CostnUsageReport, type the name of your AWS Cost and Usage report.
- For S3BucketName, type a unique name to be given to a new S3 bucket.
- For s3CURBucket, type the name of the bucket in which your current reports are written.
While your stack is building, a page similar to the following is displayed.
When the Status column shows CREATE_COMPLETE, you have successfully created four new Lambda functions and a S3 bucket in which your transformed bills will be stored. The first time your Lambda functions run, two folders appear in the S3 bucket:
- year=current_year
Stores the transformed report. - aws-athena-query-results
Stores the results of the SQL queries that you run in Athena.
Adding a Lambda trigger
After you have successfully built your CloudFormation stack, you create a Lambda trigger that points to the new S3 bucket. I recommend keeping this bucket dedicated to storing AWS Cost and Usage reports.
This trigger can be created by following the steps below.
- Open the Lambda console.
- Choose Functions, and select the “aws-cost-n-usage-main-lambda-fn-A” Lambda function (don’t choose the check box beside it).
- Choose Trigger, Add trigger. There should not be any existing triggers.
- For Trigger type (the box with dotted lines), choose S3.
- Select the S3 bucket in which your Cost and Usage Reports are stored. For Event type, choose Object Created (All) and check the Enable trigger Choose Submit.
Resources built, trigger created… now what?
Before moving on, I recommend checking to see that all the solution components were created.
In the Lambda console, check that the following five functions were created:
- aws-cost-n-usage-S3-lambda-fn-B
- aws-cost-n-usage-main-lambda-fn-A
- aws-cost-n-usage-S3-lambda-fn-B-2
- aws-cost-n-usage-Athena-lambda-fn-C
- aws-cost-n-usage-Athena-lambda-fn-C-2
In the S3 console, check that the bucket was created.
Your database and table are not created until your function runs for the first time. Afterward, Athena holds your database and table.
After your Athena database and table are created, you can begin running your SQL queries. Athena uses Presto with ANSI SQL support and works with a variety of standard data formats. Start by running queries against your sanitized AWS Cost and Usage report dataset.
If you choose the eye icon beside any table name in the left navigation pane, Athena executes a SELECT * FROM [table_name] limit 10; query against your entire dataset. Or you can run the following query:
Executing this query converts the LineItem_UsageStartDate and LineItem_UsageEndDate values to UTC date format. It also returns a list of On-Demand Instances with a LineItem_Operation value of RunInstances or BoxUsage. The count column provides the results of a sum of RunInstances or BoxUsage requests on the specific instance type to the left.
The results are similar to the following screenshot:
You can run far more complex queries than those listed earlier. Another thing to know is, Athena stores query results in S3 automatically. Each query that you run has a results file in CSV format (*.csv) and a metadata file (*.csv.metadata) that includes header information such as column type, etc. If necessary, you can access the result files to work with them.
This solution creates a path in the S3 bucket, with a prefix path of “aws-athena-query-results”.
Testing
If you have successfully built this solution and added the trigger to the S3 bucket in which the Billing and Cost Management service writes your AWS Cost and Usage reports, then it might be time to conduct a simple test.
Remember, this solution processes the current and previous month billing data and it does it by using the master metadata file. This file acts as a map that tells you where the latest reports are stored.
- In the S3 path to which AWS writes your AWS Cost and Usage Billing reports, open the folder with your billing reports. There will be either a set of folders or a single folder with a date range naming format.

- Open the folder with the data range for the current month. In this folder, there is a metadata file that can be found at the bottom of the folder. It has a JSON extension and holds the S3 key for the latest report.
- Download the metadata file. Ensure that the name of the file on your machine is the same as the version stored on your S3 bucket.
- Upload the metadata file to the same S3 path from which you downloaded it. This triggers the Lambda function “aws-cost-n-usage-main-lmbda-fn-A”.
- In the S3 bucket that you created to hold your transform files, choose the “year=” folder and then the “month=” folder that corresponds to the current month. You should see the transformed file there, with the time stamp that indicated that it was just written.
How does the solution actually work?
The Billing and Cost Management service writes your latest report to a hashed folder inside your date range folder, as shown earlier. Each time the billing system writes your latest report, it writes it to a new hashed folder, leaving the previous report behind. The result is several hashed folders, each holding a historical view of your AWS Cost and Usage data. This is all noise, redundant data.
So that you can know where the latest data lives, AWS writes a master metadata file that contains the S3 keys and hashed folder for the latest report. This solution uses that master metadata file to ensure that the latest report is being processed, which helps sift through the multiple historical versions.
This is how the solution works. When a new report is written to the S3 bucket that is designated to store your report, S3 does a pull request for your main Lambda function. This function checks the key to ensure that it is indeed the master metadata file. If it is, then the main Lambda function decides whether the report being processed is for the current or previous month.
If it matches either, the main Lambda function calls functions B or B-2. Lambda function B processes the current month’s report, while B2 processes the previous month’s report. Separating the operation into multiple functions allows the solution to process a virtually unlimited number of reports at the same time. This is especially important when dealing with multiple reports that are gigabytes in size. The parallelization of this operation helps to overcome the time constraint of Lambda.
Lambda functions B and B2 stream your report, GUnzip each chunk of data, and remove unwanted rows that may cause an exception to be thrown when you execute a SQL query in Athena against this data. They then leverage the multipart upload capability of S3 to write the unzipped version of your file to the new S3 bucket that stores your transformed report.
During this event, Lambda function C creates your Athena database (IF NOT EXISTS) and uses the column title row in your report to create an Athena table.
Amazon QuickSight visualizations
After you have successfully built your Athena database, you have the option to integrate it with Amazon QuickSight, a BI tool/ fast business analytics service that allows you to build visualizations, perform ad hoc analysis, and quickly get business insights from your data. It seamlessly discovers AWS data sources, including but not limited to S3, Athena, Amazon Redshift, and Amazon RDS. Amazon QuickSight provides tools and filters that gives you the ability to dive deep into your dataset and pull out the data that satisfies your use case.
In this section, I walk through how to connect Amazon QuickSight to your Athena database and table to re-create the example visualization for your very own. If you are new to Amazon QuickSight, sign up for free at https://quicksight.aws.
In the following screenshot, Amazon QuickSight has been used to create several visualizations that provide the monthly total spend on AWS services, the daily spend, a monthly spend broken down by AWS service, and monthly spend by EC2 instance type. You have the ability to create visualizations like these and more.
To create reports like these, first specify how Amazon QuickSight should access your data by creating a dataset.
To get started, point Amazon QuickSight to your Athena database. Follow the steps in Creating a Data Set Using Amazon Athena Data. Type the name of your Athena database (aws_billing_report) and then the table (my_cur_report). To preview the data and apply additional transformations to your billing dataset, choose Edit/Preview data. Under tables, choose Switch to custom SQL tool, Query.
The AWS Cost and Usage report contains many columns, not all of which are necessary for your analysis and dashboard. Using a custom SQL query, you can choose which columns to use from within Amazon QuickSight. This is very useful, especially when working with Athena.
Athena uses Hive DDL to create tables, using a specified SerDe. This solution uses the OpenCSV SerDe, which means that all data returned by an Athena query is returned as “string”. The ability to run SQL queries in Amazon QuickSight before you create your visualizations provides the added advantage of converting/casting certain fields into the data type. The following SELECT statement is a perfect example, by casting bill_billingperiodstartdate from string to UTC timestamp, so that you can create a visualization that specifies a time period.
To start visualizing your billing data, choose Finish, Save, and Visualize.
Amazon QuickSight makes it easy for you to construct different views of your AWS Cost and Usage report. For example, you can create a KPI visualization that tracks the month-to-date spending, a time series chart of daily spend for the last two weeks, and a usage breakdown by service or features, all using the point-and-click UI. Within a few minutes, you can create a comprehensive dashboard of your AWS bill that you can use to keep track of your usage on a daily basis. You can also easily share the dashboard with others in your organization.
Conclusion
In this walkthrough, you successfully created a new S3 bucket and built a Lambda function (written in Node.js) to extract, transform, and write your billing report to an S3 folder structure that looks like a database partition to Athena. You also created a database and table in Athena. You are now ready to run standard ANSI SQL queries against your AWS Cost and Usage report billing data. You won’t see any data in your newly created S3 bucket until your Lambda function is triggered.
If you have questions or suggestions, please comment below.
About the Author
 Androski Spicer has been a Solution Architect with Amazon Web Services the past two and half years. He works with customers to ensure that their environments are architected for success and according to AWS best practices. In his free time he can be found cheering for Chelsea FC, Seattle Sounders, Portland Timbers or the Vancouver Whitecaps.