AWS Compute Blog
Simplifying serverless best practices with AWS Lambda Powertools for TypeScript
This blog post is written by Sara Gerion, Senior Solutions Architect.
Development teams must have a shared understanding of the workloads they own and their expected behaviors to deliver business value fast and with confidence. The AWS Well-Architected Framework and its Serverless Lens provide architectural best practices for designing and operating reliable, secure, efficient, and cost-effective systems in the AWS Cloud.
Developers should design and configure their workloads to emit information about their internal state and current status. This allows engineering teams to ask arbitrary questions about the health of their systems at any time. For example, emitting metrics, logs, and traces with useful contextual information enables situational awareness and allows developers to filter and select only what they need.
Following such practices reduces the number of bugs, accelerates remediation, and speeds up the application lifecycle into production. They can help mitigate deployment risks, offer more accurate production-readiness assessments and enable more informed decisions to deploy systems and changes.
AWS Lambda Powertools for TypeScript
AWS Lambda Powertools provides a suite of utilities for AWS Lambda functions to ease the adoption of serverless best practices. The AWS Hero Yan Cui’s initial implementation of DAZN Lambda Powertools inspired this idea.
Following the community’s adoption of AWS Lambda Powertools for Python and AWS Lambda Powertools for Java, we are excited to announce the general availability of the AWS Lambda Powertools for TypeScript.
AWS Lambda Powertools for TypeScript provides a suite of utilities for Node.js runtimes, which you can use in both JavaScript and TypeScript code bases. The library follows a modular approach similar to the AWS SDK v3 for JavaScript. Each utility is installed as standalone NPM package.
Today, the library is ready for production use with three observability features: distributed tracing (Tracer), structured logging (Logger), and asynchronous business and application metrics (Metrics).
You can instrument your code with Powertools in three different ways:
- Manually. It provides the most granular control. It’s the most verbose approach, with the added benefit of no additional dependency and no refactoring to TypeScript Classes.
- Middy middleware. It is the best choice if your existing code base relies on the Middy middleware engine. Powertools offers compatible Middy middleware to make this integration seamless.
- Method decorator. Use TypeScript method decorators if you prefer writing your business logic using TypeScript Classes. If you aren’t using Classes, this requires the most significant refactoring.
The examples in this blog post use the Middy approach. To follow the examples, ensure that middy is installed:
npm i @middy/coreLogger
Logger provides an opinionated logger with output structured as JSON. Its key features include:
- Capturing key fields from the Lambda context, cold starts, and structure logging output as JSON.
- Logging Lambda invocation events when instructed (disabled by default).
- Printing all the logs only for a percentage of invocations via log sampling (disabled by default).
- Appending additional keys to structured logs at any point in time.
- Providing a custom log formatter (Bring Your Own Formatter) to output logs in a structure compatible with your organization’s Logging RFC.
To install, run:
npm install @aws-lambda-powertools/loggerUsage example:
import { Logger, injectLambdaContext } from '@aws-lambda-powertools/logger';
 import middy from '@middy/core';

 const logger = new Logger({
    logLevel: 'INFO',
    serviceName: 'shopping-cart-api',
});

 const lambdaHandler = async (): Promise<void> => {
     logger.info('This is an INFO log with some context');
 };

 export const handler = middy(lambdaHandler)
     .use(injectLambdaContext(logger));
In Amazon CloudWatch, the structured log emitted by your application looks like:
{
     "cold_start": true,
     "function_arn": "arn:aws:lambda:eu-west-1:123456789012:function:shopping-cart-api-lambda-prod-eu-west-1",
     "function_memory_size": 128,
     "function_request_id": "c6af9ac6-7b61-11e6-9a41-93e812345678",
     "function_name": "shopping-cart-api-lambda-prod-eu-west-1",
     "level": "INFO",
     "message": "This is an INFO log with some context",
     "service": "shopping-cart-api",
     "timestamp": "2021-12-12T21:21:08.921Z",
     "xray_trace_id": "abcdef123456abcdef123456abcdef123456"
 }
Logs generated by Powertools can also be ingested and analyzed by any third-party SaaS vendor that supports JSON.
Tracer
Tracer is an opinionated thin wrapper for AWS X-Ray SDK for Node.js.
Its key features include:
- Auto-capturing cold start and service name as annotations, and responses or full exceptions as metadata.
- Automatically tracing HTTP(S) clients and generating segments for each request.
- Supporting tracing functions via decorators, middleware, and manual instrumentation.
- Supporting tracing AWS SDK v2 and v3 via AWS X-Ray SDK for Node.js.
- Auto-disable tracing when not running in the Lambda environment.
To install, run:
npm install @aws-lambda-powertools/tracerUsage example:
import { Tracer, captureLambdaHandler } from '@aws-lambda-powertools/tracer';
 import middy from '@middy/core';

 const tracer = new Tracer({
    serviceName: 'shopping-cart-api'
});

 const lambdaHandler = async (): Promise<void> => {
     /* ... Something happens ... */
 };

 export const handler = middy(lambdaHandler)
     .use(captureLambdaHandler(tracer));
AWS X-Ray segments and subsegments emitted by Powertools

Example service map generated with Powertools
Metrics
Metrics create custom metrics asynchronously by logging metrics to standard output following the Amazon CloudWatch Embedded Metric Format (EMF). These metrics can be visualized through CloudWatch dashboards or used to trigger alerts.
Its key features include:
- Aggregating up to 100 metrics using a single CloudWatch EMF object (large JSON blob).
- Validating your metrics against common metric definitions mistakes (for example, metric unit, values, max dimensions, max metrics).
- Metrics are created asynchronously by the CloudWatch service. You do not need any custom stacks, and there is no impact to Lambda function latency.
- Creating a one-off metric with different dimensions.
To install, run:
npm install @aws-lambda-powertools/metricsUsage example:
import { Metrics, MetricUnits, logMetrics } from '@aws-lambda-powertools/metrics';
 import middy from '@middy/core';

 const metrics = new Metrics({
    namespace: 'serverlessAirline',
    serviceName: 'orders'
});

 const lambdaHandler = async (): Promise<void> => {
     metrics.addMetric('successfulBooking', MetricUnits.Count, 1);
 };

 export const handler = middy(lambdaHandler)
     .use(logMetrics(metrics));
In CloudWatch, the custom metric emitted by your application looks like:
{
     "successfulBooking": 1.0,
     "_aws": {
     "Timestamp": 1592234975665,
     "CloudWatchMetrics": [
         {
         "Namespace": "serverlessAirline",
         "Dimensions": [
             [
             "service"
             ]
         ],
         "Metrics": [
             {
             "Name": "successfulBooking",
             "Unit": "Count"
             }
         ]
     },
     "service": "orders"
 }
Serverless TypeScript demo application
The Serverless TypeScript Demo shows how to use Lambda Powertools for TypeScript. You can find instructions on how to deploy and load test this application in the repository.

Serverless TypeScript Demo architecture
The code for the Get Products Lambda function shows how to use the utilities. The function is instrumented with Logger, Metrics and Tracer to emit observability data.
// blob/main/src/api/get-products.ts
import { APIGatewayProxyEvent, APIGatewayProxyResult} from "aws-lambda";
import { DynamoDbStore } from "../store/dynamodb/dynamodb-store";
import { ProductStore } from "../store/product-store";
import { logger, tracer, metrics } from "../powertools/utilities"
import middy from "@middy/core";
import { captureLambdaHandler } from '@aws-lambda-powertools/tracer';
import { injectLambdaContext } from '@aws-lambda-powertools/logger';
import { logMetrics, MetricUnits } from '@aws-lambda-powertools/metrics';

const store: ProductStore = new DynamoDbStore();
const lambdaHandler = async (event: APIGatewayProxyEvent): Promise<APIGatewayProxyResult> => {

  logger.appendKeys({
    resource_path: event.requestContext.resourcePath
  });

  try {
    const result = await store.getProducts();

    logger.info('Products retrieved', { details: { products: result } });
    metrics.addMetric('productsRetrieved', MetricUnits.Count, 1);

    return {
      statusCode: 200,
      headers: { "content-type": "application/json" },
      body: `{"products":${JSON.stringify(result)}}`,
    };
  } catch (error) {
      logger.error('Unexpected error occurred while trying to retrieve products', error as Error);

      return {
        statusCode: 500,
        headers: { "content-type": "application/json" },
        body: JSON.stringify(error),
      };
  }
};

const handler = middy(lambdaHandler)
    .use(captureLambdaHandler(tracer))
    .use(logMetrics(metrics, { captureColdStartMetric: true }))
    .use(injectLambdaContext(logger, { clearState: true, logEvent: true }));

export {
  handler
};
The Logger utility adds useful context to the application logs. Structuring your logs as JSON allows you to search on your structured data using Amazon CloudWatch Logs Insights. This allows you to filter out the information you don’t need.
For example, use the following query to search for any errors for the serverless-typescript-demo service.
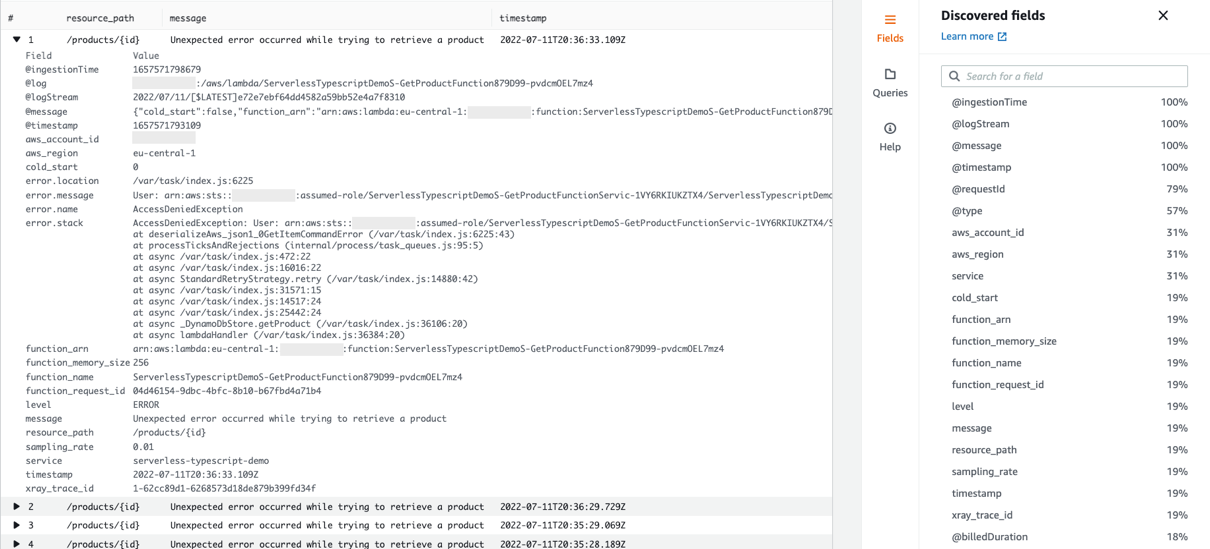
CloudWatch Logs Insights showing errors for the serverless-typescript-demo service.
The Tracer utility adds custom annotations and metadata during the function invocation, which it sends to AWS X-Ray. Annotations allow you to search for and filter traces by business or application contextual information such as product ID, or cold start.
You can see the duration of the putProduct method and the ColdStart and Service annotations attached to the Lambda handler function.

putProduct trace view
The Metrics utility simplifies the creation of complex high-cardinality application data. Including structured data along with your metrics allows you to search or perform additional analysis when needed.
In this example, you can see how many times per second a product is created, deleted, or queried. You could configure alarms based on the metrics.
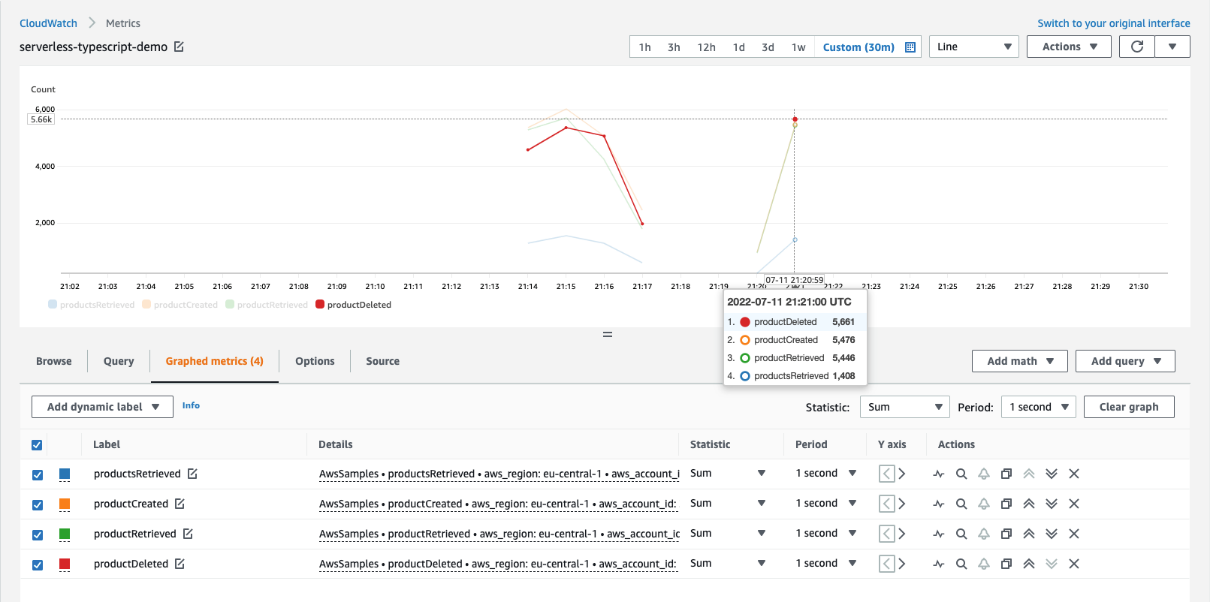
Metrics view
Code examples
You can use Powertools with many Infrastructure as Code or deployment tools. The project contains source code and supporting files for serverless applications that you can deploy with the AWS Cloud Development Kit (AWS CDK) or AWS Serverless Application Model (AWS SAM).
The AWS CDK lets you build reliable and scalable applications in the cloud with the expressive power of a programming language, including TypeScript. The AWS SAM CLI is that makes it easier to create and manage serverless applications.
You can use the sample applications provided in the GitHub repository to understand how to use the library quickly and experiment in your own AWS environment.
Conclusion
AWS Lambda Powertools for TypeScript can help simplify, accelerate, and scale the adoption of serverless best practices within your team and across your organization.
The library implements best practices recommended as part of the AWS Well-Architected Framework, without you needing to write much custom code.
Since the library relieves the operational burden needed to implement these functionalities, you can focus on the features that matter the most, shortening the Software Development Life Cycle and reducing the Time To Market.
The library helps both individual developers and engineering teams to standardize their organizational best practices. Utilities are designed to be incrementally adoptable for customers at any stage of their serverless journey, from startup to enterprise.
To get started with AWS Lambda Powertools for TypeScript, see the official documentation. For more serverless learning resources, visit Serverless Land.