AWS Open Source Blog
Introducing Heapothesys, an open source Java GC latency benchmark with predictable allocation rates
The Amazon Corretto team introduces the open source Heapothesys benchmark, a synthetic workload that simulates fundamental application characteristics that affect garbage collector (GC) latency. The benchmark creates and tests GC load scenarios defined by object allocation rates, heap occupancy, and JVM flags, then reports the resulting JVM pauses. OpenJDK developers can thus produce reference points to investigate capability boundaries of the technologies they are implementing.
We are working on enhancing Heapothesys to better model and predict additional application behaviors (issue-12), for example, sharing available CPU power with the application, fragmentation effects, more dynamic and varied object demographics, and operating system scheduling symptoms. We would love to collaborate on where we go from here. We track ideas in our issue list.
The application behavior that Heapothesys currently simulates is narrowly specialized in its own way, but it is also intentionally minimalistic to provide boundary cases for what to expect. We aim to gain a rough idea of how different collector implementations perform when certain basic stress factors are dialed up and the collector’s leeway to act shrinks. With cautious optimism, this setup can shine light on garbage collector choices and tuning options for application load projections and latency expectations.
Heapothesys focuses on these two primary factors that are directly responsible for collector stress by increasing the urgency with which it has to act and thus play an important role when investigating GC behavior:
- The Java heap object allocation rate. Controlled by the Heapothesys command-line parameter
-a (<allocation rate in MB per second, default: 1024). - The Java heap occupancy (i.e., the total size of live objects, as determined by object graph scanning during GC). A predetermined amount of persistent live objects can be set by the Heapothesys command-line parameter
-h (<heap occupancy in MB, default: 64).
Understanding the results
The graph below shows pause time data from a series of Heapothesys test runs using a range of the two parameters. We measured JVM pauses using jHiccup for different workload configurations. The vertical scale, representing milliseconds of pause time, is logarithmic. Note that pause times increase with heap occupancy (the horizontal axis) and with allocation rate (the blue, gray, and orange lines).

The graph shows that the eventual effect of approaching a nearly full heap is longer pauses. Each garbage collection algorithm will expose different characteristics, and Heapothesys helps us study and understand these behaviors. Here we also see non-linear reactions to high allocation rates for the measured collector.
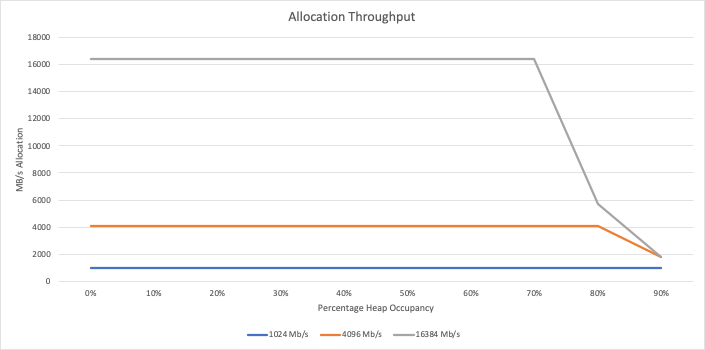
When large allocation rates are requested, the JVM may not be able to fully deliver on those requests, especially when running concurrent garbage collectors at high heap occupancy. Therefore, at the end of each run, Heapothesys prints out the actual allocation rate that it managed to achieve, so we can see at what points the JVM was unable to keep up with the requested allocation rate. For a particular JVM configuration, the chart below shows that real allocation throughput starts to drop at 80% heap occupancy with a 16 GB/s allocation rate, and at 90% for 4 GB/s.
Acknowledgements
Heapothesys, while written from scratch, inherits its basic ideas from Gil Tene’s HeapFragger workload. HeapFragger has additional features (e.g., inducing fragmentation and detecting generational promotion), whereas Heapothesys concentrates on accurately predicting the resulting allocation rate. We would like to thank Gil for his work on HeapFragger as well as his jHiccup agent, which we use to measure JVM pauses.
License
Heapothesys is under the Apache 2.0 License. We appreciate your pull requests, bug reports, suggestions, and feedback at https://github.com/corretto/heapothesys.