Generative BI
Amazon Q in QuickSight enhances business productivity using Generative BI capabilities to accelerate decision-making. With new dashboard authoring capabilities in Amazon Q, business analysts can use natural language prompts to build, discover, and share meaningful insights in seconds. Amazon Q makes it easier for business users to understand data with executive summaries, a new context-aware data Q&A experience, and customizable, interactive data stories.
Reduce time to insights
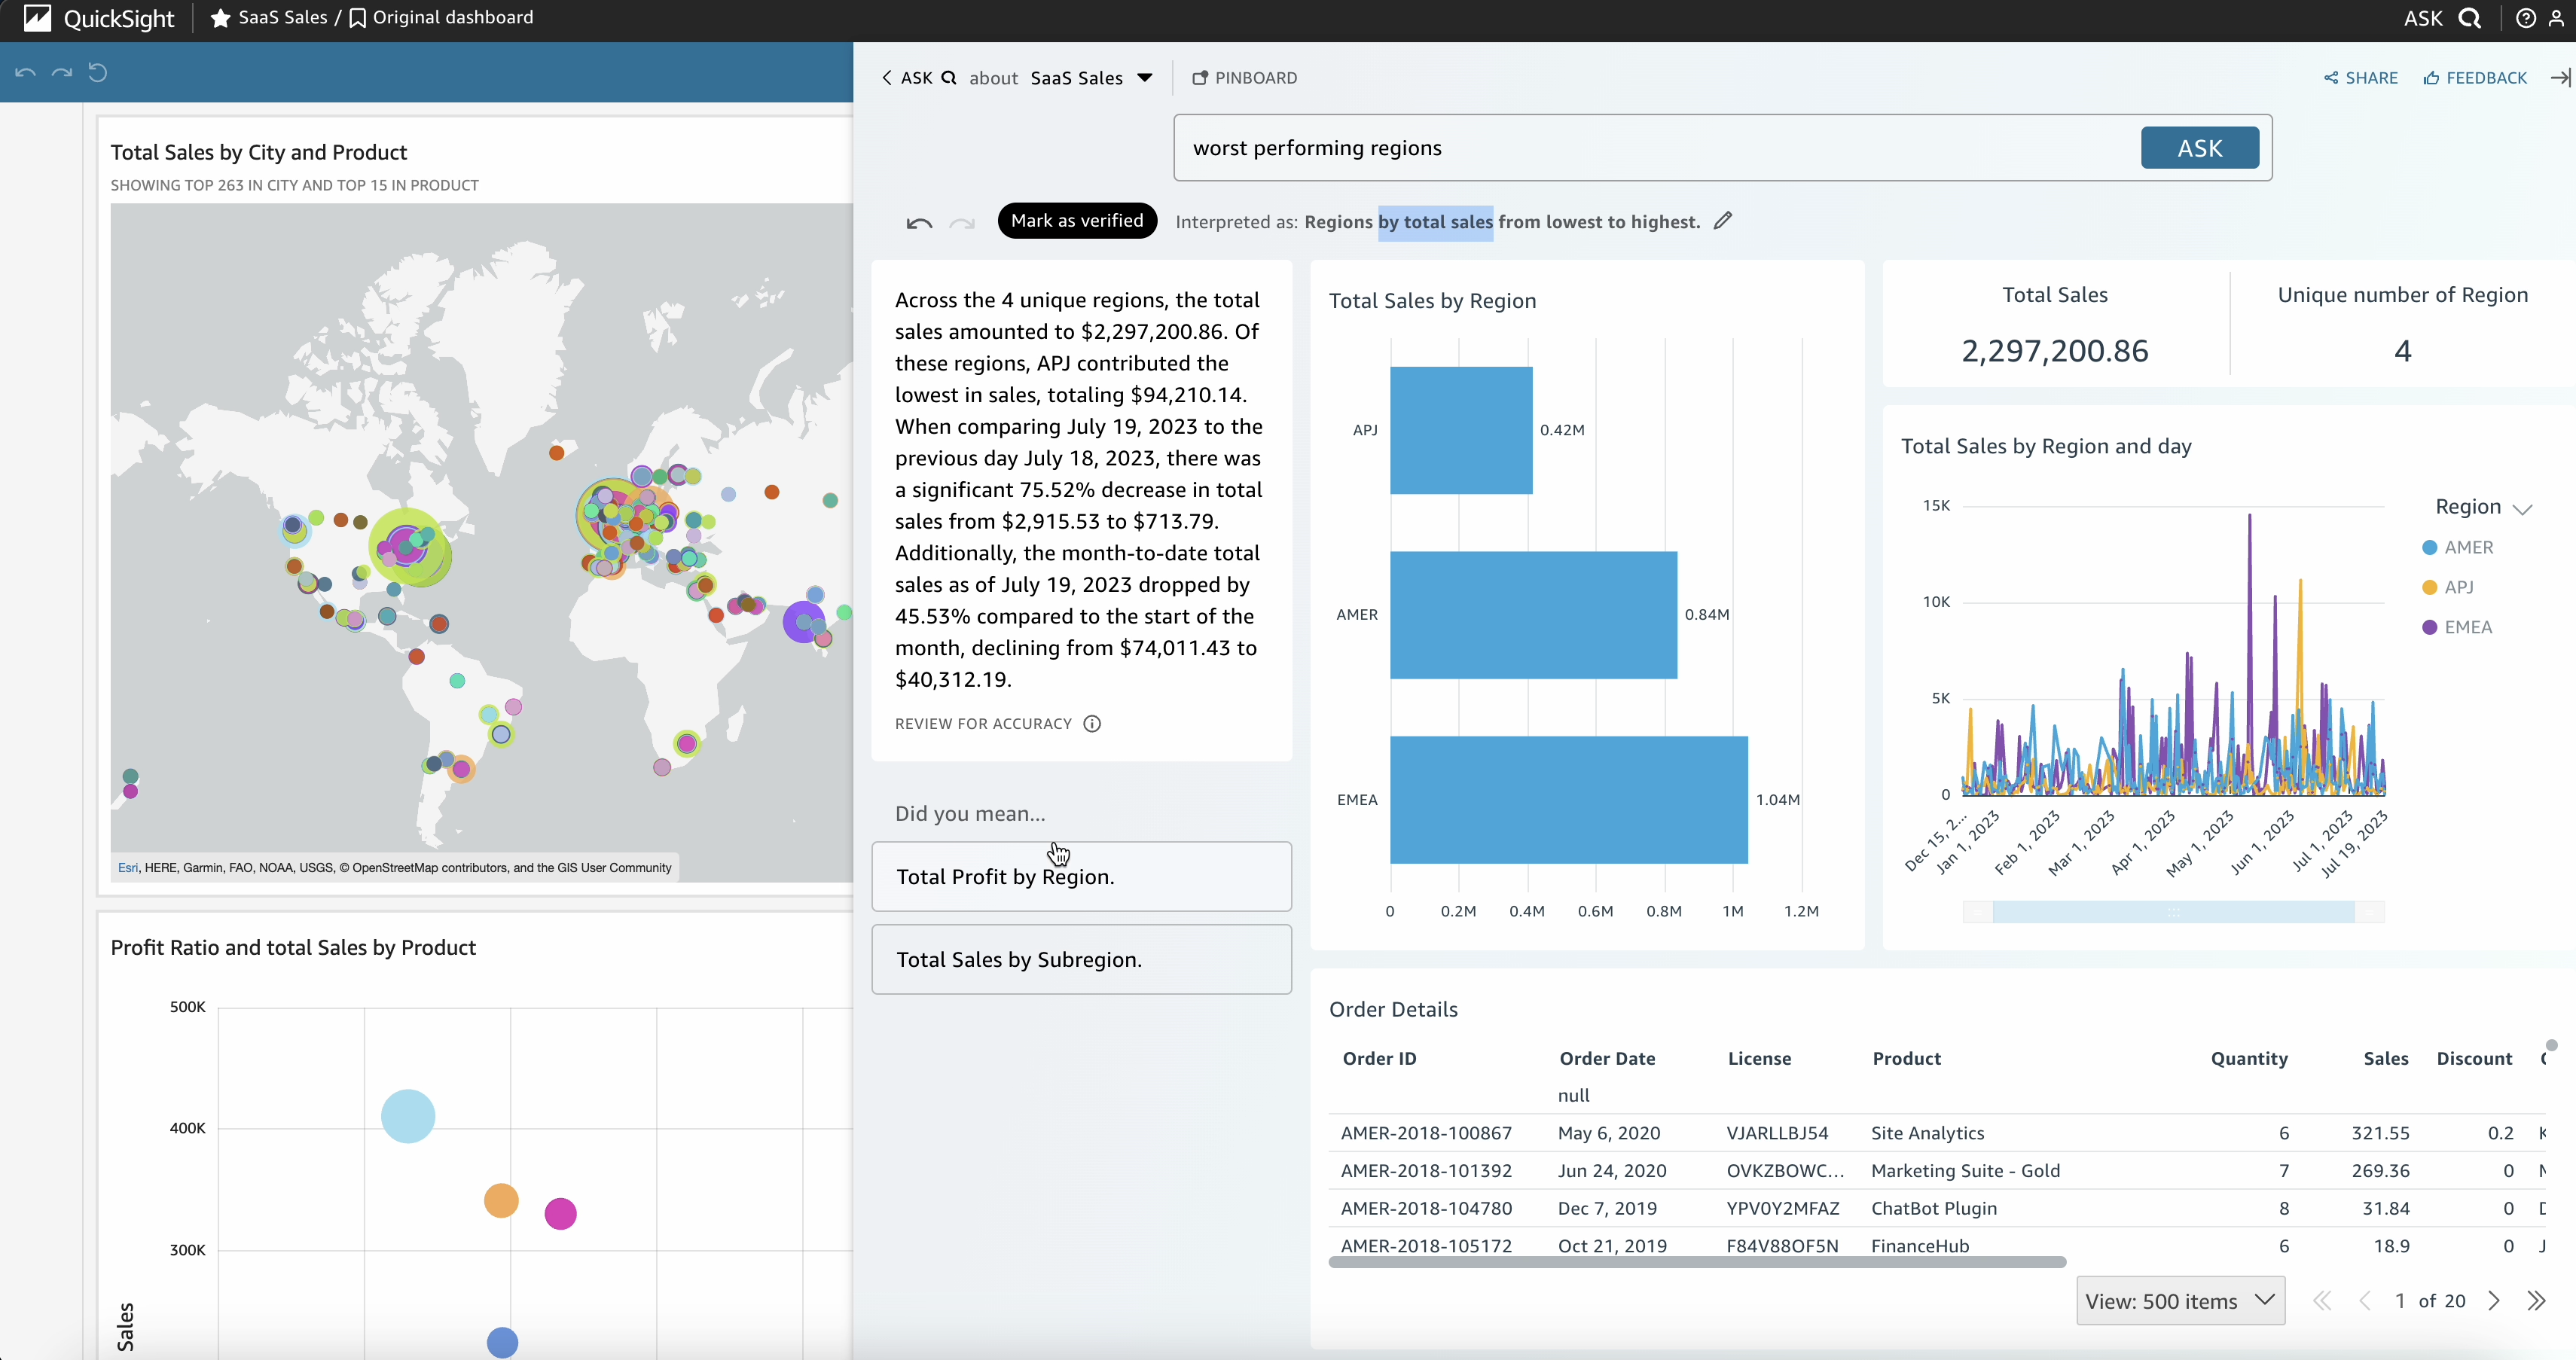
With Generative BI capabilities of Amazon Q in QuickSight, BI users can build, discover, and share actionable insights and narratives in seconds using intuitive natural language experiences.
Analysts can quickly build visuals and calculations and refine visuals using natural language. Business users can self-serve data and insights using natural language.
Users no longer have to wait for BI teams to update the data and dashboards for every new question. Users can self-serve with natural language querying, automated contextual summaries, and generated narratives.

Security and privacy
We built Amazon Q with security and privacy in mind. It can understand and respect your existing governance identities, roles, and permissions and use this information to personalize its interactions. If a user doesn't have permission to access certain data without Amazon Q, they can't access it using Amazon Q either. We have designed Amazon Q in QuickSight to meet the most stringent enterprise requirements from day one—none of your data or Amazon Q inputs and outputs are used to improve underlying models of Amazon Q for anyone but you.

BI for everyone
Amazon Q in QuickSight makes it simple for everyone to confidently understand data better.
Business users can self-serve meaningful insights with ease. Even if they ask vague questions in natural language, they will receive comprehensive and contextual answers that explain the data completely using visuals and narratives.
Business users can quickly generate visually pleasing, compelling narratives that are contextual, call attention to key insights, and make recommendations.