AWS Partner Network (APN) Blog
How Thundra Decreased Data Processing Pipeline Delay By 3x on Average and 6x on P99
By Serkan Özal, CTO at Thundra and AWS Serverless HERO
 |
| Thundra |
 |
As Amazon Web Services (AWS) CTO Werner Vogels says, “Everything fails all the time.” This is true not just for applications and networks, but also for data stores.
How should you design your system to recover from a data store disaster with minimum time, effort, and data lost?
Consider how complicated it can be to maintain a robust, scalable, and reliable monitoring system that inputs terabytes of data in an hour under heavy traffic. By nature, monitoring applications must be kept up and running continually, as they are primarily responsible for maintaining the health of your applications.
As a serverless monitoring vendor and AWS Advanced Technology Partner with the AWS DevOps Competency, Thundra has frequently faced these types of challenges. Our engineering team took advantage of several AWS services and managed to guarantee availability, disaster recovery, and no data loss in our services for over two years now.
In this post, I will share how Thundra has delivered 99.9 percent availability to customers since the AWS services have been incorporated into our product. I will dive deep into how we designed our platform to:
- Handle scalability and availability challenges.
- Recover both from partial failures and major outages.
- Support point-in-time recovery in case of disaster.
By taking advantage of the newest AWS service improvements without custom implementation, we were able to drastically improve our data processing pipeline performance.
Telemetry Data Ingestion Pipeline
Let’s take a look at Thundra’s data collection application (shown in Figure 1 below), where we designed a data pipeline to handle the telemetry data flow for data processing and storing collected by Thundra’s agents.

Figure 1 – Thundra telemetry data ingestion pipeline.
1. Collecting Telemetry Data
By default, Thundra’s agent collects and sends telemetry data to Thundra’s collector API endpoint at the end of the AWS Lambda function invocation, which is monitored by Thundra.
We have edge collectors in different AWS regions, so the agent uses the regional collector to reduce the network Round Trip Time (RTT) for sending collected telemetry data.
2. Ingesting Telemetry Data
Thundra’s collector API authorizes and validates requests, and then sends the received data to the Amazon Kinesis Data Stream (thundra-telemetry-stream) to be processed asynchronously.
On the “happy path,” this works perfectly, but sometimes data may not be able to be ingested into the Kinesis Data Stream due to reasons, such as:
- Throughput exceeded error: Even though we distribute data randomly between shards, there may be spikes in the incoming traffic.
- Amazon Kinesis service unavailable: Even though AWS services have almost perfect SLAs, they still don’t reach 100 percent, meaning that very rarely data may be returned with HTTP status code 503.
As a failover strategy, Thundra uses Amazon Simple Queue Service (SQS) to route collected data as a fallback to Amazon Kinesis, due to the fact that SQS is almost unlimited in practice and has one of the best SLAs among all AWS services.
So, if sending data to the Kinesis Data Stream (thundra-telemetry-stream) fails, telemetry data is instead sent to the SQS queue (thundra-telemetry-queue) to be processed. Then, another Lambda function (thundra-telemetry-redriver) consumes the SQS queue and tries to ingest data to the Data Stream.
If it fails, the data becomes visible after visibility timeout in the SQS queue, and it’s retried again until it’s successfully ingested to the Data Stream without any data loss.
At this point, you might wonder why we don’t just use SQS directly and avoid using Amazon Kinesis for ingesting telemetry data. The main motivation behind this approach is that Kinesis and Lambda integration has a larger batch size support (up to 10K number of batch size) than SQS and Lambda integration (max 10 number of batch size).
The larger batch size means we have the capability to:
- Process more data at once in a single invocation of the
thundra-telemetry-processorfunction. - Save more data to Amazon OpenSearch Service (successor to Amazon Elasticsearch Service) in a single PUT request, as bulk requests yield much better performance than single-document index requests.
The tricky part, however, is that you need to find the optimum batch size for your system because after some point, increasing batch size may have a negative impact on the indexing performance of OpenSearch.
3. Processing Telemetry Data
The next phase of the telemetry data processing pipeline occurs after data is ingested to the Kinesis Data Stream. At this point, there are two independent and parallel consumers of the stream.
3.1. Saving Telemetry Data
The first consumer is the thundra-telemetry-processor Lambda function, which processes and saves data to the OpenSearch cluster.
As shown in the Figure 1 above, the Kinesis Data Stream thundra-telemetry-stream can be fed by both the collector directly and by the Lambda function thundra-telemetry-redriver.
It’s possible the same telemetry data can be received from both sources. A possible scenario is that:
- A batch of telemetry data is ingested into the Kinesis Data Stream
thundra-telemetry-streamby thePutRecordsoperation. - Some (not all) of the records in the batch might fail, which can be detected by the
FailedRecordCountproperty in the response. - As it’s not possible to distinguish which of the records failed, the entire batch is also sent to
thundra-telemetry-queue, and afterward it will be forwarded tothundra-telemetry-streamby thethundra-telemetry-redriverfunction. - So, it’s likely to inject the same telemetry data twice to
thundra-telemetry-streamby both a partially failed operation on the collector’s side and a successful operation on thethundra-telemetry-redriverfunction’s side.
How to Detect and Skip Already Processed Data
Even though processing and saving the same telemetry data is not a problem for our pipeline, as it’s designed to be idempotent, we still try to detect and skip already processed data with a best effort solution.
Our solution is very simple—we use an in-memory cache in the thundra-telemetry-processor function. Telemetry data is partitioned by its id, which means that even though it’s injected into the stream multiple times, it will always be put into the same shard and processed by the same Lambda function container instance at any time.
Of course, the Lambda container instance might be destroyed at any time for any particular shard and a new instance may begin to consume that shard with an empty cache. Here, we could use a global/remote Elasticache/Redis like we already use elsewhere, but we want to keep the solution as simple as possible and 100 percent accuracy has not been a goal for us in this context.
Our cache usage to detect multiple occurrences of the same data is very simple, as shown in the following pseudocode:
However, there are still issues we need to handle:
- The problem is that there Is no limit for the size of the cache
processedRecords. It might grow infinitely (until you get an “out of memory” error) in instances. That means there should be an upper limit for the size of the cache. In our case, we limit the cache size to 10M items. - The other issue is determining what to do when the cache is full. Here, we follow a very common approach: eviction. When the cache size limit (set 100 in our configuration) is reached, we delete older data as a batch.
With the help of the in-memory cache to track processed records, we are able to skip already-processed data and get rid of unnecessary CPU and IO bounded operations for the thundra-telemetry-processor function and the thundra-telemetry-es OpenSearch cluster.
How to Isolate Failing Records
When everything is running correctly (telemetry data is valid, our code is bug-free, and the OpenSearch cluster is healthy), this works like a charm. However, in the real world, things don’t go smoothly and we can run into the following problems:
- Even though we check the incoming telemetry data, if there’s a blind spot in our validation logic, we might accept invalid data and let it continue through the processing pipeline.
- Since we don’t have the leverage of GPT-3 :) while coding (and because we are human), we can produce buggy code.
Should one of these problems occur, the processor function in the pipeline might fail while handling the telemetry data consumed from the Kinesis Data Stream.
Due to the nature of the Kinesis and Lambda integration, the Lambda function in an affected shard will be triggered with the same batch of data until it’s consumed successfully, which will block the remaining data in the shard.
The real problem here is that if the error is not temporary (for example, data is invalid or there is a bug in our code), it will fail again and again at the next subsequent triggers, and the rest of the telemetry data in the shard will not be able to be processed.
Fortunately, just before AWS re:Invent 2019, AWS announced some new features (“Bisect on Function Error”, “Maximum Retry Attempts”, and “Destination on Failure”) for the Lambda and Kinesis integration to overcome such issues in the processing pipeline and prevent a block by a problematic record.
The “Bisect on Function Error” configuration splits the batch into two parts when a failure occurs and retries each part separately. This isolates the problematic record in the whole batch and allows the rest to be processed successfully.
With the “Maximum Retry Attempts” configuration, a problematic batch of records is retried until the maximum limit is reached (which in our case is 10 since we configure batch size to 1000, and 2^10=1024 is the minimum batch limit that fits our needs) without indefinitely blocking the remaining records in the shard.
Using the “Destination on Failure” configuration, we set the SQS queue (thundra-telemetry-dlq) as the destination to which failing records’ metadata (stream ARN, shard ID, and sequence numbers – but not the record data itself) will be sent.
This makes it possible for us to re-process them later by retrieving the metadata of the un-processed data from the queue, allowing us to access the actual records from the stream and then re-ingest them into the stream to be re-processed.
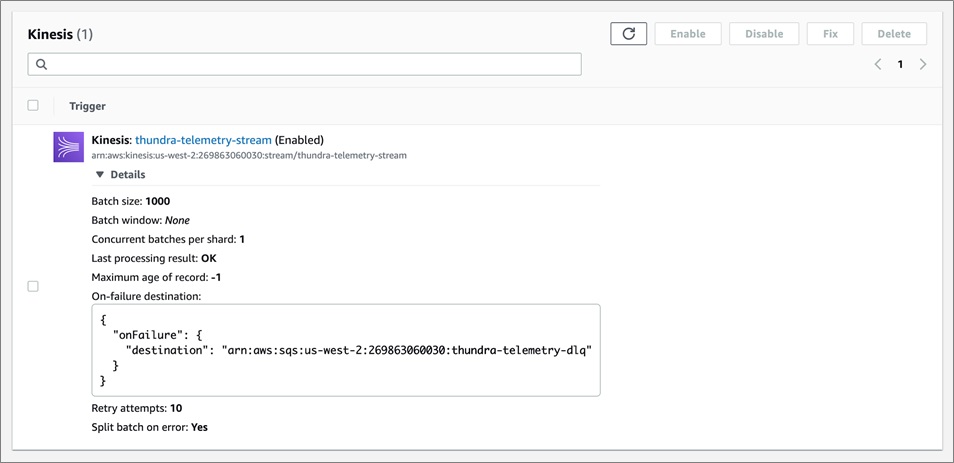
Figure 2 – Thundra telemetry stream processor configuration.
3.2. Backup Telemetry Data
Another consumer (reads and processes data from the stream) is the thundra-telemetry-deliverystream Amazon Kinesis Data Firehose delivery stream, which saves data to Amazon Simple Storage Service (Amazon S3) in a batch for backup, and for running queries by Amazon Athena and tasks by Amazon EMR for further analysis.
The interesting trick here is how we handle disasters that would occur with unrecoverable data lost on OpenSearch (for example, the index is accidentally deleted or shards are somehow lost with their backups).
In this case, we take advantage of OpenSearch’s hourly snapshots and incrementally take snapshots of data in the cluster. This helps prevent data loss, since data can be restored from snapshots.
Because snapshots are done on an hourly basis, however, ingested data since the latest hourly snapshot are lost. To overcome this issue and restore as much lost data as possible, we have the following procedures at Thundra:
- Restore all indexes (or only specific ones, depending on the disaster impact) from the snapshots until the last hourly snapshot.
- Use Amazon S3 Inventory and Batch operation support to get the backup telemetry data from the S3 bucket for the last hour. Then, ingest the retrieved backup data to the Kinesis Data Stream to be processed again.
Since we designed our system to be idempotent, in this flow it’s not a problem even if the same data is ingested multiple times by both snapshots and the S3 backup.
4. Reduce End-to-End Data Processing Pipeline Delays
At Thundra, we don’t just monitor our customers’ applications, we also monitor Thundra’s own architectures from different aspects.
The data processing pipeline is the backbone of our overall architecture, and its performance play an important role in reducing our customers’ Mean Time to Detect (MTTD) and Mean Time to Repair (MTTR).
Therefore, we can measure the delay between the time when data is received by our collector and when it’s successfully saved to OpenSearch.
The diagram in Figure 3 shows the average and P99 duration of processing pipeline delay metrics in milliseconds from the past (prior to the AWS improvements).

Figure 3 – AVG and P99 of processing delay metrics from the past.
Overall, while the average delay was about 4.4K milliseconds, the p99 delay was about 23.3K milliseconds. Additionally, as you can see, there were many outliers in the p99 values of the processing delay due to failing retries before data processing succeeded.
After the improvements we discussed earlier, we observed significant decreases in the processing delays.

Figure 4 – AVG and P99 of processing delay metrics after improvements.
As shown in Figure 4 above, which displays metrics after the improvements were made, overall the average delay is about 1.3K milliseconds and the p99 delay is about 3.9K milliseconds. Additionally, there are no notable spikes in the delays.
As a result of the optimizations, we decreased processing delay by 3x on average and 6x on p99. Isolating failing records and skipping already-processed records has greatly helped us to get rid of extra retries and complete data processing much more quickly.
Conclusion
In this post, I have presented a high-level view of Thundra’s telemetry data collecting and processing pipeline.
As a result of architectural optimizations, we not only enhanced our platform’s scalability and availability, we also improved the processing pipeline’s performance by a significant degree (3x to 6x). This enabled our customers to reduce their MTTD and MTTR by being aware of issues immediately and taking action quickly with Thundra’s help.
There may be other approaches (with other AWS services or even with custom implementations) which provide the same architectural benefits, but we want to emphasize the following points:
- There can always be failures and disasters. Your architecture should be ready for those cases in both theory and practice.
- AWS already provides many unique services and features out-of-the-box for you to build a resilient architecture. There’s no need to reinvent the wheel if you just check the AWS services and their features to see what’s available for you. Most of the time, there will be something to assist you.
If you want to detect performance bottlenecks and troubleshoot issues in your AWS Lambda functions more easily, we encourage you to take a look at the Thundra platform and see how we can help.
The content and opinions in this blog are those of the third-party author and AWS is not responsible for the content or accuracy of this post.
.

.
Thundra – AWS Partner Spotlight
Thundra is an AWS Competency Partner that provides deep performance and security insights into the distributed workflows of serverless-centric applications.
Contact Thundra | Solution Overview | AWS Marketplace
*Already worked with Thundra? Rate this Partner
*To review an AWS Partner, you must be a customer that has worked with them directly on a project.