AWS Database Blog
Capture and tune resource utilization metrics for Amazon RDS for SQL Server
Capturing database resource utilization helps you understand database workload characteristics and usage trends. This data acts as a reference point that can be compared with later measurements to identify and investigate performance issues. Deviations could potentially indicate an area of concern that requires performance tuning, database maintenance, or configuration changes.
Resource utilization typically captures metrics that have an impact on database performance, like the operating system and database usage, database wait events, and query processing times. Collecting this data periodically during the normal course of business can give you insights into the health of the database instance.
Amazon Relational Database Service (Amazon RDS) automatically sends metric data to Amazon CloudWatch in 1-minute periods. Data points with a period of 1 minute are available for 15 days. This means you have historical information of your instance that can serve as a starting point. You can use the metrics collected to understand at a high level the workload patterns of your applications that drive resource utilization of your database instance, such as CPU, memory, disk, network, and client connections.
Amazon RDS provides the following monitoring tools to help understand the resource utilization of your RDS instance:
In this post, we demonstrate how to capture and tune resource utilization metrics in Amazon RDS for SQL Server.
Amazon RDS Enhanced Monitoring
Enhanced Monitoring provides metrics in real time for the operating system that your DB instance runs on. These metrics can be as granular as 1 second and can be accessed via the Amazon RDS console or API. Enhanced monitoring gathers its metrics from an agent on the DB instance, whereas CloudWatch collects the metrics at the hypervisor layer. For more information, click the following link on Enhanced Monitoring.
You may be wondering about how long you want to capture performance metrics. Ideally, you want to capture enough information during important cycles, such as peak business hours, normal operations, and periodic events like monthly jobs processing. Enhanced Monitoring metrics are stored by default for 30 days in CloudWatch logs, but you can extend this period.
The following are some key metrics:
- CPU Utilization – Monitoring CPU utilization helps you identify if performance issues are caused by CPU pressure. For example, if you find CPU utilization to be 80% at the time of the performance issue and the same time last week CPU utilization was similar with no issues reported, it’s likely that CPU isn’t the bottleneck.
- Disk – You can track I/O and storage usage patterns using metrics like Read and Write IOPS to establish the trend. This can also help during storage capacity planning to choose from available volume types such as gp2 and io1 disks.
- Memory – A number of performance issues can be related to memory bottlenecks. With Enhanced Monitoring, you can track system (Total Memory and Available Memory) and SQL Server (SQL Server Total Memory) memory usage and patterns to identify bottlenecks.
- Network – Network performance metrics (Network Read Kb/s and Network Write Kb/s) collected by Enhanced Monitoring are useful to track the amount of data transferred via the network.
With these metrics, you can have a good indication of the resource’s utilization during important days and times of your business processes. These values can provide a holistic picture of resource utilization, which may come handy when a comparison is needed to identify potential bottlenecks.
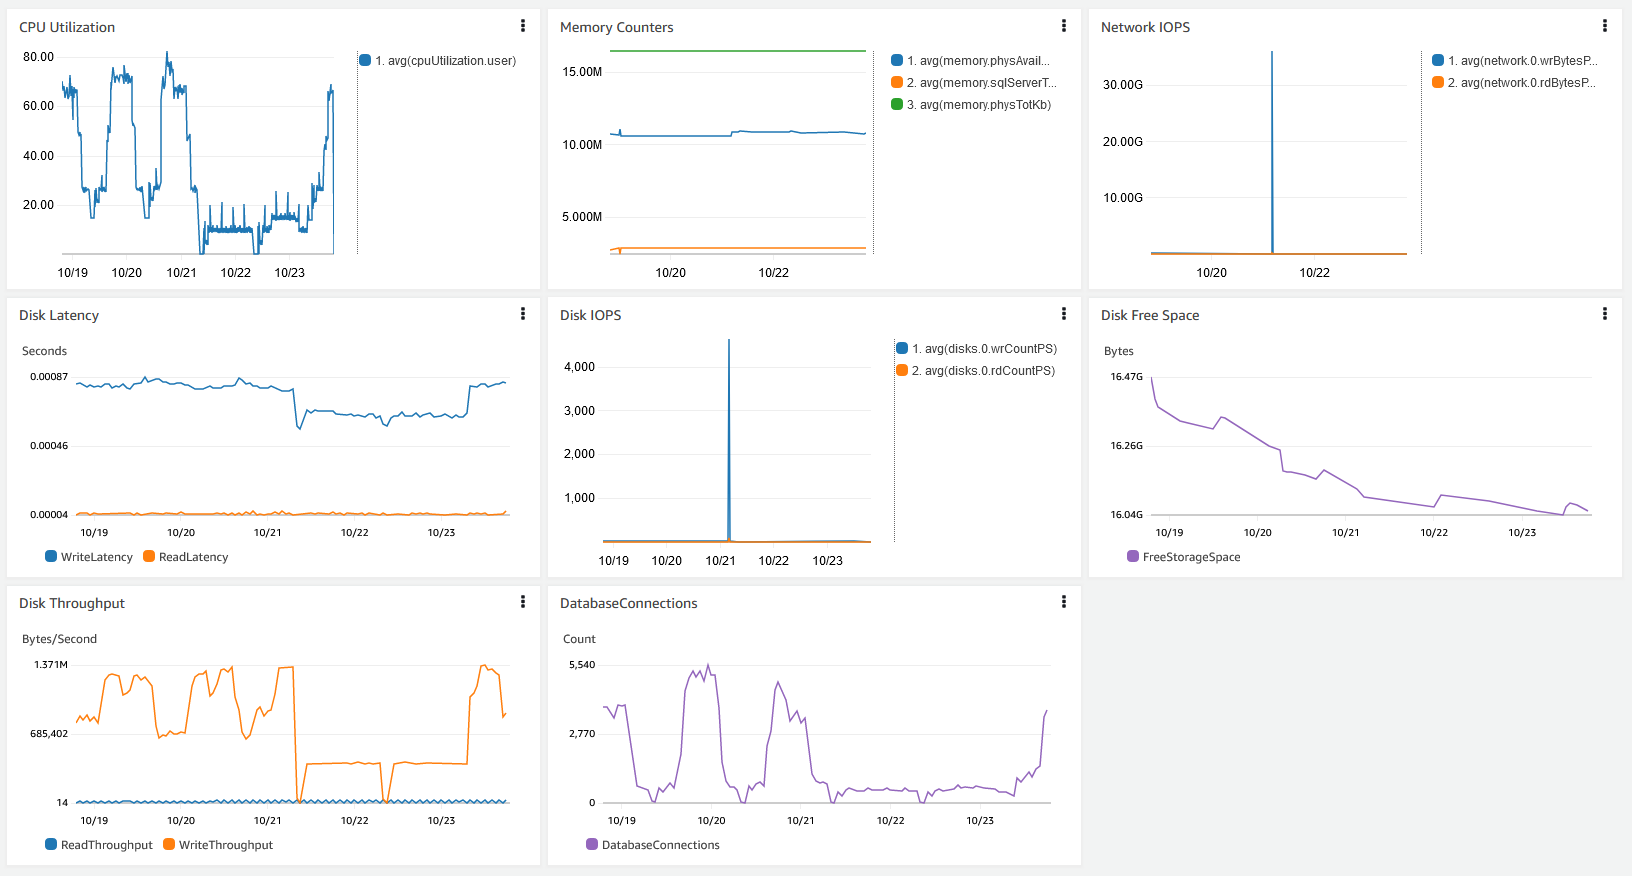
You can a create dashboard in CloudWatch to have a centralized view of these performance metrics discussed. The following screenshot shows a consolidated dashboard with data from CloudWatch and Enhanced Monitoring.
Amazon RDS Performance Insights
Performance Insights is a monitoring tool that provides insights into RDS database performance. The free tier of Performance Insights collects data every second from RDS databases to be retained for 7 days. For longer-term performance trends, you can increase the rolling performance data history up to two years. For each RDS database engine, Performance Insights displays slightly different information based on the engine’s native performance metrics. With Performance Insights, you can gather trends of database load, top wait types, and top SQL queries over a period of time. You can use this information to compare against the current data to isolate potential root causes.
Most SQL Server DBAs are familiar with Dynamic Management Views (DMVs) to diagnose and debug SQL Server issues. With DMVs, data is collected as is, and you need to develop mechanisms to understand utilization trends. This is where Performance Insights helps, by automating data collection and retention.
The following are some key metrics:
- Access Methods – Page Splits – This can potentially cause I/O bottlenecks and high numbers might be an indication that maintenance activity is required, such as an index rebuild and potentially revisiting the fill factor setting.
- Blocks and Locks – Lock contention can cause performance issues in SQL Server, and it’s important to track this information not only for trend analysis but to uncover SQLs that need to be tuned for the database to perform better. You can track Processes Blocked and Number of Deadlocks.
- Memory Manager – Memory Grants Pending can help track a memory bottleneck over a period of time.
- SQL Stats – There are various SQL statistics available in Performance Insights that help you understand tasks contributing to normal database load, like Batch Request, SQL Compilation, and SQL Re-Compilations.
- Buffer Manager – Page life expectancy and Buffer Cache Hit Ratio can help you detect memory pressure. Pages Read vs. Pages Writes can provide guidance on optimization paths, for example if indexing needs to be reviewed.
These metrics provide insights into SQL Server performance. You can dive deep into OS and database metrics, including performance metrics, to understand the root cause of the issue. The following screenshot shows an example of these metrics.

DMVs and Query Store
After you have identified an anomaly, you can use DMVs to dive deeper to debug the performance issues. For more information, refer to System Dynamic Management Views.
Starting with SQL Server 2016, Amazon RDS for SQL Server also supports Query Store, which you can use to track and manage query plans for SQL statements. For more information, refer to Amazon RDS for SQL Server now supports Microsoft SQL Server 2016.
Diagnosing and debugging issues: CPU utilization
Let’s walk through a common scenario where the application was performing optimally until yesterday, and is now experiencing degraded performance. In this use case, you learned about this either through a CloudWatch alert or from user complaints.
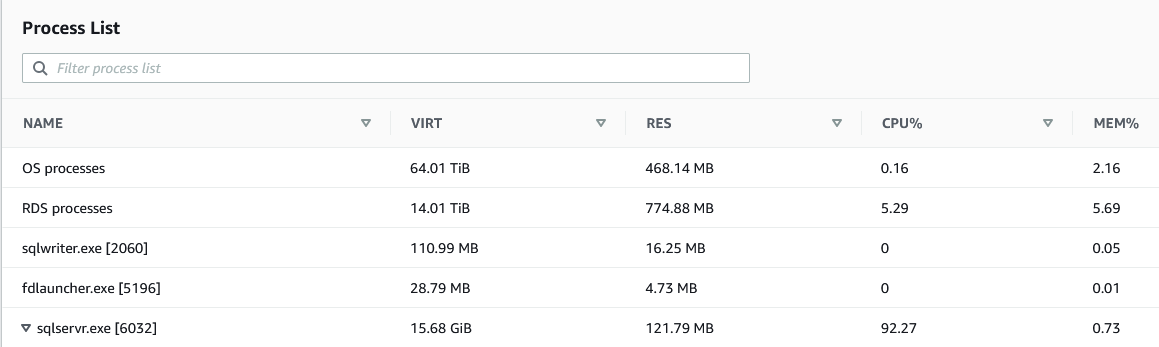
You start diagnosing the issue by investigating the metrics. With CloudWatch, you can see the CPU Utilization metric is high, perhaps over 90%. You want to know if the SQL Server process is contributing to the high percentage. You can do that through the Amazon RDS console, on the Monitoring tab, under Process List.
This is where tracking resource utilization of your RDS instance can help. With the data captured, it becomes efficient to identify trends of your CPU usage over time. With Enhanced Monitoring, you can chart the trend of your instance’s CPU usage for the past 30 days, which may tell you whether this is normal or not.
The next step is to use the data captured in Performance Insights to identify the queries that are contributing to the CPU load. The following screenshot shows a graph with data accumulated over time.
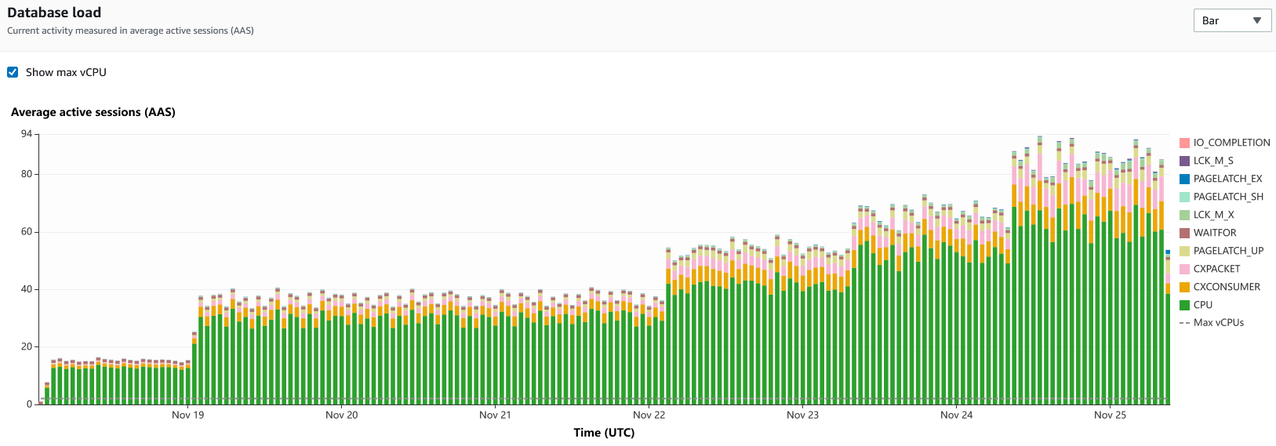
Based on the chart, we can see that CPU is the largest wait type on the instance, and it has grown over a period of time. The trend provides the data needed for capacity planning as well.
You can narrow down to the time of interest to see a list of top T-SQL queries by CPU utilization. You can obtain the run plans and more details about the queries from the DMV.
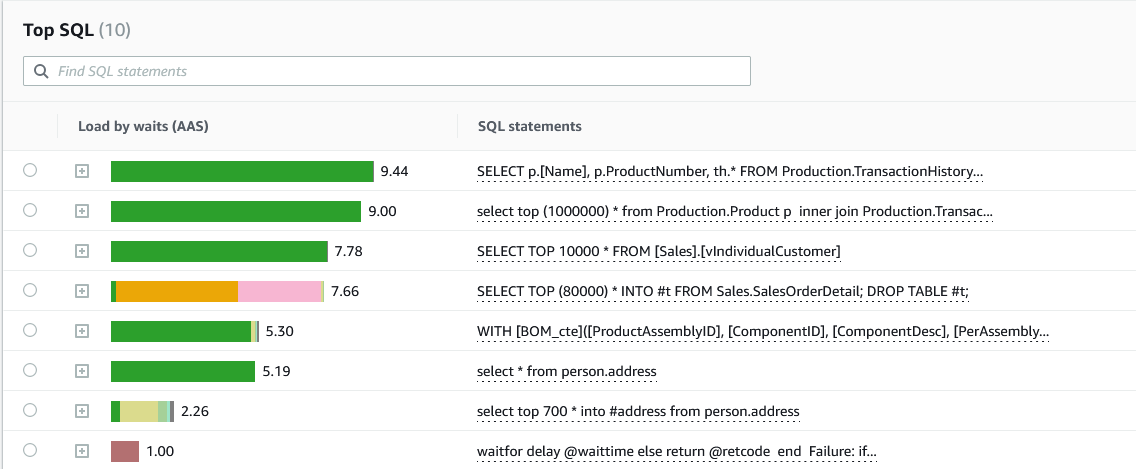
We managed to identify the top three queries that are contributing to the high CPU load. In addition to the queries itself, you can identify the top hosts and top users that are running the queries to further narrow down your troubleshooting efforts.
We use the first query as an example. To obtain the query run stats and run plan through SQL Server Management Studio (SSMS), you first need to know the query’s fingerprint. You can get that information from Performance Insights.

The SQL ID is the value that you feed to the DMVs to obtain the stats and run plan. You need to prefix the SQL ID with 0x, as shown in the following screenshot.
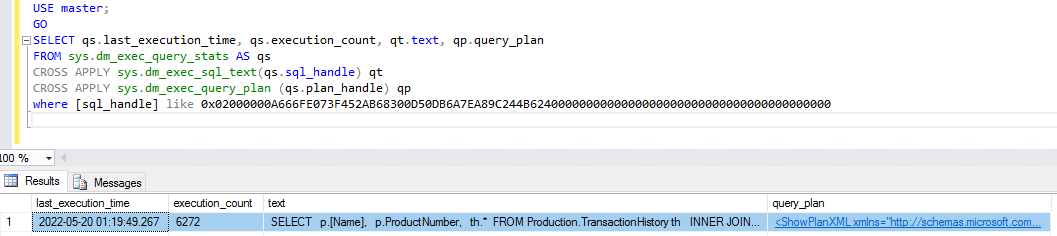
After you have the query plan, your next step is to optimize the query using known query optimization methods.
Conclusion
In this post, we learned about Enhanced Monitoring and Performance Insights for Amazon RDS for SQL Server that provides you a great way to capture and analyze your instance health and usage patterns. Having this information helps you to optimize and troubleshoot performance issues. You can use the method in this post to help you improve the performance of your instance.
If you have any comments or questions, leave them in the comments section.
About the Authors
 Barry Ooi is a Senior Database Specialist Solution Architect at AWS. His expertise is in designing, building and implementing data platform using cloud native services for customers as part of their journey on AWS. His areas of interest includes data analytics and visualization. In his spare time, he loves music and outdoor activities.
 Rita Ladda is Microsoft Specialist Senior Solution Architect at Amazon Web Services with over 20 years of experience in many Microsoft Technologies. She specializes in designing database solutions in SQL Server and other databases. She provides architectural guidance to customers in migration and modernization of their Microsoft workloads to AWS.