AWS News Blog
Debug your Elastic MapReduce job flows in the AWS Management Console
We are excited to announce that weve added support for job flow debugging in the AWS Management Console making Elastic MapReduce even easier to use for developing large data processing and analytics applications. This capability allows customers to track progress and identify issues in the steps, jobs, tasks, or task attempts of their job flows. The job flow logs continued to be saved in Amazon S3 and now the state of tasks and task attempts is persisted in Amazon SimpleDB so customers can analyze their job flows even after theyve completed.
Very simple steps to start the debugging process:
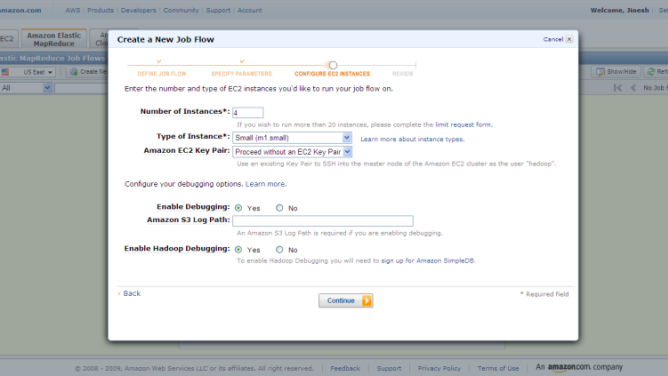
Step 0: Select “Enable Hadoop Debugging” in the Create New Job Flow wizard.
Step 1: Select the Job Flow and click on “Debug”
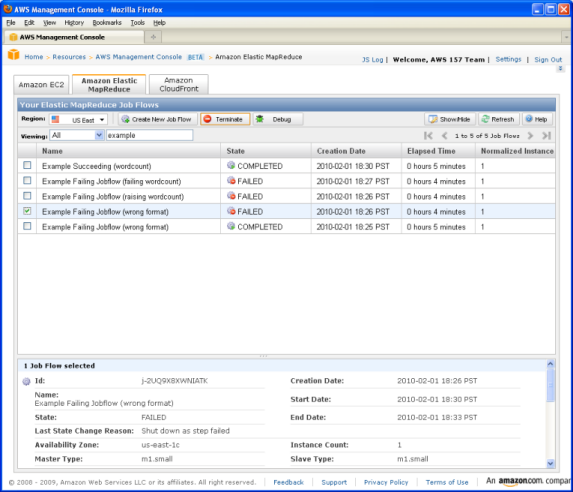
Step 2: Job Flow has one or more steps. You can view the log files of a specific step within your job flow.
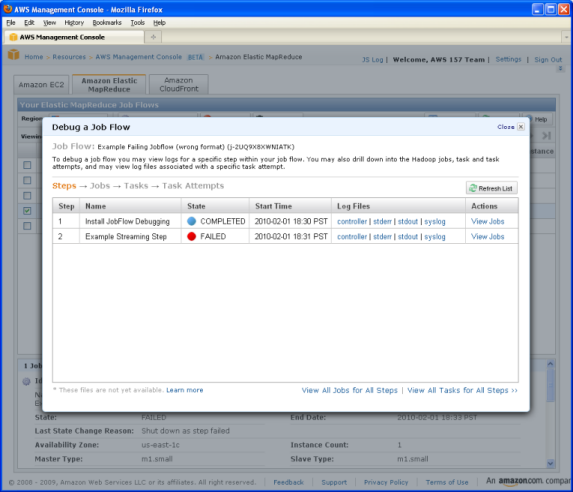
Step 3: Each step might have one or more Hadoop jobs. Click on “View Tasks” next to a job to drill down and see different Hadoop tasks within that job.
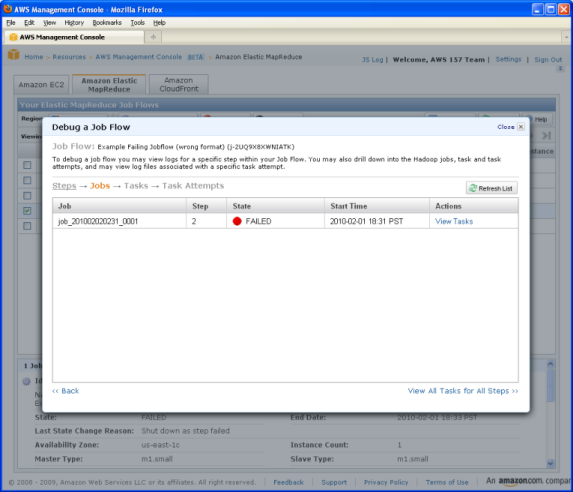
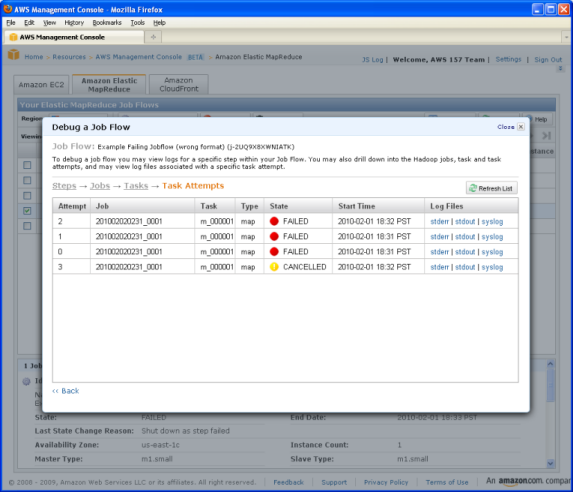
Step 4: You will a see the list of tasks that have failed. Click on task that you would like to debug and view the task attempts.
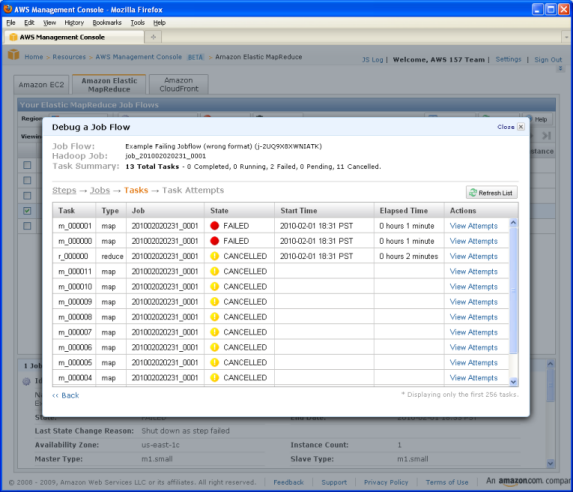
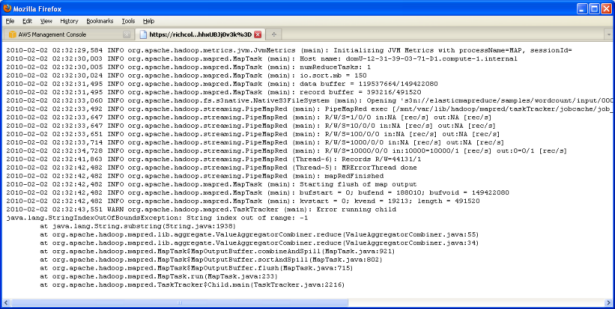
Step 5: You can click on a specific task attempt and see the log files associated with that particular task attempt
Step 6: Discover the error.
With just a few clicks in the AWS management console, you can find the error in your Elastic MapReduce job flows amongst thousands of jobs and restart the job flow again with a few clicks.
— Jinesh
