Containers
Building intelligent knowledge graphs for Amazon EKS operations using AWS DevOps Agent
Modern observability has evolved significantly with the emergence of AIOps, transforming how organizations monitor and maintain their cloud infrastructure. Today’s intelligent agents can seamlessly integrate with monitoring tools, knowledge bases, and ticketing systems to triage issues and propose mitigation steps with unprecedented speed. Despite these advances, reducing Mean Time to Identify (MTTI) and Mean Time to Resolve (MTTR) in complex microservices architectures remains a challenge. During a recent conversation with a customer running a sophisticated AIOps platform for Kubernetes operations, they expressed a familiar concern: while their tooling was powerful, identifying the true root cause of incidents was still remarkably difficult. Pod-to-pod communication creates a constantly shifting network topology that’s challenging to map and understand without relying on third-party providers or eBPF profiling. This adds operational overhead and complexity to an already demanding troubleshooting process.
This is where AWS DevOps Agent changes the game. It goes beyond collecting insights from telemetry signals to build intelligent knowledge graphs that map the intricate relationships between your Amazon Elastic Kubernetes Service (Amazon EKS) resources. AWS DevOps Agent acts as your always-on DevOps engineer, autonomously investigating incidents and identifying operational improvements by learning your resources and their relationships. It works with your existing observability tools, runbooks, code repositories, and continuous integration and delivery (CI/CD) pipelines, correlating telemetry, code, and deployment data to understand the true topology of your applications—whether they run in the cloud or hybrid environments. For Amazon EKS specifically, the agent goes beyond cluster-level visibility, developing a deep understanding of Kubernetes objects and their interdependencies, from Services to Pods. This enables it to traverse dependency chains and pinpoint the deepest impaired object that’s likely causing your incident.
In this post, we demonstrate how AWS DevOps Agent works—from alert generation to identifying the affected EKS cluster, building knowledge graphs, and troubleshooting application or infrastructure issues, ultimately reducing MTTI and MTTR for your Kubernetes operations.
Prerequisites
Complete the following prerequisites to continue with this post.
- The AWS Command Line Interface (AWS CLI) version 2. For installation instructions, see Installing or updating to the latest version of the AWS CLI.
- helm
- Kubectl
- An EKS cluster with Control plane logs enabled
- Install Load Balancer Controller
- AWS DevOps Agent Agentspace. For installation instructions, refer to Creating an Agent Space
Deploy a sample retail application
For the post, we use Containers Retail Store Sample Application. This is a purpose-built microservices application designed to demonstrate modern cloud architectures and container orchestration patterns. This application simulates a fully functional ecommerce platform with distributed components that showcase real-world operational challenges. The application consists of five microservices: UI Service, Catalog Service, Cart Service, Orders Service, Checkout Service. Each microservice is built with different technology stacks to represent heterogeneous production environments.
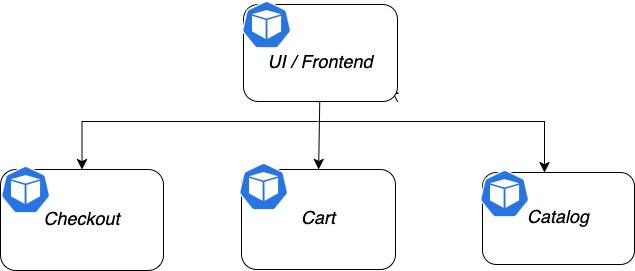
Figure 1. Components of the sample application.
Let’s go ahead and deploy this sample application in the EKS cluster that you have provisioned already:
Enabling AWS DevOps Agent access for Amazon EKS cluster
Now that we have the sample application deployed, let’s integrate this cluster with AWS DevOps Agent to do troubleshooting. You can enable AWS DevOps Agent to describe your Kubernetes cluster objects, retrieve pod logs and cluster events, for Amazon EKS clusters (only accessible with a VPC).The Agent Space must have access to the EKS cluster. To provide access, we must get the role of the Agent Space and use that role in the EKS console to add an access entry to the EKS cluster.
From the Agent Spaces, select the Agent Space that needs access to the Amazon EKS cluster and choose the View Details button to open the details of the Agent Space.
Open the Capabilities tab, and under the Cloud section, select the primary source and choose Edit. This will open the primary account source and note down the role shown in the Role Name field. This is the role that needs access to the Amazon EKS cluster.
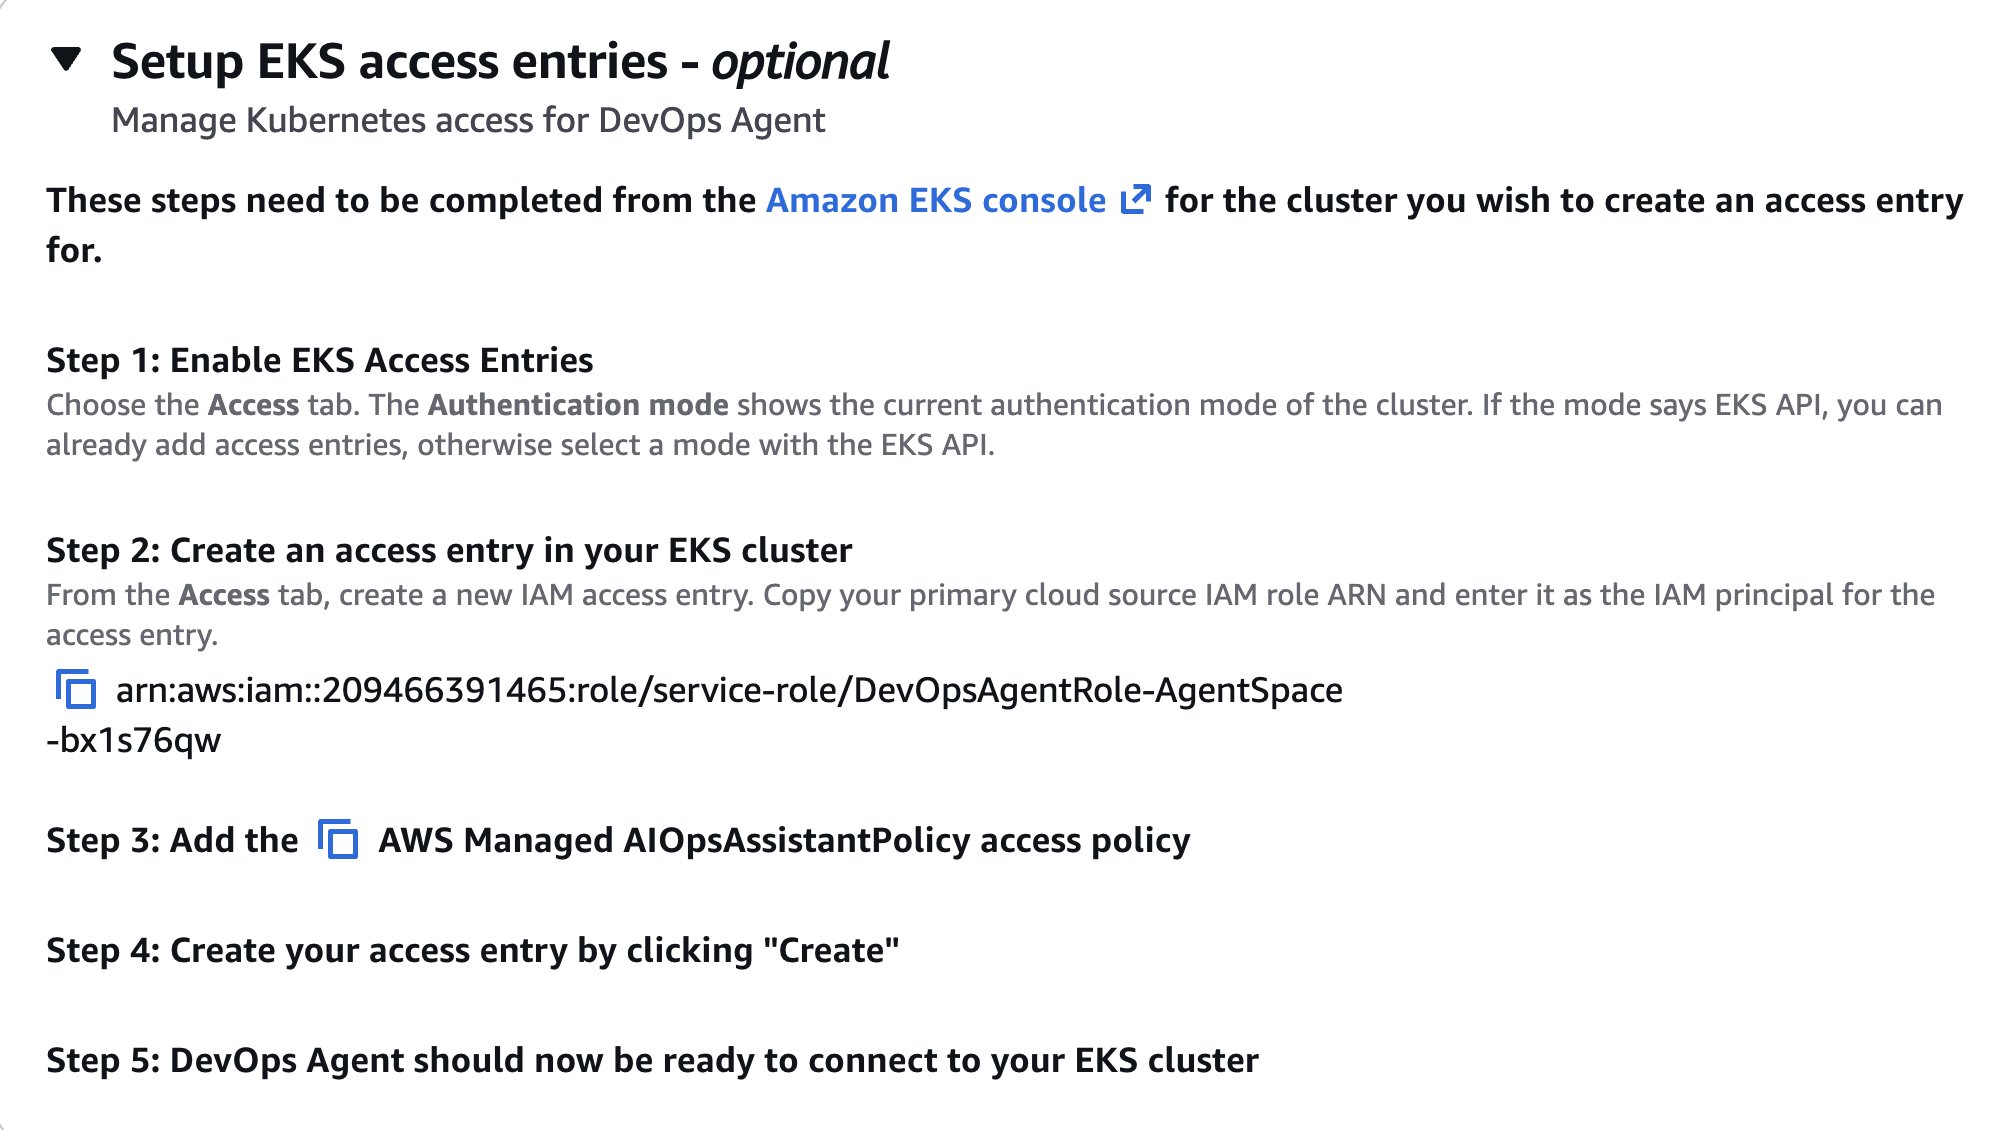
On the EKS console, select the cluster that you need to provide access to for the AWS DevOps agent and open the Access tab.
Under the IAM Access Entries list, choose the create button to create a new Access entry.
For the IAM Principal ARN, select the role from the Agent Space that was noted down from the previous section and choose Next.
Under Access Policies, select AmazonAIOpsAssistantPolicy and provide the access scope as Cluster. Then choose the Add Policy button to add the selected policy and choose the Next button.
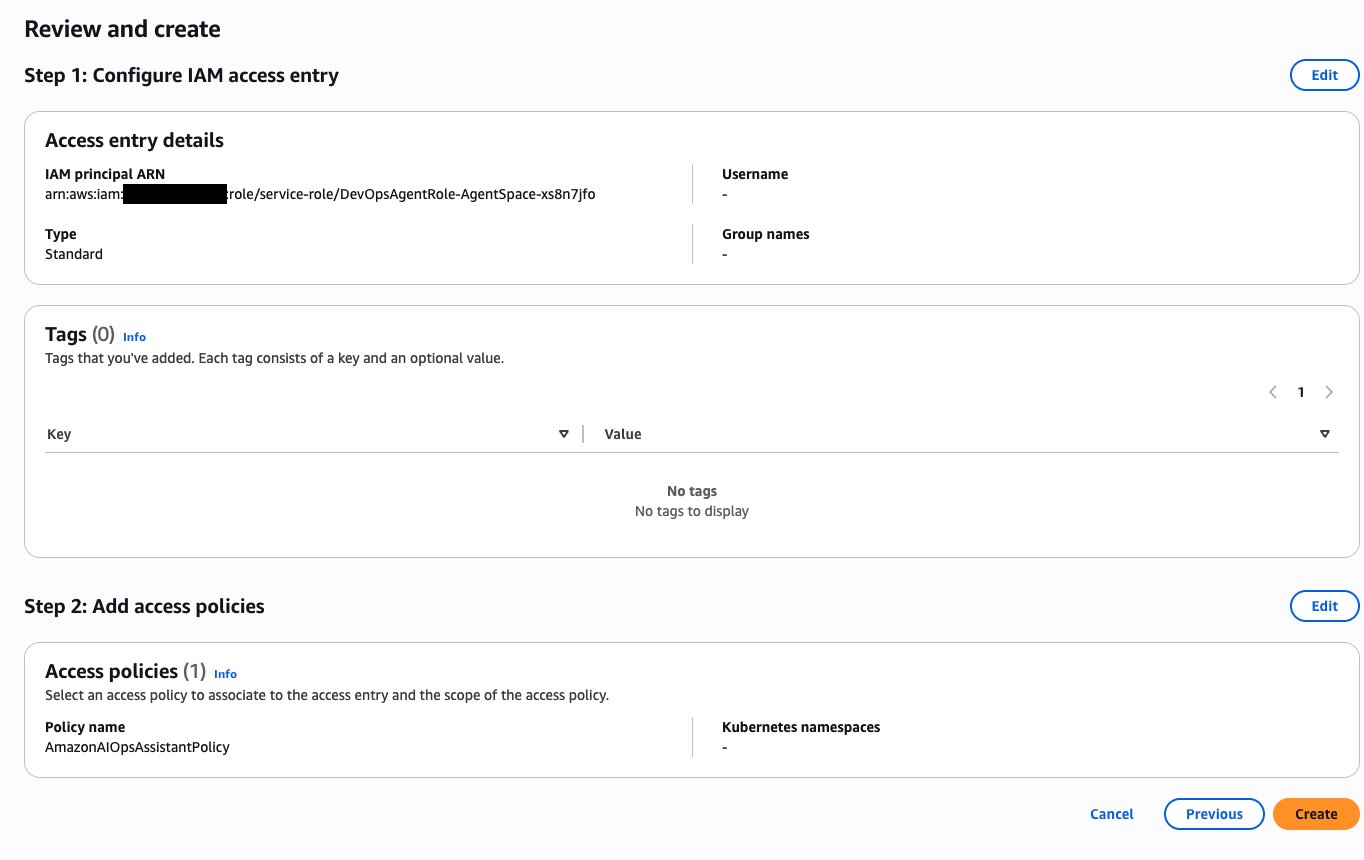
The Review and Create screen will show the following details. Select the Create button to add the access entry.
This completes the EKS cluster setup and this EKS entry provides the DevOps agent access to the cluster. In the environment where you have multiple clusters, you can use CLI, Terraform, or GitOps to create the access entries in the clusters.
After the access entry is added, the Kubernetes objects will be available for DevOps agent Topology Sources.
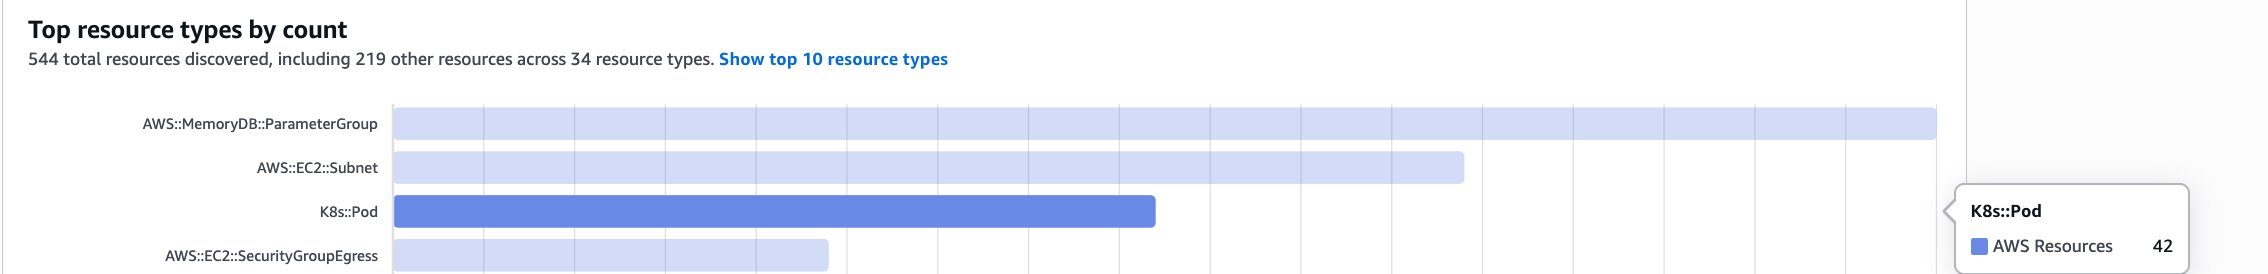
In addition to the overview of resources discovered, you can also see the service map diagram of various Kubernetes objects interacting across namespaces using the Learned Topology feature of AWS DevOps agent.
Learned topology is an automatically generated knowledge graph that maps entities and relationships in your application environment through resource discovery, relationship detection, code/deployment mapping, and observability behavior mapping, continuously evolving as the agent completes more tasks.
For visualizing EKS objects, follow the below steps:
1. Navigate to your Agent Space’s Operator access console and click the Topology tab.
2. Select your preferred view filter: Learned
3. Explore the interactive knowledge graph where nodes represents Kubernetes objects, lines show connections.

Now that we’ve covered how the DevOps Agent integrates with Amazon EKS and the powerful capabilities that it brings to cluster operations, let’s explore how this integration solves real-world challenges that platform teams face daily.
Scenario 1 – Troubleshoot Kubernetes application availability issue with DevOps Agent
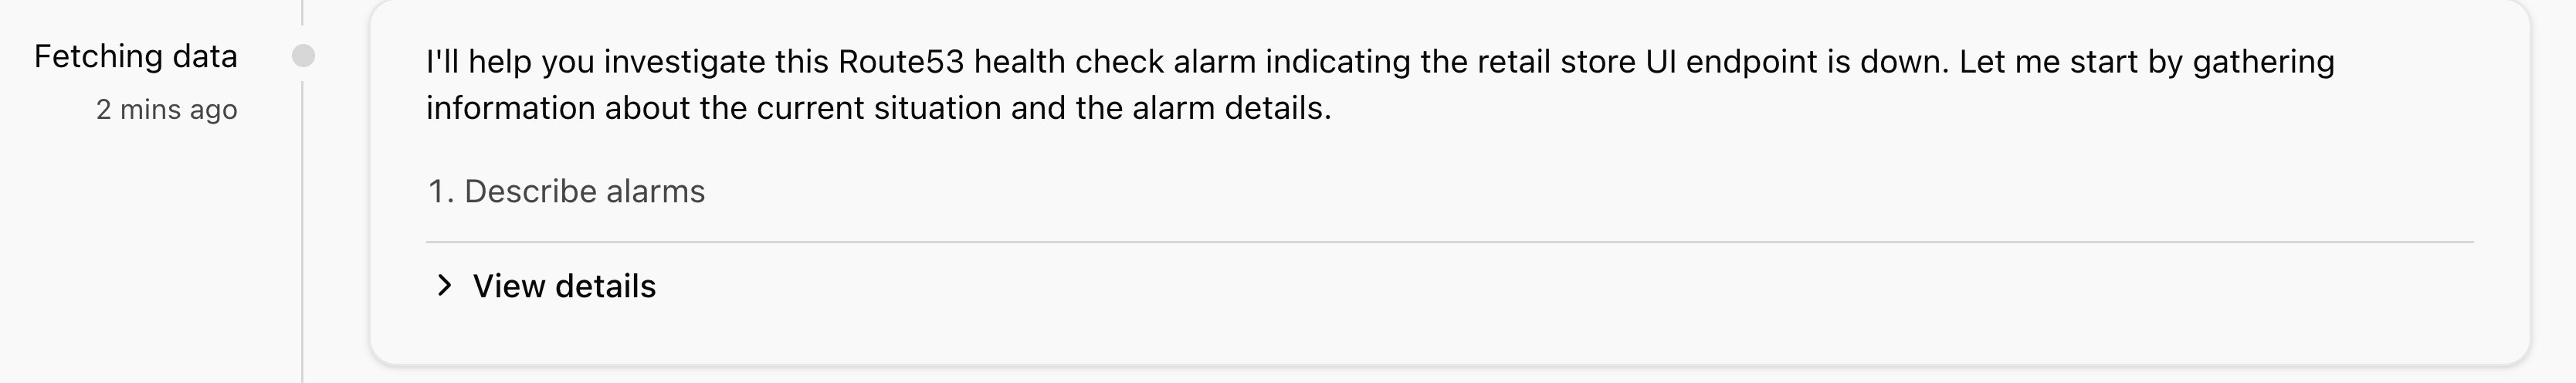
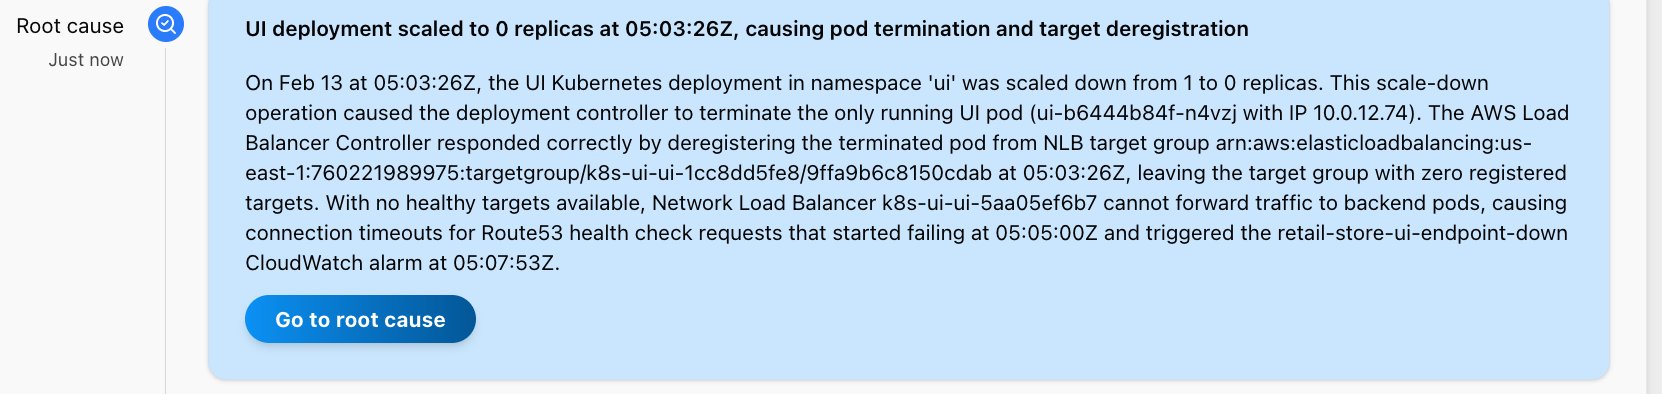
In this scenario, we demonstrate how AWS DevOps Agent autonomously investigates a Kubernetes application availability issue. You will see how the agent:
- Automatically triggers investigations when external health checks detect failures
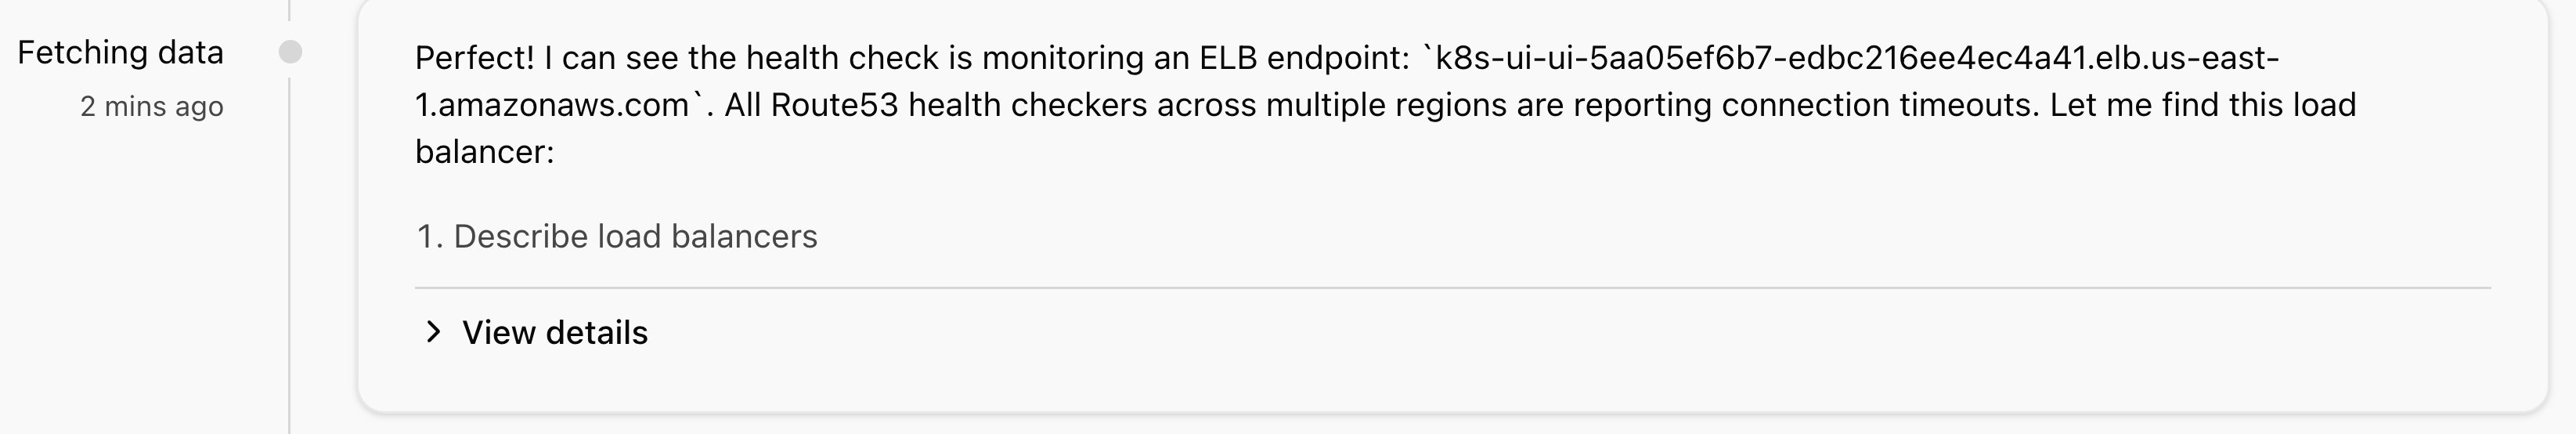
- Builds a topology graph mapping the relationships between Amazon Route 53, Network Load Balancer, Kubernetes Services, and Pods
- Correlates multi-layer telemetry across AWS infrastructure metrics, Kubernetes events, and container logs
- Traverses dependency chains from the external endpoint down to the specific failing pod
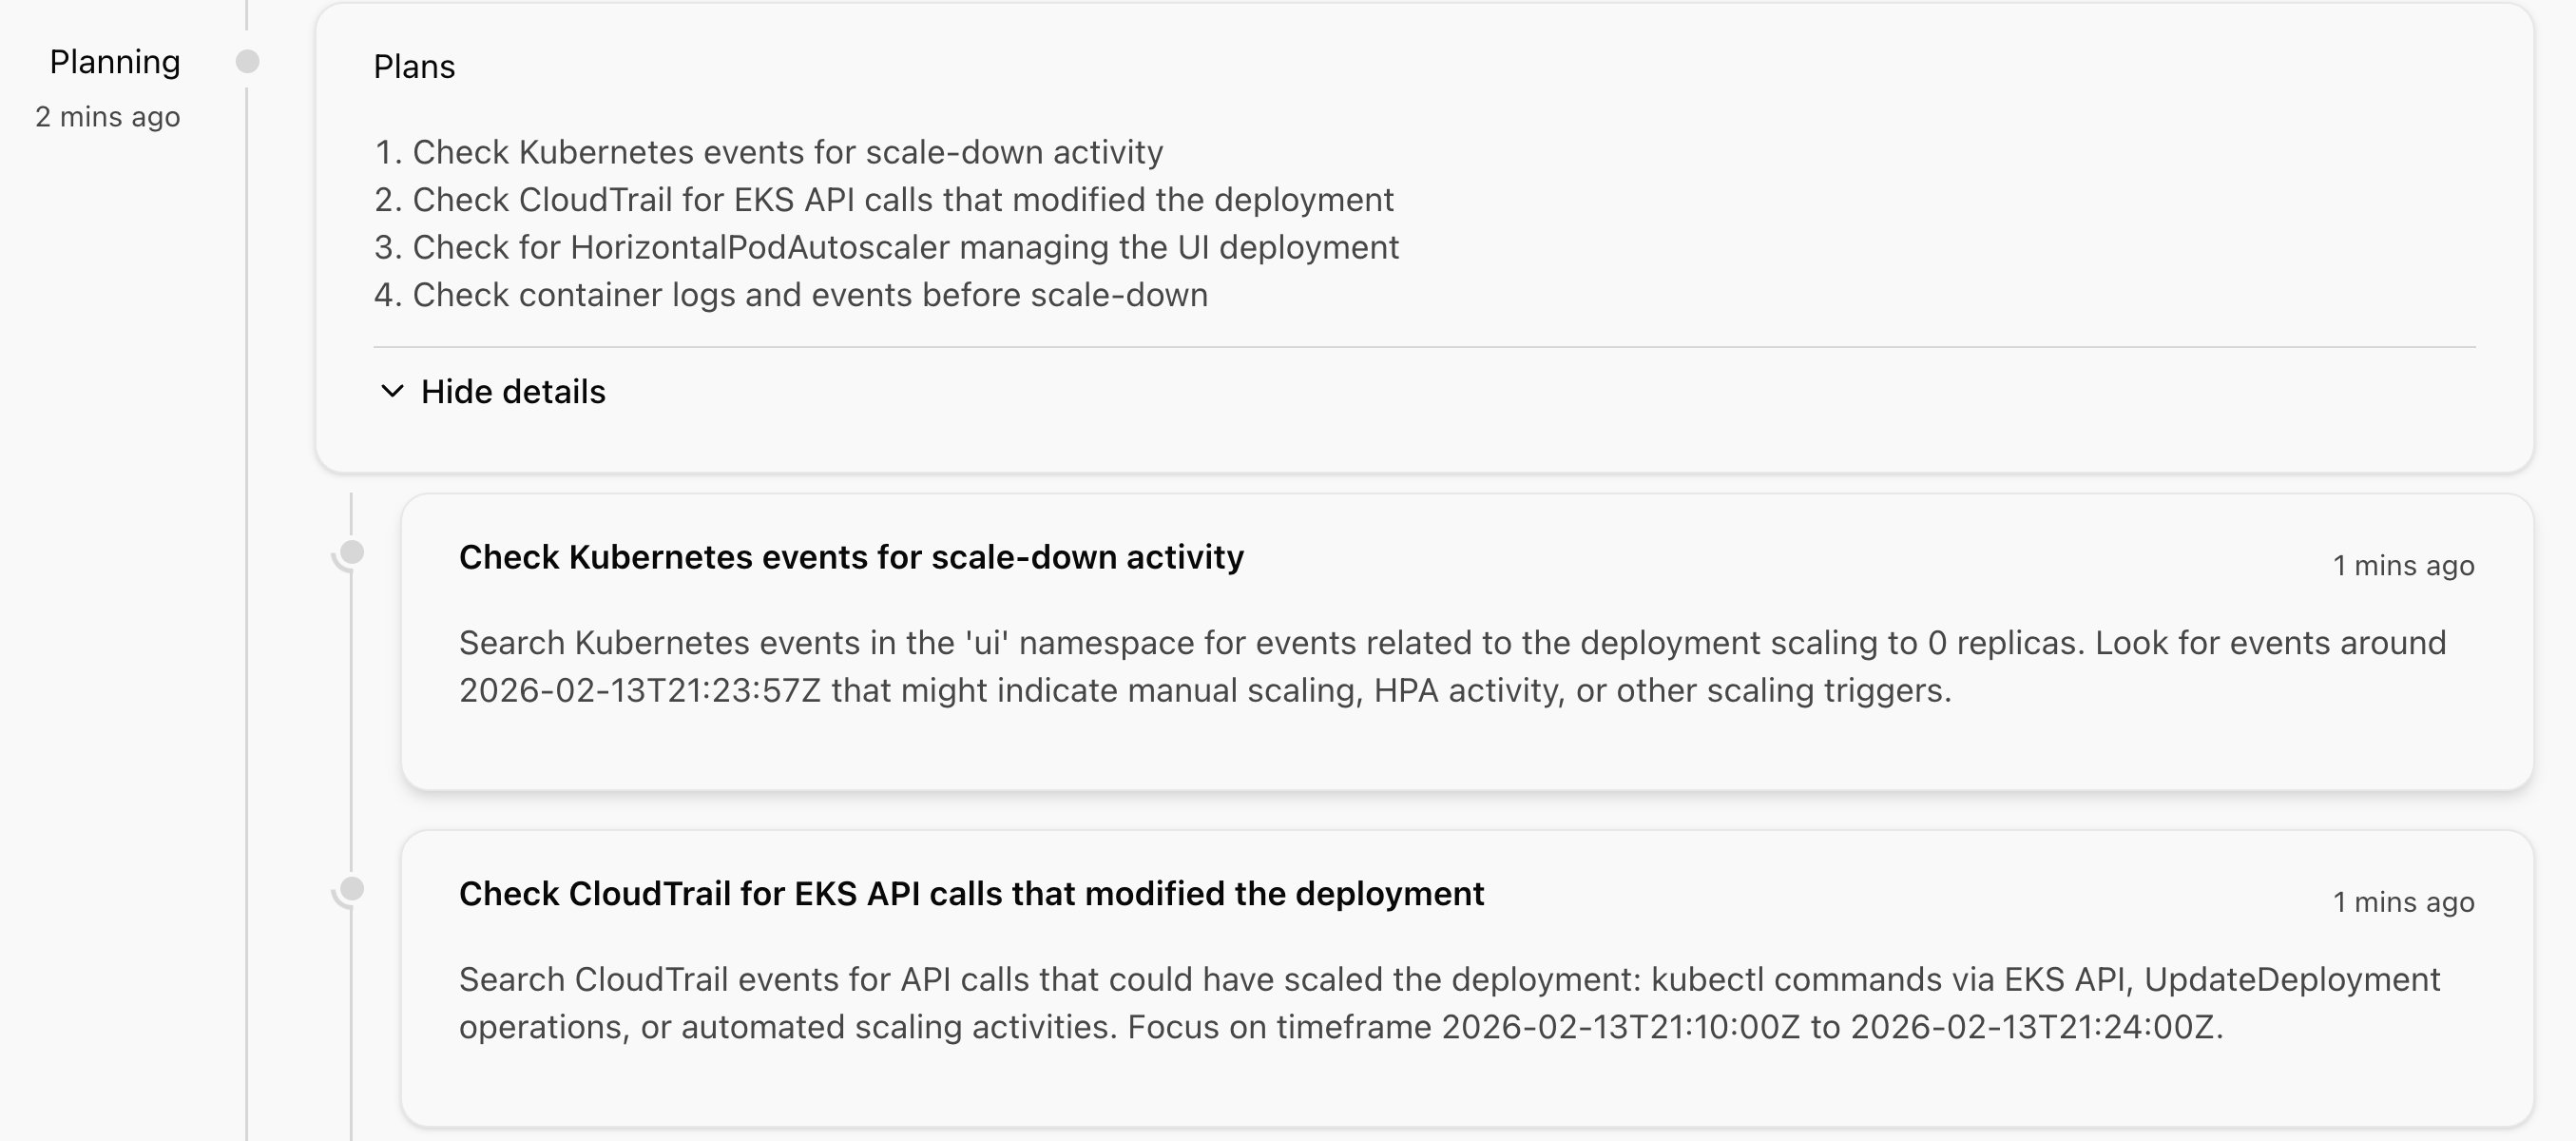
- Identifies root causes by analyzing pod status, container logs, and recent deployment changes
- Generates actionable mitigation plans with specific remediation steps
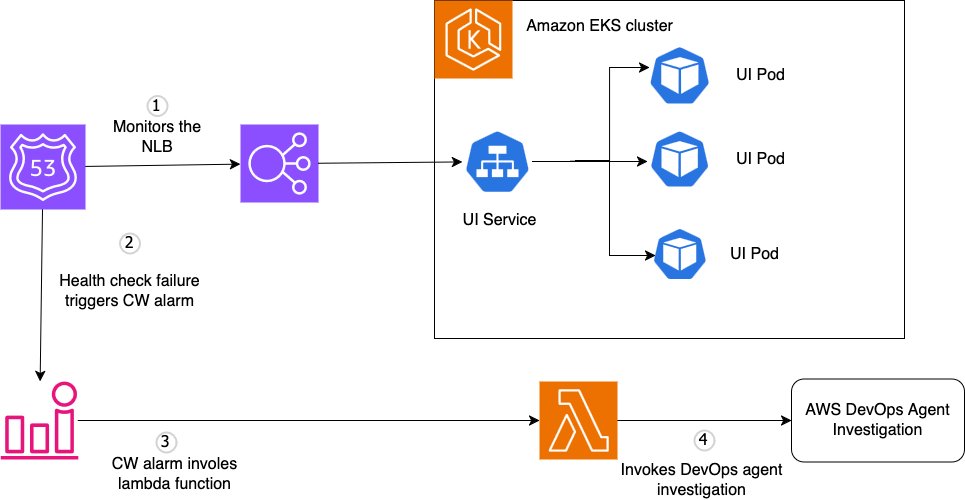
To experience this automated troubleshooting workflow, we set up a simulation environment. On successful setup, the environment will have the following components:
- Route 53 health check continuously monitors the UI Network Load Balancer endpoint (HTTP/80) every 30 seconds
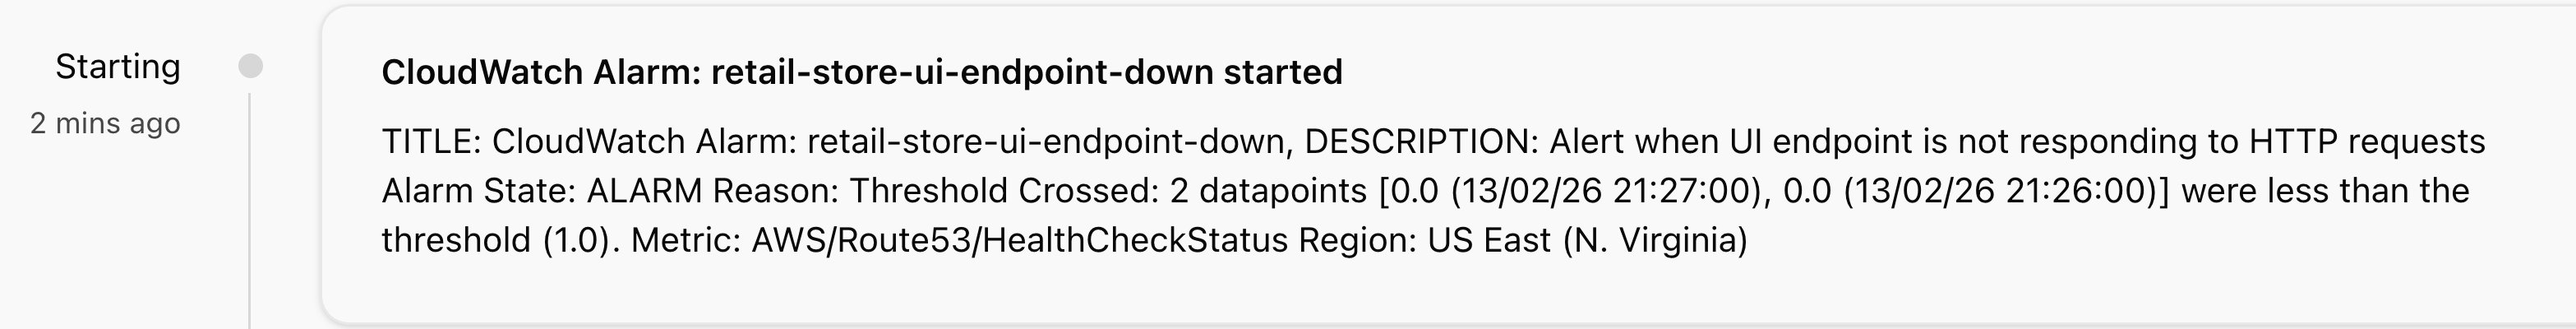
- Amazon CloudWatch Alarm –
retail-store-ui-endpoint-downtriggers when health check fails for two consecutive periods - AWS Lambda function processes the alarm, generates an HMAC-signed webhook payload, and invokes the DevOps Agent
- DevOps Agent receives the webhook, initiates an investigation, and queries the EKS API, Kubernetes API, CloudWatch Logs, and CloudWatch Metrics
Let’s now deploy the environment. To trigger DevOps Agent investigations automatically, we use the lambda function to invoke the agent’s webhook. To fetch the webhook, complete the following steps:
Step 1: Getting DevOps Agent’s webhook information
- Navigate to your Agent Space in the AWS DevOps Agent console.
- Go to the Capabilities tab.
- Under the Webhook section, choose Configure.
- Choose Generate webhook to create HMAC credentials.
- Save the webhook URL and secret. You will need these for the next step.
Step 2: Deploy
Extract the tar ball, configure the environment variables, and run the deploy script to create all the required resources.
Step 3: Trigger a test investigation
To validate the end-to-end flow without waiting for a real failure, manually scale down the UI application replicas to 0 to trigger an alarm: kubectl scale deployment ui --replicas=0Within minutes, you should see a new investigation appear in your DevOps Agent Space web app.
You can access the AWS DevOps Agent Operator Web App by completing the following steps:
- Navigate to the AWS DevOps Agent Console.
- Select your specific Agent Space from the list.
- On the Agent Space landing page, go to the Web app tab.
- Choose the Operator access.
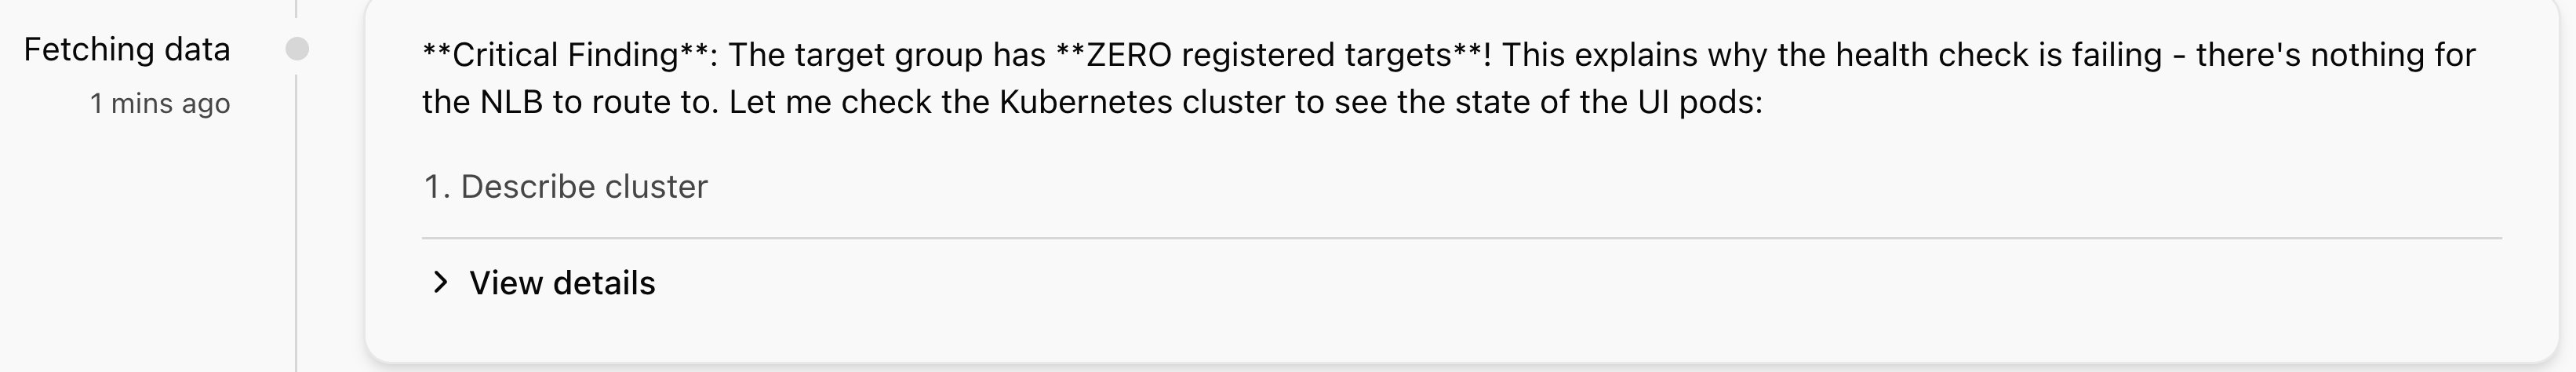
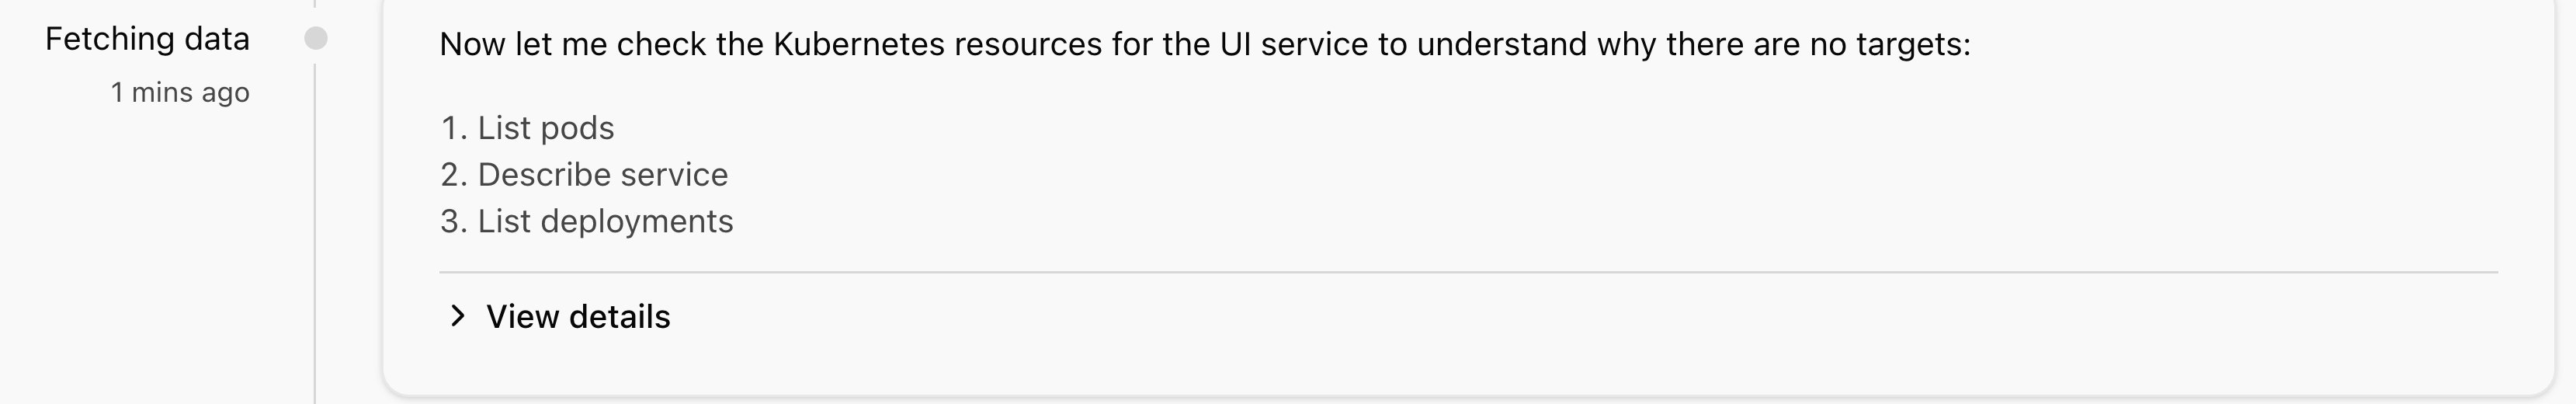
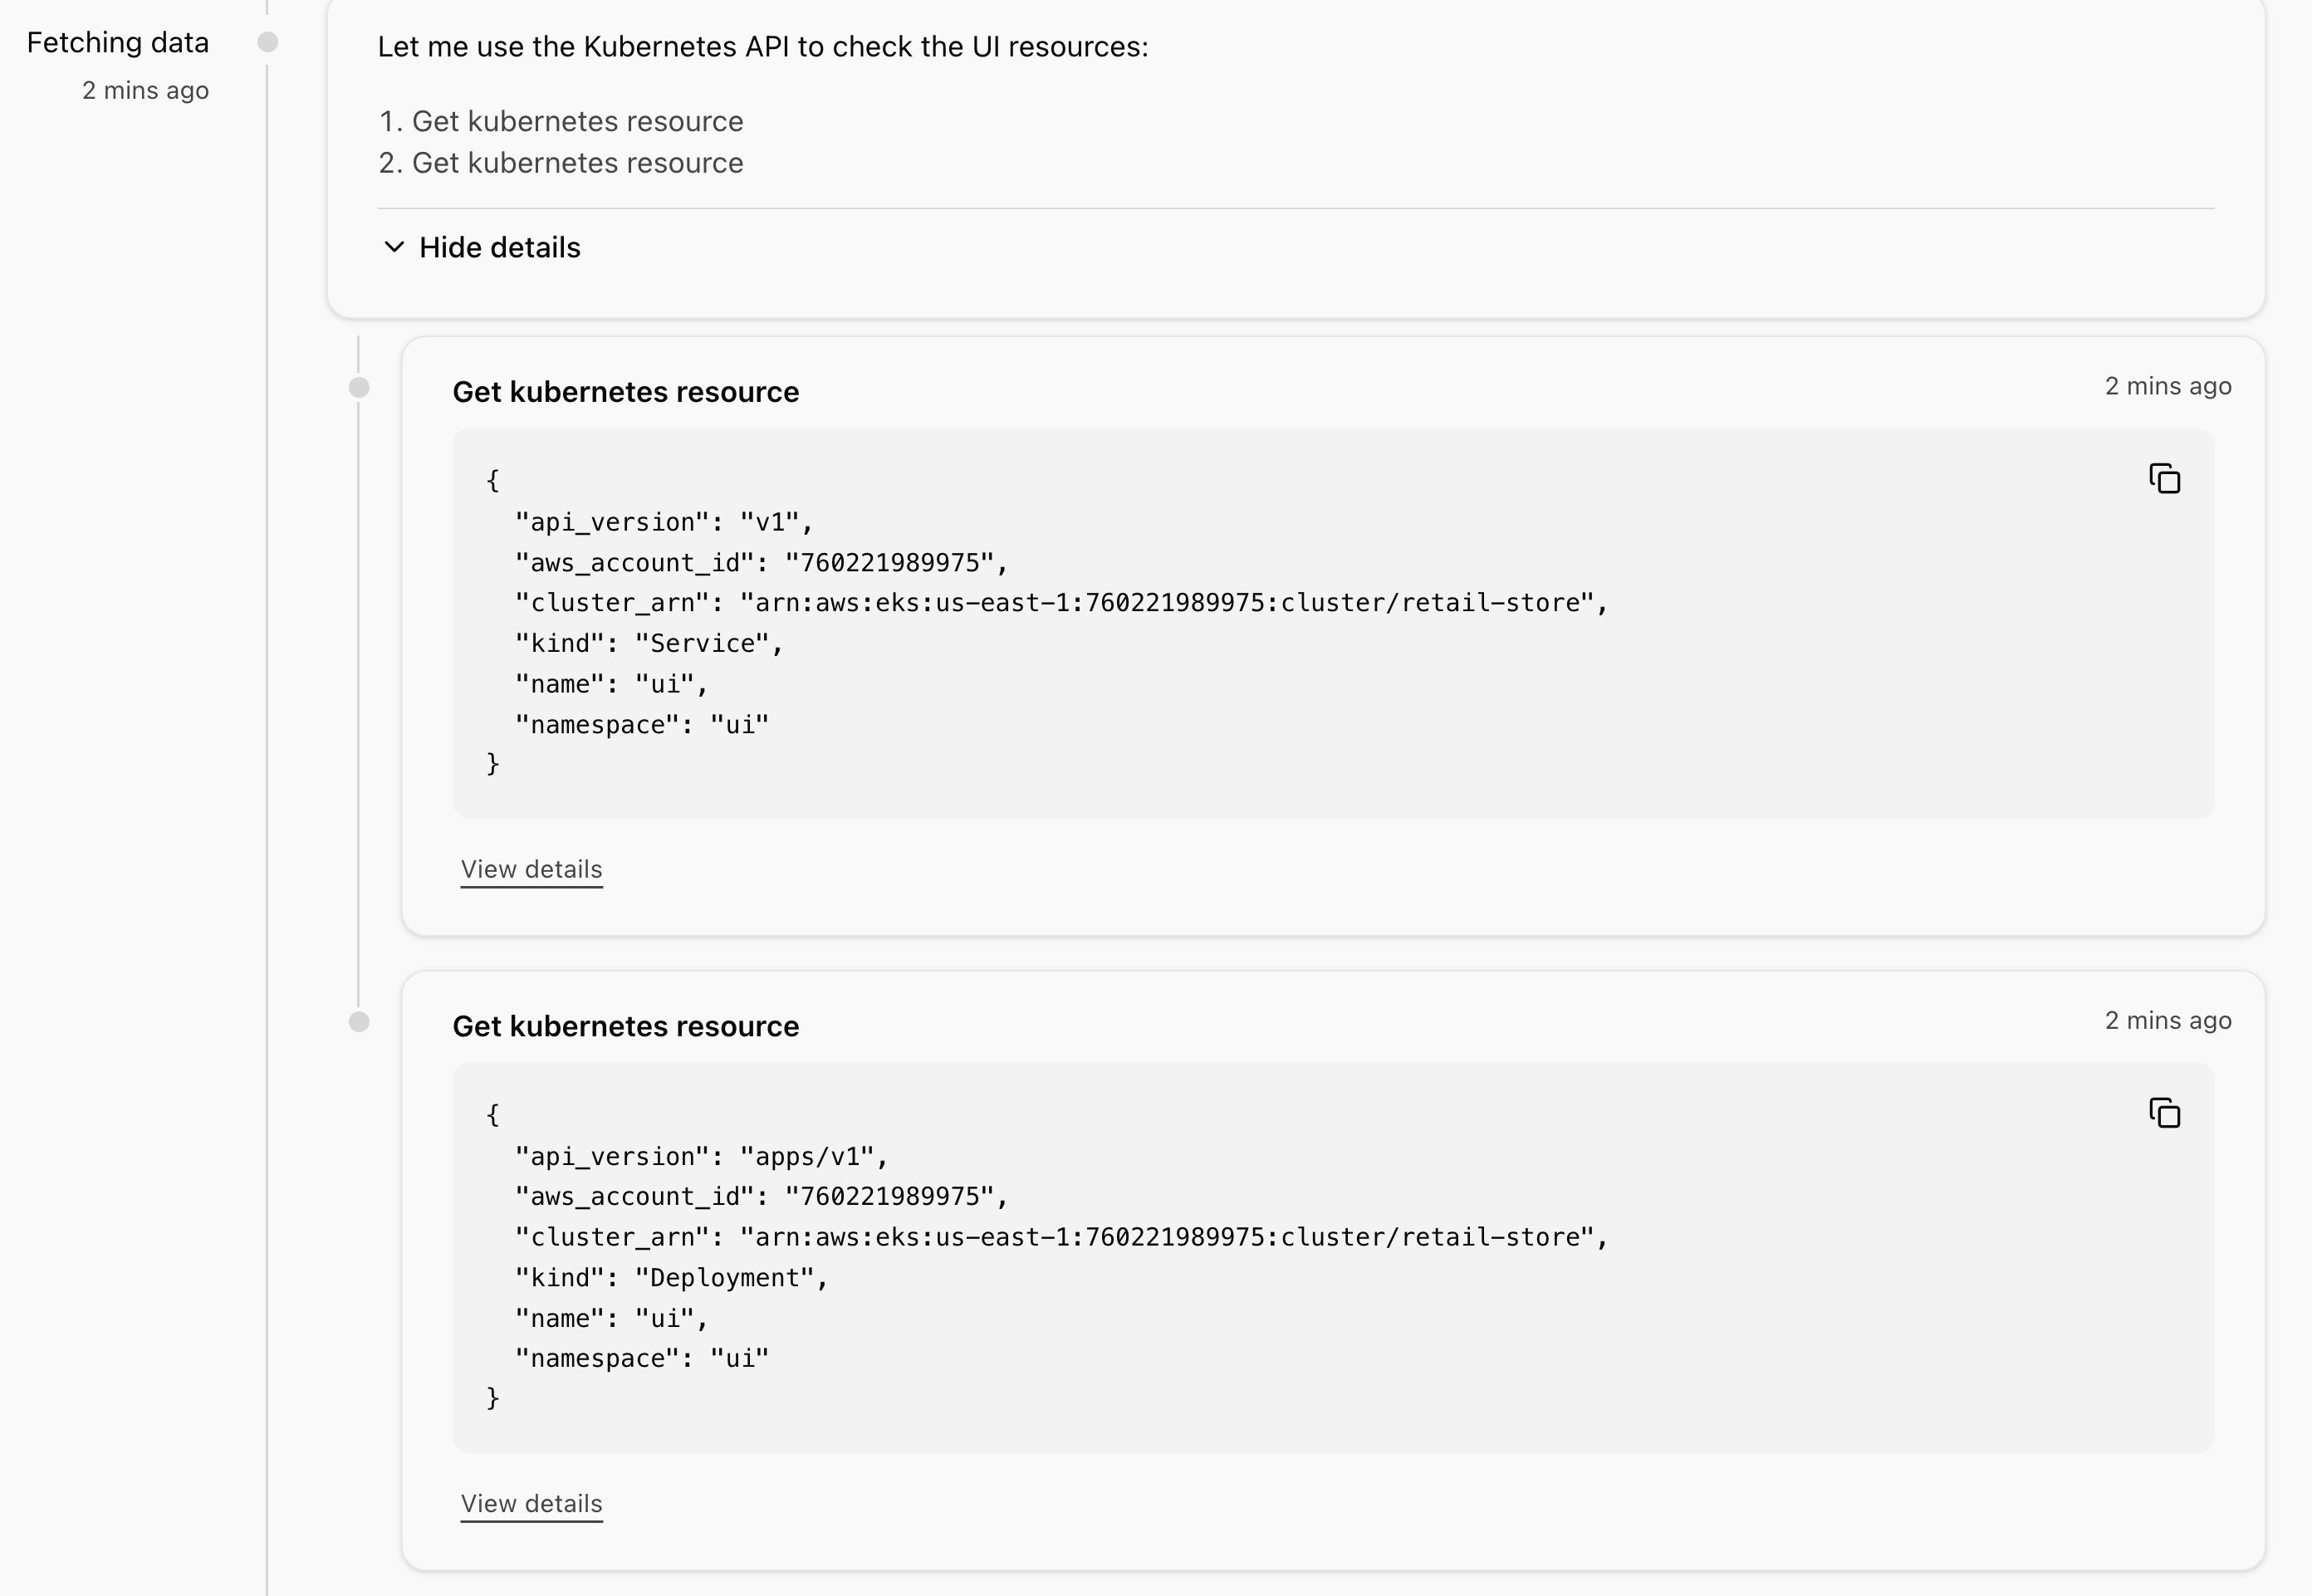
AWS DevOps agent when configured with the right access can leverage kubectl commands to discover and fetch information from your Amazon EKS cluster.
Scenario 2 – Kubernetes Infrastructure and application dependencies troubleshooting
Application failures don’t always originate from your workloads. In production Kubernetes environments, critical cluster add-ons like CoreDNS, kube-proxy, and the Amazon Virtual Private Cloud (Amazon VPC) Container Network Interface plugin form the foundation of cluster operations. When these components experience issues, the symptoms can manifest across seemingly unrelated applications, making root cause identification challenging. In this scenario, we demonstrate how AWS DevOps Agent automatically correlates application-level symptoms with underlying infrastructure issues, significantly reducing the time required to identify and resolve failures in critical Kubernetes add-ons.
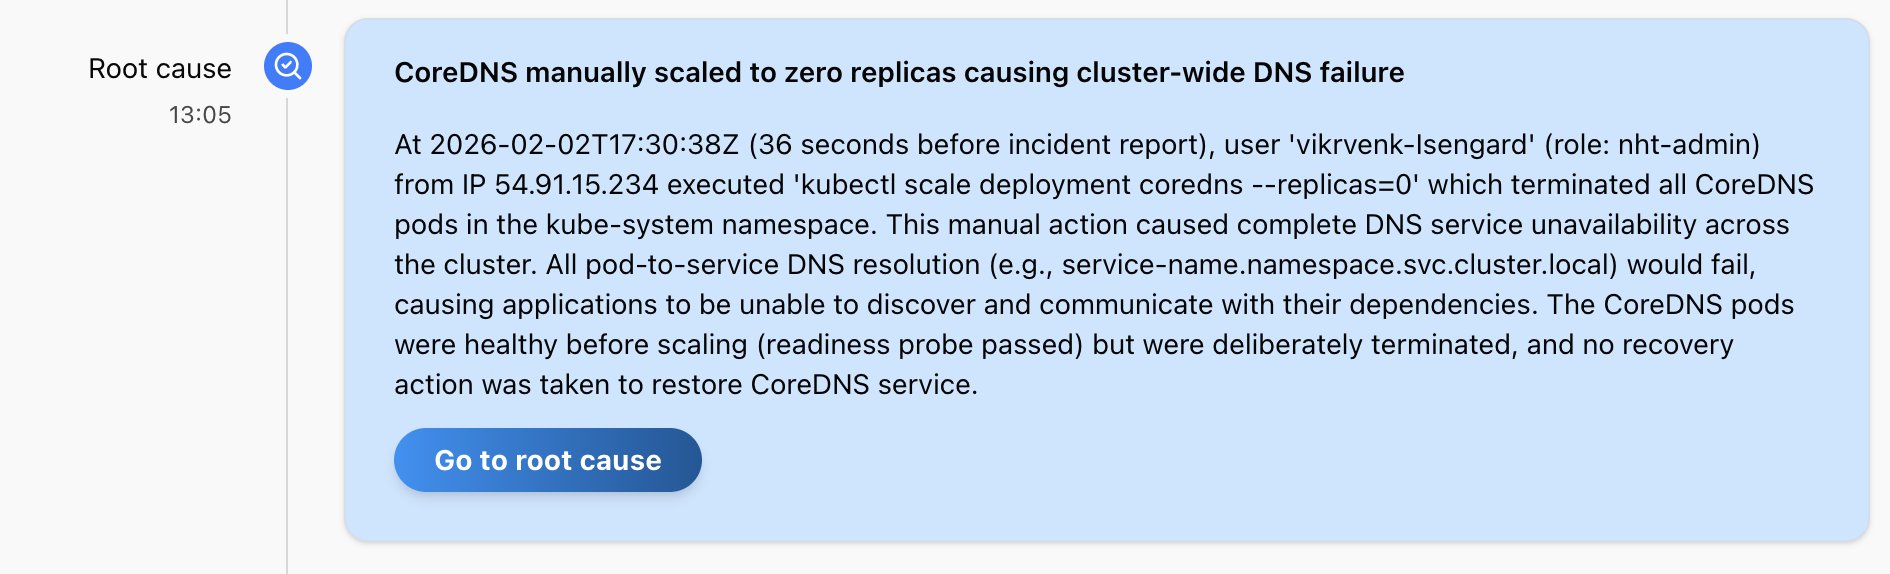
We intentionally scale down the coredns replica:
kubectl scale deployment coredns --replicas=0
Let’s initiate an investigation:
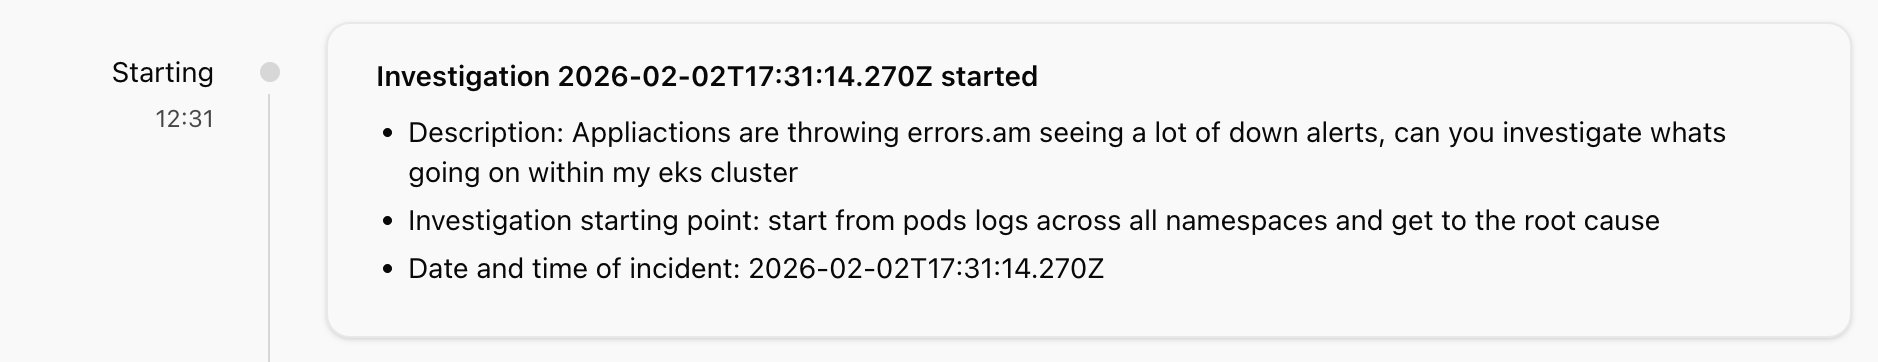
AWS DevOps Agent will go through your kube-events and pod logs of the kubernetes objects to identify the root cause. Within minutes, you should see the root cause of the down alerts:
You can provide additional context and troubleshooting guidance to the DevOps agent by adding a runbook in the Skills tab. A detailed EKS troubleshooting document is provided in the GitHub repo.
Conclusion
In this post, we demonstrated how AWS DevOps Agent transforms Amazon EKS operations by building intelligent knowledge graphs that map the complex relationships between your Kubernetes resources. By automatically correlating telemetry signals across infrastructure, application, and container layers, the agent significantly reduces MTTI and MTTR for incidents in your EKS environments.
The power of AWS DevOps Agent lies in its ability to understand context, not only collect data. Instead of manually correlating logs, metrics, and events, the agent autonomously traces dependency chains—from external endpoints through load balancers, services, and pods—to pinpoint the exact source of failures. Whether troubleshooting application-level issues or critical infrastructure components like CoreDNS, the agent’s knowledge graph approach removes the guesswork that typically extends incident resolution times.
As Kubernetes environments continue to grow in complexity with thousands of nodes and intricate microservices architectures, the need for intelligent, autonomous operations becomes critical. AWS DevOps Agent doesn’t only alert you to problems—it investigates them, understands their context within your broader infrastructure, and provides actionable remediation steps, acting as your always-on DevOps engineer.
Further reading
To learn more about AWS DevOps Agent, refer to the following resources:
- From AI agent prototype to product: Lessons from building AWS DevOps Agent
- Best Practices for Deploying AWS DevOps Agent in Production
- Resolve application issues autonomously with AWS DevOps Agent and Dynatrace
- AWS DevOps Agent workshop