Containers
Track inter-AZ and NAT gateway traffic with EKS Container Network Observability
Teams running microservices on Amazon Elastic Kubernetes Service (Amazon EKS) struggle to identify which services drive their data transfer costs. As clusters grow and service-to-service communication increases, inter-AZ traffic (data transfer between zones within the same region) and NAT gateway processing charges add up fast. Without pod-level visibility into these network flows, it’s difficult to pinpoint which workloads contribute most. Architectural decisions such as pod placement, cross-zone communication patterns, and NAT gateway routing directly affect your bill in ways that are hard to trace and optimize.
Container Network Observability in Amazon EKS gives you near-real-time visibility into the workloads generating these costs across your cluster. Rather than sifting through aggregate billing data after the fact, you can track inter-AZ and NAT gateway traffic at the pod-level, right where the spending originates, identifying optimization opportunities, prioritizing changes, and validating that adjustments are having the intended effect.
In this post, you’ll learn how to: (1) enable Container Network Observability in your Amazon EKS cluster, (2) identify and reduce inter-AZ traffic using traffic distribution control, (3) identify and reduce NAT gateway costs by implementing Amazon Virtual Private Cloud (VPC) endpoints, and (4) automate monitoring and reporting with an AI agent. This technical guide assumes familiarity with Kubernetes concepts and AWS networking basics.
Container Network Observability in Amazon EKS
Container Network Observability in Amazon EKS provides pod-level insights into your cluster network traffic. Network Flow Monitor powers these capabilities. Network Flow Monitor is a feature of Amazon CloudWatch that offers near-real-time visibility into network performance across your AWS compute resources, services, and beyond.
With Container Network Observability in Amazon EKS, you can identify and analyze inter-AZ and NAT gateway traffic patterns within your Amazon EKS clusters. This guide walks you through practical strategies designed to help you minimize costs and reduce network spending.
The Container Network Observability in Amazon EKS uses the lightweight Network Flow Monitor Agent add-on, an eBPF (extended Berkeley Packet Filter) daemon, to monitor and collect network traffic of your cluster.
The Flow table is one of the key views:
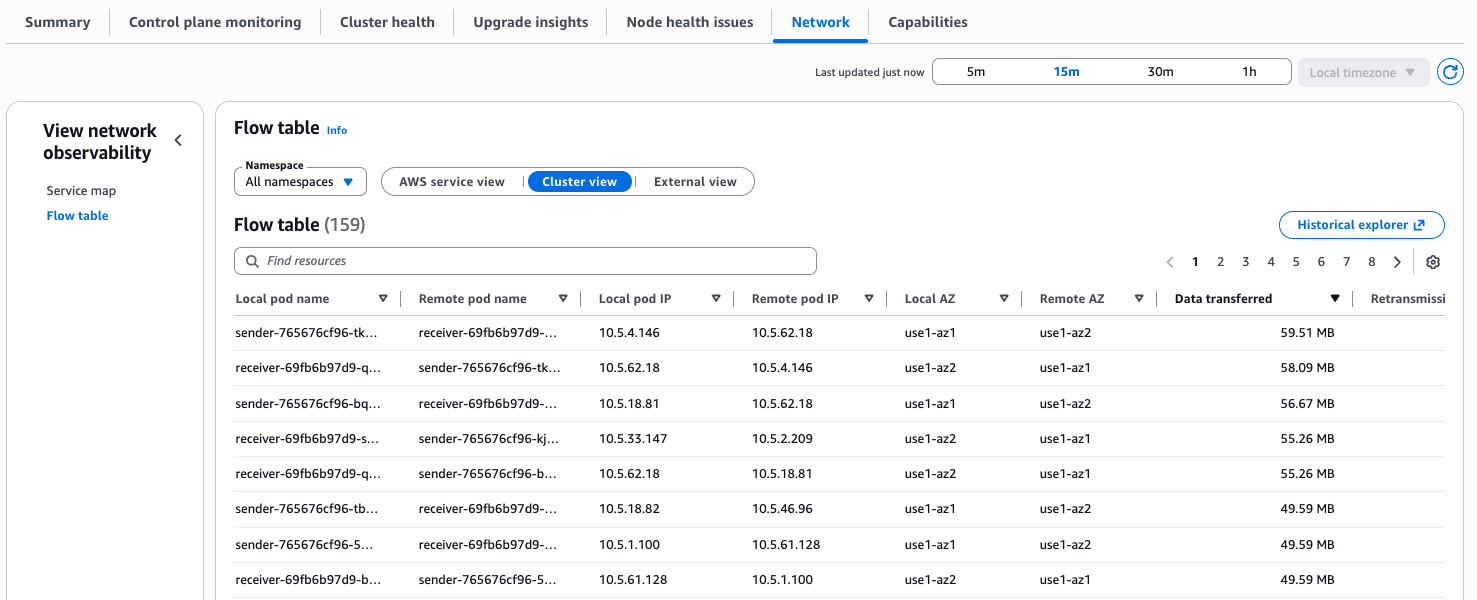
Flow table includes three traffic views:
- AWS Service view to see which workloads talk most to services like Amazon Simple Storage Service (Amazon S3) and Amazon DynamoDB.
- Cluster view to identify the noisiest east-west communicators in your cluster.
- External view to monitor traffic leaving AWS.
Now you’ll explore several use cases that you can use this tool to monitor and reduce network costs. It’s important to first identify where the network is flowing, and then you can evaluate whether and how it can be solved.
Prerequisites
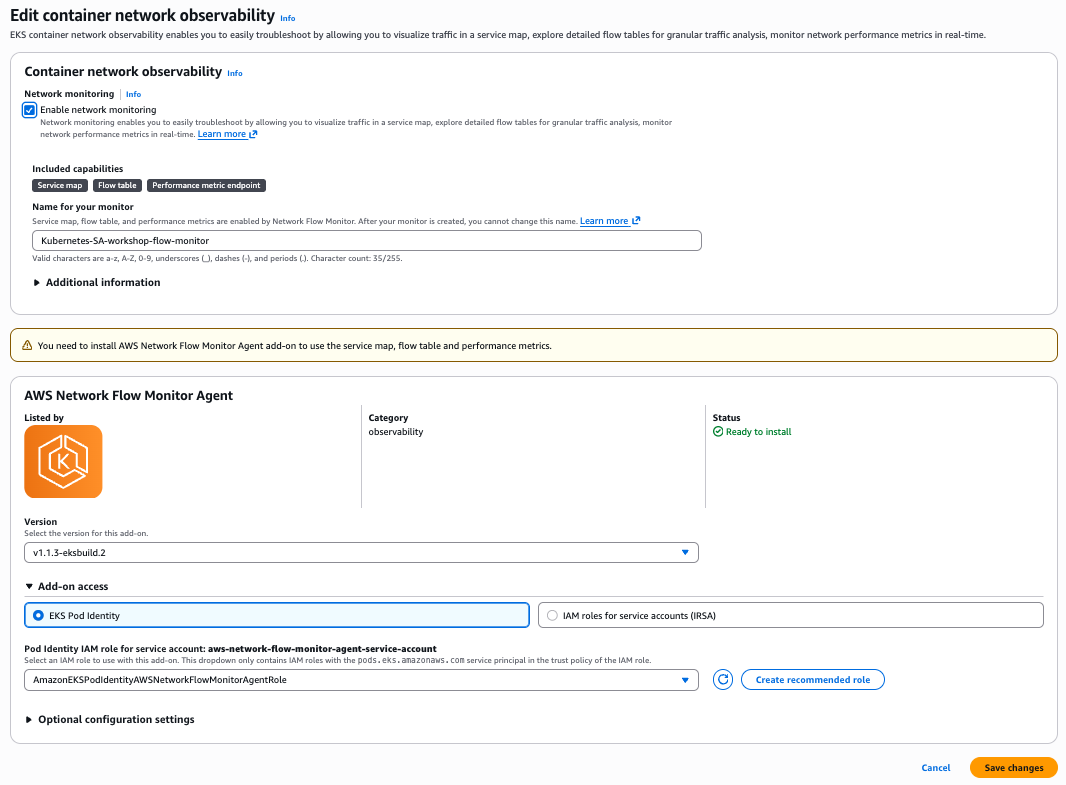
Amazon EKS cluster running Kubernetes version 1.35 or later configured with the Container Network Observability:
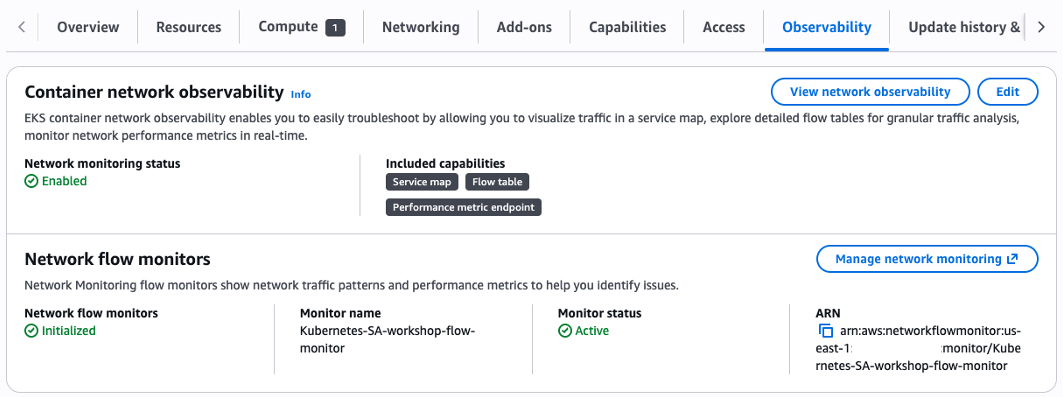
You can enable Container Network Observability for existing clusters using these steps:
- In the Amazon EKS console, select your cluster.
- Under the Observability tab, as shown in the image, choose Edit.
- Enable network monitoring and follow with the setup.
- After setup is complete, to access the Observability Dashboard, choose View Network Observability.
- In the left pane, navigate to the Flow table section.
For additional information, you can follow these instructions.
Use case 1: Identifying inter-AZ traffic
Inter-AZ traffic (also known as cross-AZ traffic) is when traffic flows between two Availability Zones within the same region. AWS charges $0.01 per GB in each direction, meaning a single inter-AZ exchange costs $0.02 per GB.
Under the Cluster view, you can see how your workloads communicate with each other. To identify inter-AZ traffic, you can filter by setting the Local AZ and the Remote AZ. You can also sort the view by Data transferred to identify the top workloads responsible for the most inter-AZ traffic.
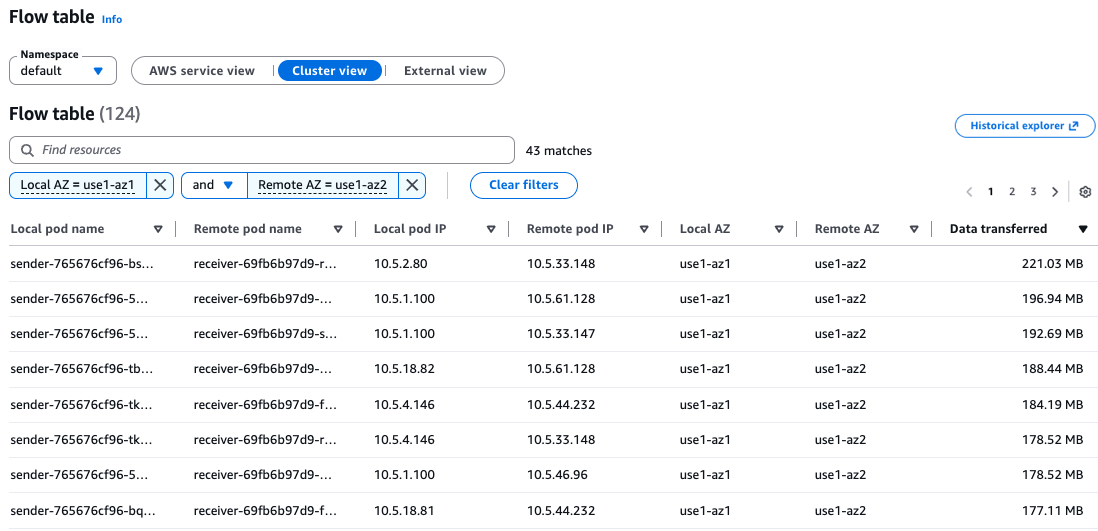
This example shows a service (sender) on AZ1 that sends requests to another service (receiver) on AZ2.
The sender service basically sends a 1 MB payload every 5 seconds to the receiver service. The receiver service is an nginx that listens to requests.
Receiver and sender manifest:
apiVersion: v1
kind: ConfigMap
metadata:
  name: receiver-nginx-conf
data:
  default.conf: |
    server {
      listen 80;
      client_max_body_size 2M;
      location / { return 200 "ok\n"; }
    }
---
apiVersion: apps/v1
kind: Deployment
metadata:
  name: receiver
spec:
  replicas: 6
  selector:
    matchLabels:
      app: receiver
  template:
    metadata:
      labels:
        app: receiver
    spec:
      containers:
        - name: receiver
          image: nginx:alpine
          ports:
            - containerPort: 80
          volumeMounts:
            - name: nginx-conf
              mountPath: /etc/nginx/conf.d/default.conf
              subPath: default.conf
      volumes:
        - name: nginx-conf
          configMap:
            name: receiver-nginx-conf
---
apiVersion: v1
kind: Service
metadata:
  name: receiver
spec:
  selector:
    app: receiver
  ports:
    - port: 80
---
apiVersion: apps/v1
kind: Deployment
metadata:
  name: sender
spec:
  replicas: 6
  selector:
    matchLabels:
      app: sender
  template:
    metadata:
      labels:
        app: sender
    spec:
      containers:
        - name: sender
          image: curlimages/curl:latest
          command: ["/bin/sh", "-c"]
          args:
            - |
              dd if=/dev/urandom bs=1M count=1 2>/dev/null | base64 > /tmp/payload
              while true; do
                echo "--- $(date) ---"
                curl -s -o /dev/null -w "HTTP %{http_code} - Size: %{size_upload} bytes - Time: %{time_total}s\n" --data-binary @/tmp/payload http://receiver
                sleep 5
              done
To run this test case on your cluster, save it to a file and apply it using kubectl apply -f <manifest.yaml>.
You can check the distribution of pods per Availability Zone (AZ) using the following command:
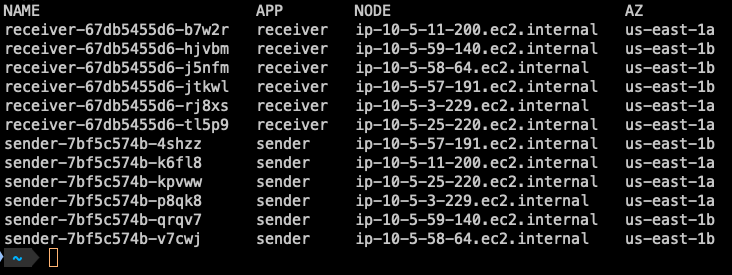
You can see the pods replicas are running on both Availability Zones us-east-1a and us-east-1b.
Handling inter-AZ traffic
There are several options when it comes to handling inter-AZ traffic:
- Leave it as is and absorb the cost: Availability comes at a price. If your workload requires high availability and you want to eliminate risk of service disruption in case one or more Availability Zones experience issues, this may be the right trade-off for your business requirements.
- Move your workload to a single AZ: This is generally not recommended for critical workloads that require high availability and fault tolerance.
- Use Kubernetes Traffic Distribution Control: With this Kubernetes feature, your services can prefer routing traffic to endpoints within the same zone, reducing inter-AZ traffic (also read the considerations for Traffic Distribution Control in the following section).
Traffic Distribution Control
Traffic Distribution Control allows you to express preferences for how traffic should be routed to Service endpoints. It was introduced in Kubernetes 1.30 and became generally available in 1.33. It offers a more predictable alternative to Topology Aware Routing for same-zone traffic preference.
The trafficDistribution is a field on the Kubernetes Service spec that gives the kube-proxy a hint about how to route traffic to Service endpoints.
In Kubernetes 1.34, the feature was further expanded and became stable in 1.35 with two new values:
PreferSameZone: Routes traffic to endpoints in the client’s zone. Falls back to cluster-wide if none are available.
PreferSameNode: Routes traffic to endpoints on the client’s node. Falls back to same-zone, then cluster-wide.
PreferClose (deprecated): Old alias for PreferSameZone.
Example:
apiVersion: v1
kind: Service
metadata:
  name: my-service
spec:
  selector:
    app: my-app
  trafficDistribution: PreferSameZone
  ports:
    - protocol: TCP
      port: 80
      targetPort: 8080
The PreferSameZone option directs kube-proxy to create rules that route traffic to same-zone endpoints first, based on the zone hint set by the EndpointSlice Controller. When no same-zone endpoints are available, it gracefully falls back to distributing traffic across available cluster endpoints for the Service.
So to modify the example service to use trafficDistribution, the receiver service can be updated by adding trafficDistribution: PreferSameZone
apiVersion: v1
kind: Service
metadata:
  name: receiver
spec:
  trafficDistribution: PreferSameZone
  selector:
    app: receiver
  ports:
    - port: 80
To apply the updated service configuration, run: kubectl apply -f <manifest.yaml>.
Verifying hints in EndpointSlices
After updating the service, you can verify that hints have been successfully added to the EndpointSlices by running the following command:
Example output (truncated for brevity)
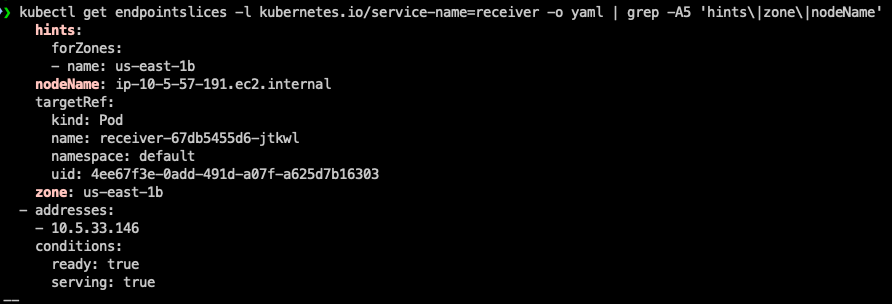
As shown in the output, the hints field has been successfully added, confirming that Traffic Distribution Control is now active for this service.
The hints field in the EndpointSlice is a key component of Traffic Distribution Control. hints provides guidance to the kube-proxy on how to route traffic to specific endpoints.
forZones is a list of zones that this endpoint should serve traffic for.
In this example, name: us-east-1b means this endpoint is preferred to handle traffic originating from the us-east-1b Availability Zone.
Traffic routing mechanism:
When a client sends a request to the service, kube-proxy reads the hints from the EndpointSlice. It then prioritizes routing the traffic to endpoints that match the same zone as the requesting node. This keeps traffic local to the zone, reducing cross-zone latency and data transfer costs.
Without Hints – Traffic is distributed randomly across all available endpoints, regardless of zone.
After applying the changes, allow a few minutes and then filter again the Flow table to check for changes:
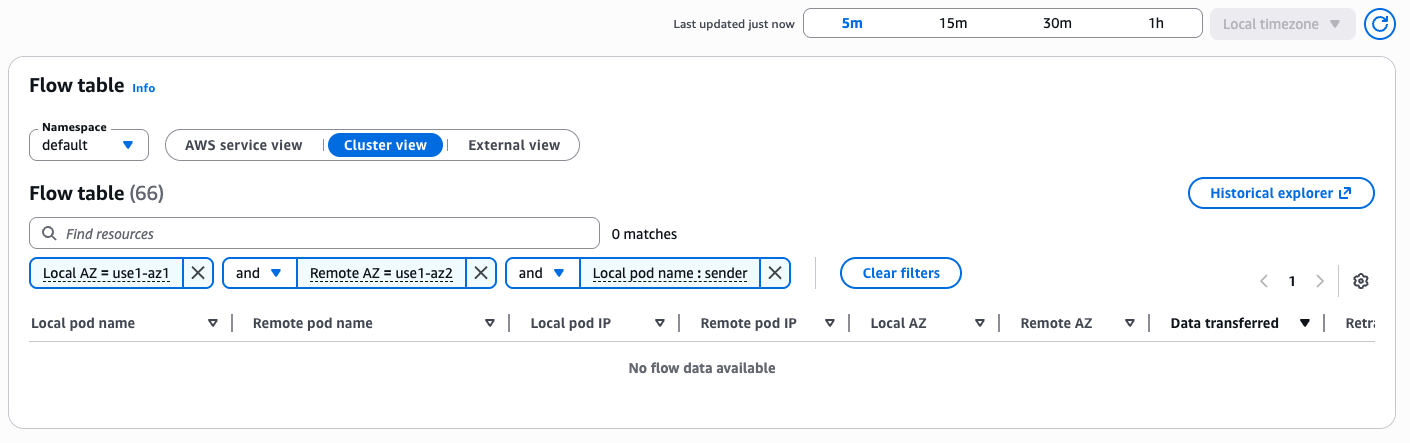
You can see that the inter-AZ traffic between the services is no longer visible in the Flow table.
Considerations for Traffic Distribution Control
When a Service uses trafficDistribution, it routes traffic to healthy endpoints within the target topology (same zone, same node, etc.), which can cause uneven load – some endpoints may receive significantly more traffic than others. This risk increases when endpoints are unevenly spread across topologies or incoming traffic is not balanced. You can mitigate this by using
- Pod topology spread constraints: Distribute pods evenly across zones or nodes to prevent hotspots and support balanced resource utilization. (Note: Combining topology spread constraints with Horizontal Pod Autoscaler (HPA) can lead to uneven scaling – pods may scale out in low-traffic zones while the overloaded zone gets no relief. Plan your scaling policies accordingly)
- Zone-specific deployments: For “same zone” routing with varying traffic patterns per zone, create a separate Deployment per zone. This gives independent scaling per zone, but adds management overhead.
Use case 2: Identifying NAT gateway processing bytes
Under the External view in the Flow table, you can see traffic leaving your cluster to destinations outside of AWS. This view is particularly useful for identifying workloads that communicate with external endpoints through your NAT gateway. This includes traffic directed to external public IPs, whether it belongs to a third-party provider or to public endpoints of AWS services such as Amazon Simple Queue Service (Amazon SQS), Amazon Simple Notification Service (Amazon SNS), Amazon Kinesis Data Streams, and others.
NAT gateway incurs a data processing fee ($0.045 per GB in most regions), in addition to the hourly charge for the gateway itself. Understanding which workloads are driving this traffic is the first step toward potentially reducing these costs.
Identifying NAT gateway traffic using the External view
To get started, sort the External view by Data transferred to surface the top traffic-generating workloads.
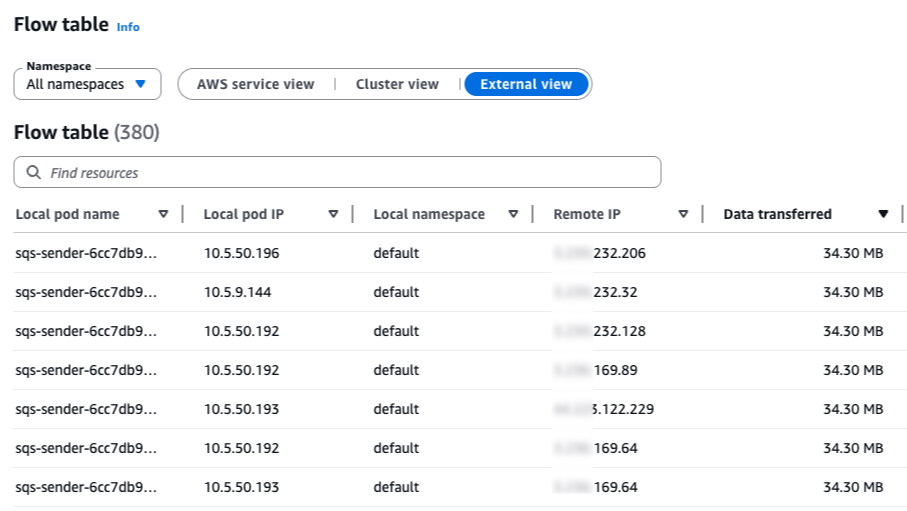
As shown in the image, you can see that my Flow table shows an sqs-sender deployment running on a private subnet (IPs 10.5.x.y) in the default namespace, communicating with multiple remote public IP addresses. The data transferred amounts to several MBs per flow. With multiple flows recorded, this traffic adds up quickly and every byte of it is flowing through your NAT gateway, incurring data processing charges.
We can examine one of the external IPs: xxx.xxx.232.206.
There are several ways to identify what’s behind a specific IP address. One approach is to inspect the TLS certificate:
If you look up queue.amazonaws.com, you’ll find that this DNS is associated with Amazon SQS.
This reveals the traffic pattern: the sqs-sender deployment is communicating with Amazon SQS over its public endpoint. Because SQS is accessed via public IP addresses, the traffic routes through the NAT gateway. This occurs even though both the Amazon EKS cluster and the SQS service reside within AWS. This is a frequent source of NAT gateway cost that you can reduce once you have visibility into the traffic flow.
Note that in this case, the IP belongs to an AWS service. However, you might also notice other IPs that are non-AWS, these will be explored shortly.
sqs-sender deployment manifest:
apiVersion: apps/v1
kind: Deployment
metadata:
  name: sqs-sender
spec:
  replicas: 10
  selector:
    matchLabels:
      app: sqs-sender
  template:
    metadata:
      labels:
        app: sqs-sender
    spec:
      serviceAccountName: sqs-sender
      containers:
        - name: sqs-sender
          image: amazon/aws-cli:latest
          command: ["/bin/sh", "-c"]
          args:
            - |
              dd if=/dev/urandom bs=1024 count=768 2>/dev/null | base64 | head -c 1048576 > /tmp/payload
              while true; do
                aws sqs send-message \
                  --queue-url https://sqs.${AWS_REGION}.amazonaws.com/${AWS_ACCOUNT_ID}/${SQS_QUEUE_NAME} \
                  --message-body file:///tmp/payload \
                  --region $AWS_REGION
              done
          env:
            - name: AWS_ACCOUNT_ID
              value: "<account-id>"
            - name: SQS_QUEUE_NAME
              value: "<queue-name>"
            - name: AWS_REGION
              value: "<region>"
This example sends 1 MB payload messages to an SQS queue.
To run this test case on your cluster, create an SQS queue and replace <account-id> with your AWS account ID, <queue-name> with your SQS queue name, and <region> with your region.
Handling NAT gateway traffic
After you’ve identified the source of NAT gateway traffic, there are several strategies to reduce or eliminate it:
- For AWS services – Most AWS services support Amazon Virtual Private Cloud (Amazon VPC) interface endpoints (powered by AWS PrivateLink). These endpoints route traffic from private subnets to AWS services directly through your private Amazon VPC network, completely bypassing the NAT gateway and eliminating its associated data processing costs for traffic routed through the endpoint. Additionally, S3 and DynamoDB support Amazon VPC Gateway Endpoints, which carry no hourly or data processing charges.
Example: Creating a VPC endpoint for Amazon SQS:
For more details, see Access an AWS service using an interface VPC endpoint
Note: Amazon VPC Interface Endpoints have their own pricing ($0.01/GB + ~$0.01/hr per AZ).
- For non-AWS services – If the provider is a well-known SaaS service (examples might include MongoDB Atlas, Datadog, or Snowflake), they most likely support private connectivity via VPC Peering or AWS PrivateLink. It is advisable to verify this directly with the third-party provider, as private connectivity can reduce both NAT gateway processing cost and exposure to the public internet.
- For external public endpoints (non-AWS, non-SaaS) – If your workloads need to access public IP addresses that are outside of AWS and do not support private connectivity options (such as third-party APIs, external webhooks, or on-premises services exposed over the internet), the traffic from the private subnets must route through the NAT gateway, and the associated data processing costs are unavoidable. In these cases, consider the following to minimize costs:
- Reduce payload sizes – Compress responses and cache them locally to minimize the volume of processed bytes by the NAT gateway.
- Evaluate alternative architectures – For specific workloads with high data processing from the internet, consider placing them in a public subnet. Note that you should carefully protect these instances from inbound internet traffic using Security Groups, Network ACLs, and proper monitoring (This is precisely why the best practice is to keep resources in private subnets by default).
Query Network Flow Monitor using AWS Command Line Interface
You can also use these AWS Command Line Interface (AWS CLI) commands to query the Network Flow Monitor data.
List available network flow monitors:
Query top contributors (this returns a query ID):
Available destination categories:
Check the query status and confirm it is SUCCEEDED before you review the results:
Fetch the query results using the returned query ID:
These CLI commands are also available in Python using Boto3. In the next section, we’ll demonstrate how to build an Agent that handles the heavy lifting for you. You can also use tools like Amazon Kiro or Claude Code to perform these operations.
Using an AI agent to automate network cost findings
In this section, we’ll demonstrate how to use an AI Agent to automatically analyze network flow monitor data and surface key findings. This can serve as a component of your proactive system monitoring and automation strategy.
This example uses Strands-Agents, an open source framework by AWS designed for building AI Agents. It uses Amazon Bedrock as the model provider but can be configured to work with other providers as well.
Strands-Agents provides a @tool decorator, making it straightforward to turn Python methods into tools your agent can call.
Our example defines an Agent that uses Anthropic Claude Sonnet 4.6 as the model with these three tools:
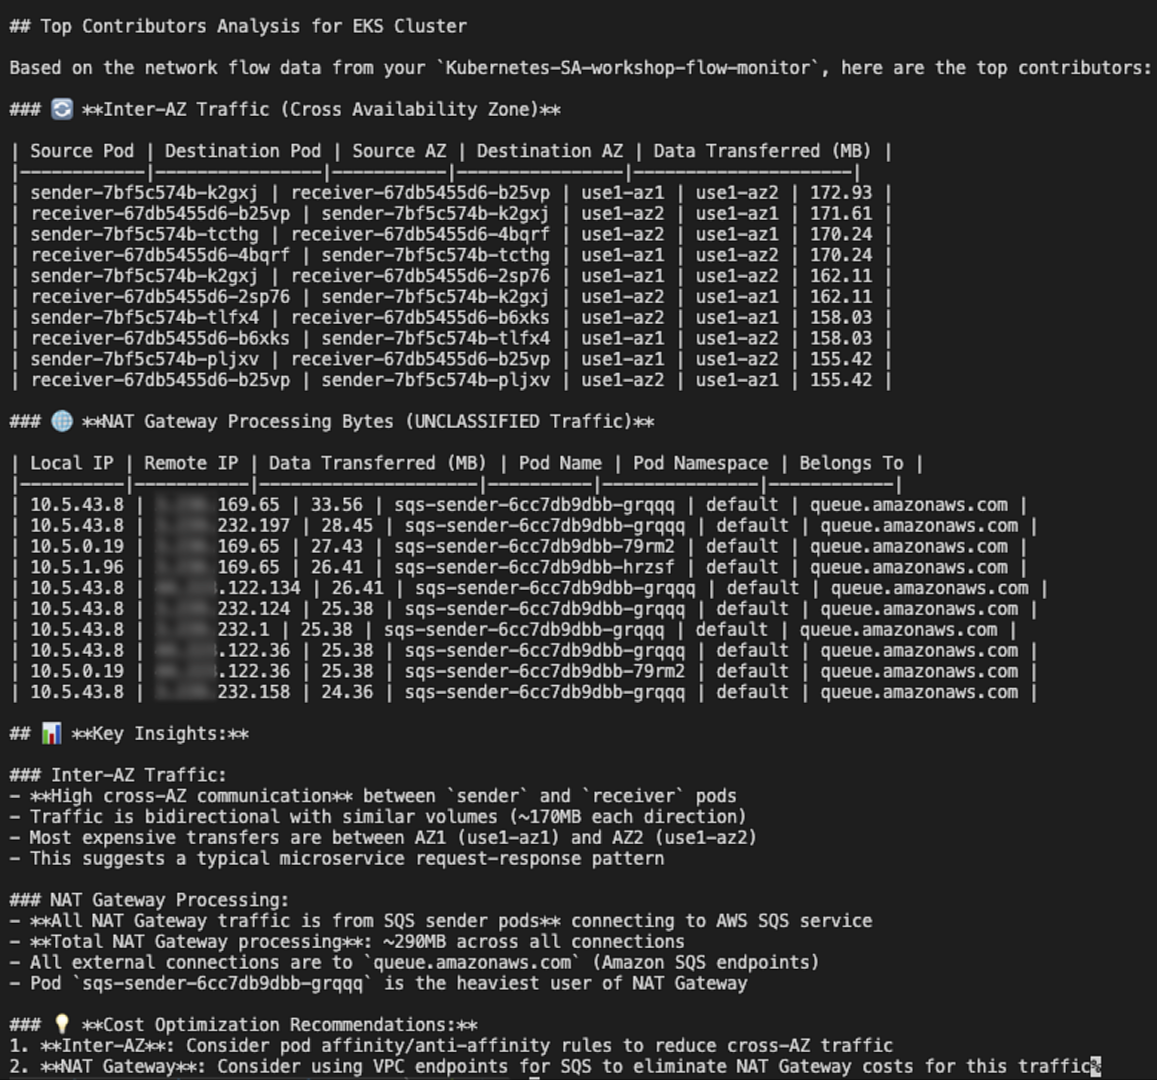
get_dns_name: A tool for getting the DNS of an IP.list_monitors: A tool for listing available network flow monitors.query_top_contributors: A tool for querying top contributors.
Example code:
import ssl
import time
import socket
from datetime import datetime, timedelta, timezone
import boto3
from strands import Agent, tool
from strands.models import BedrockModel
REGION = "us-east-1"
client = boto3.client("networkflowmonitor", region_name=REGION)
model = BedrockModel(
model_id="us.anthropic.claude-sonnet-4-6"
)
SYSTEM_PROMPT = """
You are an AI agent able to analyze network traffic from AWS Network Flow Monitor.
You have several tools to query the network data.
These are the destination_category options:
INTRA_AZ: Network flows within a single Availability Zone
INTER_AZ: Network flows between Availability Zones
INTER_REGION: Network flows between regions
INTER_VPC: Network flows between VPCs
AMAZON_S3: Network flows to or from Amazon S3
AMAZON_DYNAMODB: Network flows to or from Amazon Dynamo DB
UNCLASSIFIED: Other network flows (includes data going outside AWS, also using NAT gateway)
Please print the results in a nice table.
For INTER_AZ traffic include these columns:
source pod, destination pod, source AZ, destination AZ, and data transferred in MB.
For UNCLASSIFIED traffic include these columns:
local ip, remote ip, data transferred in MB, pod name, pod namespace,
and a belongs_to column with the DNS name from the get_dns_name tool.
"""
@tool
def get_dns_name(ip: str) -> str | None:
"""Connect to an IP over TLS and return the common name (CN) from the certificate subject."""
try:
ctx = ssl.create_default_context()
ctx.check_hostname = False
ctx.verify_mode = ssl.CERT_REQUIRED
with ctx.wrap_socket(socket.socket(), server_hostname=ip) as s:
s.settimeout(5)
s.connect((ip, 443))
cert = s.getpeercert()
subject = dict(x[0] for x in cert.get("subject", ()))
return subject.get("commonName")
except Exception:
return None
@tool
def list_monitors():
"""List all available network flow monitors."""
response = client.list_monitors()
monitors = response["monitors"]
while "nextToken" in response:
response = client.list_monitors(nextToken=response["nextToken"])
monitors.extend(response["monitors"])
return monitors
@tool
def query_top_contributors(
monitor_name: str,
metric_name: str = "DATA_TRANSFERRED",
destination_category: str = "INTER_AZ",
start_time: str | None = None,
end_time: str | None = None,
max_results: int = 10,
):
"""Start a top contributors query and return results."""
now = datetime.now(timezone.utc)
if end_time is None:
end_time = now.strftime("%Y-%m-%dT%H:%M:%SZ")
if start_time is None:
start_time = (now - timedelta(hours=1)).strftime("%Y-%m-%dT%H:%M:%SZ")
response = client.start_query_monitor_top_contributors(
monitorName=monitor_name,
startTime=start_time,
endTime=end_time,
metricName=metric_name,
destinationCategory=destination_category,
)
query_id = response["queryId"]
print(f"Query started: {query_id}")
for _ in range(5):
status = client.get_query_status_monitor_top_contributors(
monitorName=monitor_name,
queryId=query_id,
)["status"]
if status == "SUCCEEDED":
break
if status in ("FAILED", "CANCELED"):
return f"Query {status.lower()}"
time.sleep(2)
else:
return "Query timed out"
response = client.get_query_results_monitor_top_contributors(
monitorName=monitor_name,
queryId=query_id,
maxResults=max_results,
)
contributors = response.get("topContributors", [])
while "nextToken" in response:
response = client.get_query_results_monitor_top_contributors(
monitorName=monitor_name,
queryId=query_id,
maxResults=max_results,
nextToken=response["nextToken"],
)
contributors.extend(response.get("topContributors", []))
return contributors
if __name__ == "__main__":
agent = Agent(
model=model,
tools=[get_dns_name, list_monitors, query_top_contributors],
system_prompt=SYSTEM_PROMPT,
)
response = agent(
"What are the top contributors to inter-AZ traffic and NAT gateway processing bytes "
"in my EKS cluster for the last hour?"
)Running your agent
Add the following required AWS Identity and Access Management (IAM) permissions to your IAM user or role:
Save the example code to a file named agent.py.
Verify that you have Python 3.10 or later installed.
Open your terminal and install strands-agents and boto3: pip install strands-agents boto3.
Run the agent from your terminal: python agent.py.
The Agent will report for top inter-AZ and External workloads contributors in the last hour.
Example output:
You can customize this example and integrate it with other tools such as email, Slack, or a notification service to receive alerts.
Clean up
To avoid ongoing charges, remove all resources created in this guide:
- Delete the Kubernetes test workloads:
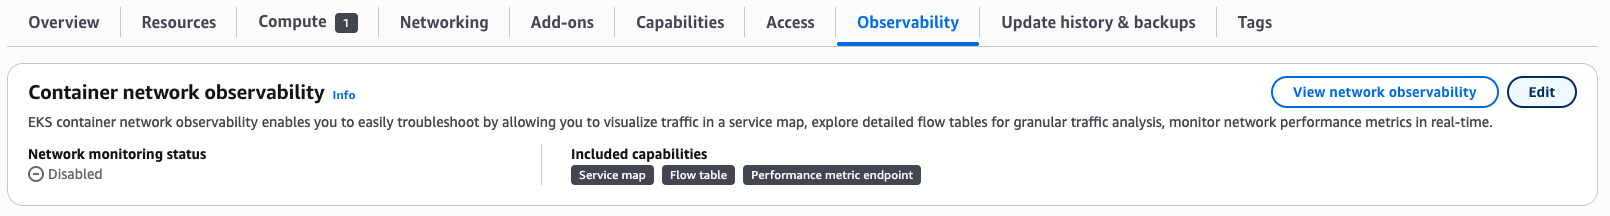
- Disable network monitoring (Warning: This will permanently delete the Amazon CloudWatch Network Flow Monitor and all historical flow data):
- In the Amazon EKS console, select your cluster.
- Choose the Observability tab.
- Choose Edit.
- Disable network monitoring.
- Save changes.
- Remove the IAM permissions added for the AI agent if no longer needed.
After completing these steps, all test resources and monitoring data is removed from your account, and no further charges will be incurred for these resources.
Conclusion
Network costs in Amazon EKS can silently grow into a significant portion of your AWS bill if left unmonitored. Inter-Availability Zone data transfer and NAT gateway processing charges are two of the most common and often overlooked contributors to these costs. While some of these costs are unavoidable, driven by high-availability requirements, multi-AZ deployment best practices, or specific system and compliance needs it’s essential to have visibility into them to verify you’re only paying for what’s necessary.
In this post, you explored how Container Network Observability in Amazon EKS, powered by the Network Flow Monitor Agent, provides the visibility needed to understand where your cluster’s network traffic is flowing.
For more information, see the following resources:
- Container Network Observability in Amazon EKS
- AWS Network Flow Monitor Agent add-on Amazon EKS
- Using Network Flow Monitor
- Pricing for Network Flow Monitor