AWS Cloud Operations Blog
Alerting Best Practices with Amazon Managed Service for Prometheus
Introduction
Alerts connect telemetry to action. Effective alert management helps you detect problems quickly, maintain resilience, and build customer trust. So, what is the best way to manage alerts when storing metrics in Amazon Managed Service for Prometheus? In this blog post, you will learn how to create, route, and administrate alerting rules in Amazon Managed Service for Prometheus (AMP) with practical examples. You’ll learn how to use key metrics, leverage vended Amazon Managed Service for Prometheus logs, and set up a dashboard to visualize and manage alerts. This blog post is part of a series on governance controls with Amazon Managed Service for Prometheus. To learn more on the first part of the series, visit Optimizing Queries With Amazon Managed Prometheus. For the second part covering metrics ingestion optimization, see Optimizing Metrics Ingestion with Amazon Managed Service for Prometheus.
Overview
This blog focuses on a centralized observability architecture. Example Corp, a multinational company, is collecting all platform and application metrics in Prometheus format with a centralized view from multiple AWS accounts. The central observability team, that managed to optimize their PromQL querying in the initial blog post, now needs to validate if Example Corp’s alerts are being created following the best practices to avoid alert fatigue. While making sure alert rules are readable so teams can act fast with reduced cognitive overload. Let’s explore how the AlertManager, Recording and Alerting rules features in Amazon Managed Service for Prometheus can help Example Corp address these challenges and reduce their mean time to recover from incidents.
Prerequisites
This blog post assumes you have the following:
- Amazon Elastic Kubernetes Service (EKS) workload
- Amazon Managed Service for Prometheus (AMP) Managed Scraper
- Amazon Simple Notification Service (SNS) topic or PagerDuty integration (optional)
- AWS Commandline (AWS CLI) installed and configured
- An IAM role or user with permissions to manage Amazon Prometheus resources, Cloudwatch log groups and alert notification targets
Architecture for monitoring an Amazon Elastic Kubernetes Service (Amazon EKS) workload
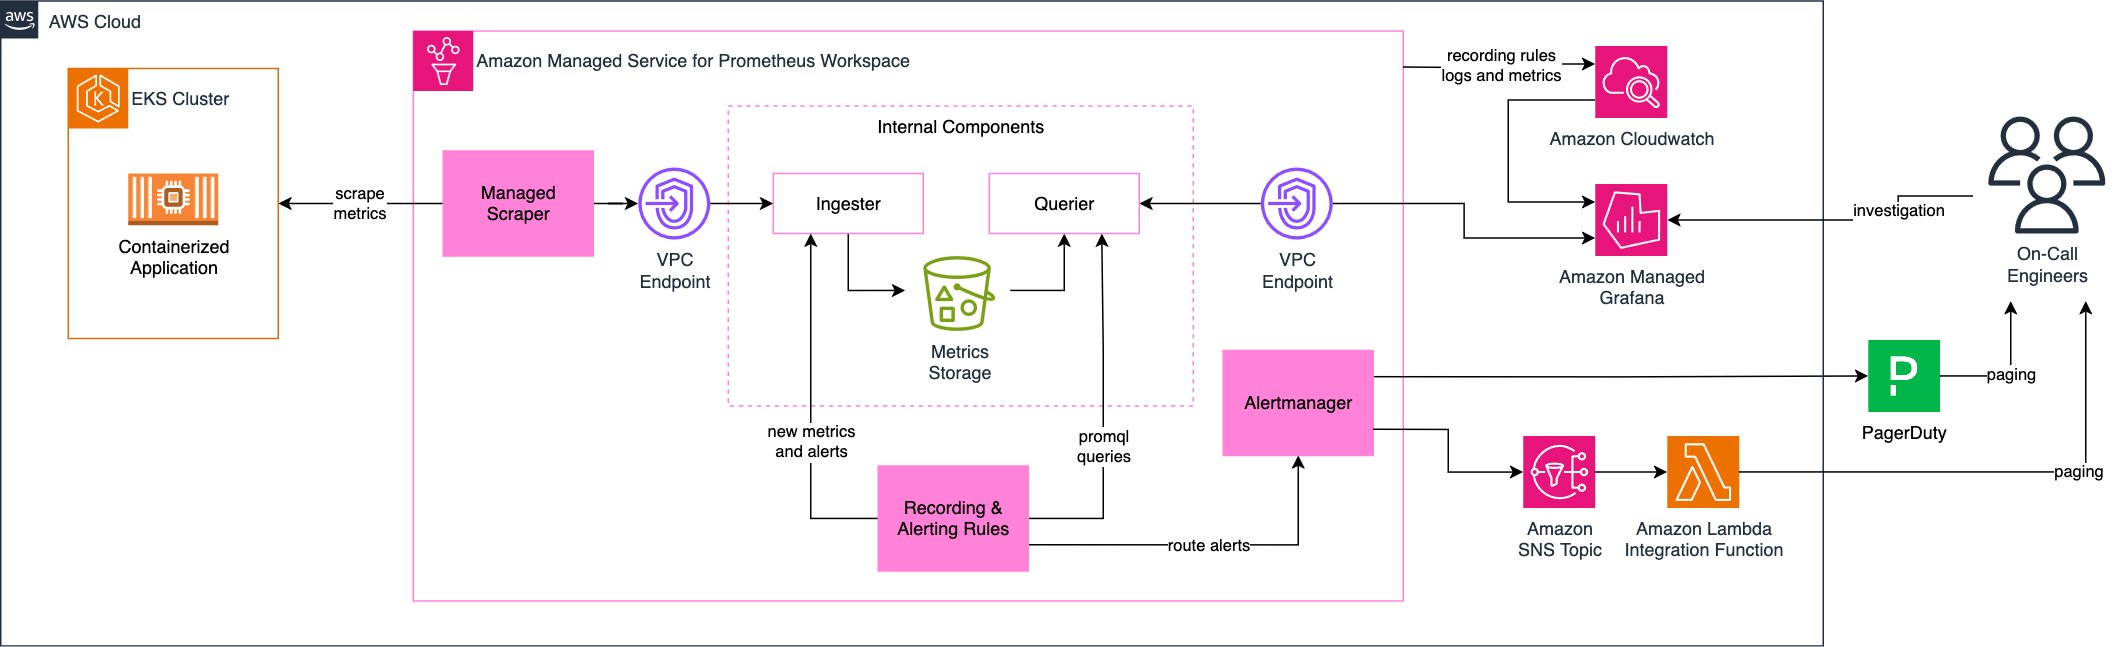
Figure 1: Amazon EKS based workload alerting architecture
As Example Corp is using AMP to monitor an EKS based workload, they will need to understand the architecture above. Let’s go through each component in detail.
- Amazon EKS workload: The containerized application running on an Amazon EKS cluster, generating metrics like CPU usage, memory consumption, and error rates.
- Amazon AMP Scraper: The managed scraper collecting metrics from the Amazon EKS cluster, eliminating the need to manage Prometheus servers. It uses AWS Signature Version 4 to securely send ingested metrics to Amazon Managed Service for Prometheus destination.
- Recording & Alerting Rules: Precompiled PromQL (Prometheus Query Language) queries that will run periodically and generate new metrics and alerts.
- AlertManager: Amazon Managed Service for Prometheus’ AlertManager routes alerts based on defined rules, allowing the deduplication and grouping for efficient notification delivery and managing alerting fatigue. You can also use AlertManager to silence and inhibit alerts.
- Amazon SNS: Alerts from AlertManager are sent to an SNS topic. The Example Corp currently uses AWS Lambda to process alerts towards downstream systems for on-call duty.
- Introducing the PagerDuty direct integration: adding to the alternative of sending alerts to SNS, now AWS customers have the option of integrating Amazon Managed Service for Prometheus directly with PagerDuty, reducing the complexity to route alerts.
The architecture includes high level internal components of the Amazon Managed Service for Prometheus that you do not need to configure, namely the Ingester, the Querier, and the Metrics Storage. They are designed in the diagram solely for the purpose of explaining how Recording & Alerting Rules are connected to the service. This setup focus on scalable metric collection, efficient alerting, and seamless integration with operational workflows. For details on setting up the managed scraper, see the Automating metrics collection on Amazon EKS with Amazon Managed Service for Prometheus managed scrapers.
Recording and alerting rules
Both recording rules and alerting rules are essential components of Amazon Managed Service for Prometheus, but they serve different purposes. Let’s explore how Example Corp uses each type of rule to enhance their observability strategy.
Recording rules
Used mostly for query performance optimization, recording rules precompute frequently used or complex PromQL expressions and store the results as new time series.
For example:
groups:
  - name: example-corp-recordings
    rules:
    - record: job:http_errors_total:5m
      expr: sum(rate(http_errors_total[5m])) by (job)
Recording rules create new metrics, and these can be used by alerting rules to manage alerts lifecycles. Both rule types are defined in YAML files and work together to create a comprehensive monitoring solution. While recording rules help Example Corp maintain dashboard performance at scale, alerting rules enables their team to respond quickly to potential issues.
Alerting rules
Used for proactive incident detection, alerting rules define conditions that trigger notifications when specific thresholds are met.
For example:
groups:
  - name: example-corp-alerts
    rules:
    - alert: HighCPUUsage
      expr: avg by(instance) (cpu_usage_total) > 80
      for: 5m
      labels:
        severity: warning
      annotations:
        description: "Instance {{ $labels.instance }} has high CPU usage"
Well-structured alerts use clear metrics, appropriate thresholds, and actionable notifications. They will be built on top of common metrics or recording rules, that will abstract complex queries and facilitate readability.
Configuring recording and alerting rules
Back to our use case with Example Corp, their on-call engineers need to be alerted when the HTTP error rate for any application is higher than 10%. They currently have a http_requests_total metric with a status label and possible values of 500, 400, 300, and 200. Example Corp wants to focus on the requests with response status 500.
1. Defining the recording and alerting rules
- Let’s create an
app_error_raterecording rule in Amazon Prometheus workspace using the steps below. This will calculate error rate as total errors divided by total requests usinghttp_requests_total{status="500"}for errors andhttp_requests_totalfor all requests. Using a recording rule improves query performance and simplifies the alerting rule that consumes this metric. - Let’s now define an alert if
app_error_rateexceeds 10% for 5 minutes. We will reuse the precomputedapp_error_ratemetric to fire an alarm when error rate exceeds 10% (> 0.1). This example below is configured to wait 5 minutes before firing (for: 5m) while including the severity and team labels for routing. Note that the alarm description provides actionable annotations with dashboard and runbook links. - Define the recording rule and the alert rule in a YAML file
rules.yamllocally as shown below.
groups:
  - name: error-rate-rules
    rules:
    # Recording rule
    - record: app_error_rate
      expr: sum(rate(http_requests_total{status="500"}[5m])) by (job)  / sum(rate(http_requests_total[5m])) by (job)
      labels:
        new_label: "application"
    # Alert rule
    - alert: HighErrorRate
      expr: app_error_rate > 0.1
      for: 5m
      labels:
        severity: critical
        team: platform
      annotations:
        summary: "High error rate detected"
        description: "Application error rate is {{ $value | humanizePercentage }} for the last 5 minutes"
        dashboard: "https://grafana.example.com/d/application-dashboard"
        runbook: "https://wiki.example.com/runbooks/high-error-rate"
2. Uploading the rules files
Let’s upload the rules to a new rule groups namespace in the Amazon Managed Service for Prometheus workspace using the AWS Command Line Interface (AWS CLI):
aws amp create-rule-groups-namespace \
  --workspace-id <your-workspace-id> \
  --name my-rules-namespace \
  --data file://rules.yaml

Output:
{
"name": "my-rules-namespace",
"status": "ACTIVE"
}
Namespaces are a convenient way of organizing rule groups. One team for example could have many different rules and alerting groups in the same namespace, while other teams would have their own namespaces. To verify your rules were uploaded successfully, you can run the following command:
# List all rule groups namespaces
aws amp list-rule-groups-namespaces --workspace-id <your-workspace-id>

Output:
"ruleGroupsNamespaces": [
{
"name": "my-rules-namespace",
"status": "ACTIVE",
"createdAt": "2025-01-10T14:22:31Z",
"modifiedAt": "2025-01-10T14:22:31Z"
}
]

# Get the specific namespace details
aws amp describe-rule-groups-namespace \
  --workspace-id <your-workspace-id> \
  --name my-rules-namespace

Output:
{
"name": "my-rules-namespace",
"status": "ACTIVE",
"data": "groups:\n- name: error-rate-rules\n rules:\n - record: app_error_rate\n expr: rate(http_requests_total{status=\"500\"}[5m]) / rate(http_requests_total[5m])\n labels:\n job: \"application\"\n",
"createdAt": "2025-01-10T14:22:31Z",
"modifiedAt": "2025-01-10T14:22:31Z"
}
3. Configuring AlertManager with SNS (option 1)
To route alerts to Amazon SNS, configure AlertManager using a YAML file. Set up groups that will allow AlertManager to reduce noise and alert fatigue. For example, if more than one alert for the same kubernetes namespace fire and you chose to group it together, the on-call team will be notified once, but have information of all different alerts firing within the same group through Amazon Managed Grafana. Here’s how to set it up:
Create an alertmanager.yml file locally:
alertmanager_config: |
  global:
    resolve_timeout: 5m
  route:
    group_by: ['alertname', 'severity', 'team', 'namespace']
    group_wait: 30s
    group_interval: 5m
    repeat_interval: 12h
    receiver: 'sns-notifications'
  receivers:
  - name: 'sns-notifications'
    sns_configs:
    - topic_arn: 'arn:aws:sns:region:account-id:your-topic-name'
      sigv4:
        region: region
      attributes:
        subject: '[{{ .Status | toUpper }}{{ if eq .Status "firing" }}:{{ .Alerts.Firing | len }}{{ end }}]'
Before moving on, let’s check important AlertManager configuration parameters:
- group_by: Determines how alerts are grouped together. In this example, alerts will be grouped together when they share the same name, severity, attached team, and Kubernetes namespace.
- group_wait: Initial waiting time before sending notifications.
- group_interval: Time between sending updated notifications when new alerts from the same group triggered since the last notification.
- repeat_interval: Minimum time before repeating a new notification of the same triggered group of alerts.
- sns_configs: SNS-specific configuration including topic ARN and AWS region.
For the complete instructions, including the necessary IAM permissions, refer to the official documentation.
4. Configuring AlertManager with PagerDuty (option 2)
Let’s begin with storing the Pagerduty integration key in the AWS Secrets Manager
# Create secret with PagerDuty integration key
aws secretsmanager create-secret \
--name amp-pagerduty-key \
--description "PagerDuty integration key for AMP" \
--secret-string '{"routing_key":"your-pagerduty-integration-key-here"}'
Like the above configuration in the option 1, do the following to configure AlertManager with PagerDuty integration in alertmanager.yml file locally:
alertmanager_config: |
  route:
    group_by: ['alertname', 'severity', 'team', 'namespace']
    group_wait: 30s
    group_interval: 5m
    repeat_interval: 12h
    receiver: 'pagerduty-receiver'
  receivers:
    - name: 'pagerduty-receiver'
      pagerduty_configs:
      - routing_key: 'arn:aws:secretsmanager:<REGION>:<ACCOUNT_ID>:secret:amp-pagerduty-key'
        description: '{{ .CommonLabels.alertname }}'
        severity: 'severity: '{{ .CommonLabels.severity | default "critical" }}''
        details:
          firing: '{{ .Alerts.Firing | len }}'
          status: '{{ .Status }}'
          instance: '{{ .CommonLabels.instance }}'
For the complete instructions, including the complete configuration of the AWS Secrets Manager secret that will securely store the integration API key and necessary IAM permissions, refer to the official documentation.
5. Uploading the configuration to Amazon Managed Service for Prometheus
You can now apply the configuration using the AWS CLI:
# Upload the alertmanager configuration directly
aws amp put-alert-manager-definition \
  --workspace-id <your-workspace-id> \
  --data file://alertmanager.yml
Monitoring your recording and alerting rules evaluations
Once rules and AlertManager is configured, Example Corp teams should start receiving proper, readable notifications when errors increase in this application. Using Amazon CloudWatch, they could leverage vended metrics and logs to monitor the execution and errors with recording and alerting rules. To monitor the performance of their rules, Example Corp can set up dashboards and Amazon CloudWatch alarms using the following metrics:
- RuleEvaluationLatency: Time taken to evaluate rules in milliseconds. High latency may indicate complex queries or resource constraints.
- RuleEvaluationFailures: Number of failed rule evaluations. Investigate for syntax errors or missing metrics.
- RulesEvaluated: Total rules evaluated. Use to monitor rule processing volume.
Amazon Managed Service for Prometheus can be configured to publish logs error and warning events in Amazon CloudWatch log groups in CloudWatch Logs. To enable the logs, execute the below command from the commandline.
# Create a log group for vended logs
aws logs create-log-group \
  --log-group-name "/aws/vendedlogs/prometheus/example-corp-workspace" \
  --region <REGION>

# Enable logging for the workspace
aws amp create-logging-configuration \
  --workspace-id <your-workspace-id> \
  --log-group-arn "arn:aws:logs:<REGION>:<ACCOUNT_ID>:log-group:/aws/vendedlogs/prometheus/example-corp-workspace"
For more instructions, refer to the official documentation. Example Corp can now use CloudWatch Logs Insights to know about any misconfigured rules:
fields @timestamp, @message
| filter @message like /ERROR.*rule/
| sort @timestamp desc
| limit 100
Viewing important metrics in a dashboard
To bring all these metrics and logs to a common place, using both Prometheus metrics, CloudWatch metrics and logs, we have prepared an example of the Grafana dashboard that you can use to monitor your alerts and recording rules with Amazon Managed Service for Prometheus.
Note: Please review the example dashboard before deploying it in your account to make sure it meets your organization’s security standards.
To import the dashboard, follow these steps.
1. Download the JSON from GitHub
2. In Amazon Managed Grafana, navigate to Dashboards → Import
3. Upload the JSON file
4. Configure data sources:
– Prometheus: Your AMP workspace
– CloudWatch: Your AWS account/region
5. Set the workspace_id variable to your AMP workspace ID
Here’s an overview of the dashboard and let’s break it down.
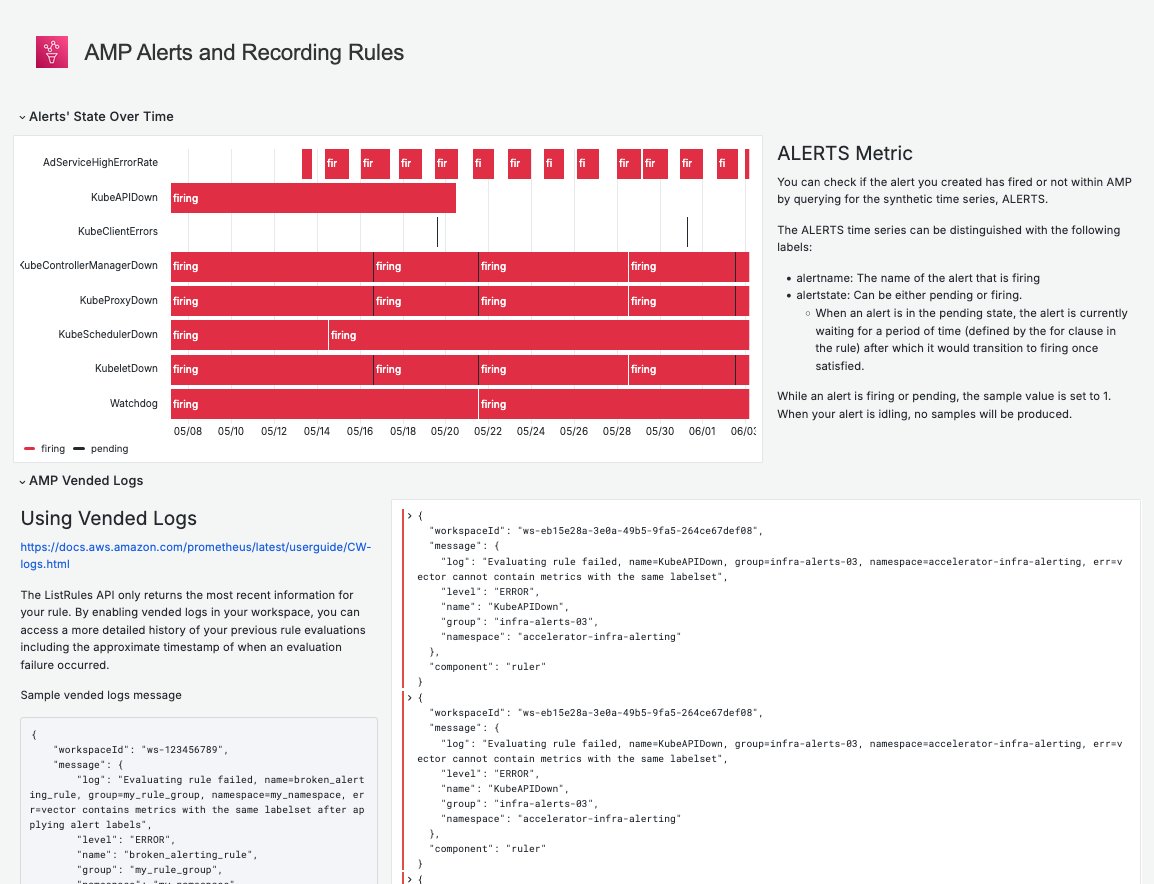
Figure 2: Alerts and Recording Rules dashboard
- Alerts’ State Over Time: This panel provides timeline visualization of alerts transitioning between states. It leverages filters with variables like:
- Alert: filter to the selected alert name, or all alerts
- State: filter to all alerts that are in the specified state, pending or firing
- Severity: filter to all alerts that are classified to the selected severity, such as critical
- Vended Logs: Here, we display detailed rule evaluation logs and failure messages. To reuse it, you will need to point it to your vended log groups, for example,
/aws/vendedlogs/prometheus/example-corp-workspace - Rule Groups’ Metrics: This monitors the Amazon Managed Service for Prometheus recording rule evaluation health and performance metrics, leveraging CloudWatch metrics including:
AWS/Prometheus:RuleEvaluations,AWS/Prometheus:RuleEvaluationFailures,AWS/Prometheus:RuleGroupIterationsMissed
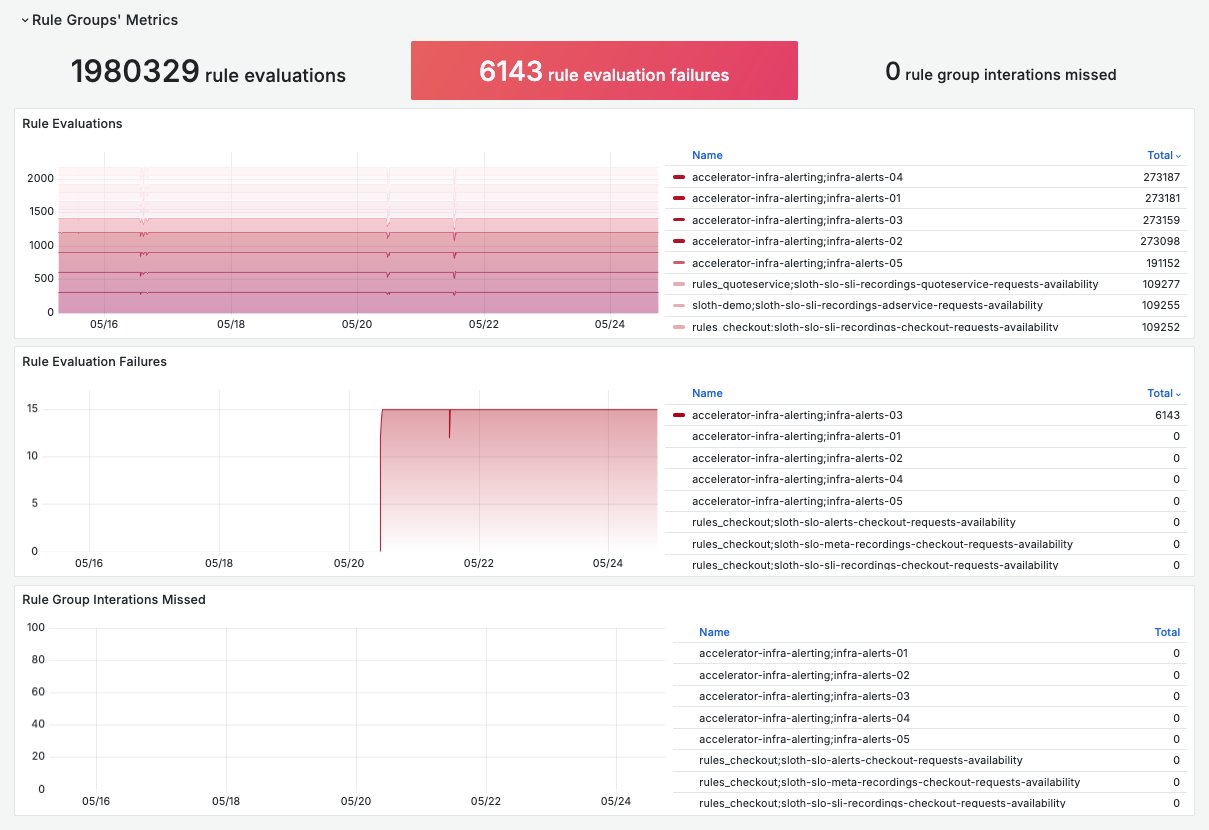
Figure 3: Alerts and Recording Rules dashboard – Rule Groups’ Metrics row
To complete the experience of visualizing and troubleshooting alerts in Amazon Managed Grafana, consider configuring the AlertManager datasource.
An Example of Troubleshooting Production Alerts using the Dashboard
The engineering teams from Example Corp started configuring recording and alerting rules for their applications and infrastructure at scale. But after a while, one of these teams started complaining they couldn’t visualize their rules metrics in Amazon Managed Grafana, and the alerts depending on these rules weren’t being triggered at all. To understand why each of these problems were happening, the observability team confirmed the recording rules were configured in Amazon Managed Service for Prometheus:
- Accessed the Alerts and Recording Rules Dashboard and examined the alert state by selecting the proper values for the Alert and Severity variables and checking the Alerts’ State Over Time row.
- Expanded the time range and found that the alerts never triggered. After that, they found in the Rule Evaluation Failures an indication that a recording rule was constantly failing.
- By checking the AMP Vended Logs row, confirmed the failing rule belonged to that team and concluded there was something wrong with the recording rule query, causing an error.
- Copied the rule query and executed it in the Explore tab, confirming it was broken. They then reached out to the team, that was able to fix the query and get their alerts to work properly.
Cleanup
To remove the resources created in this tutorial, follow these steps:
1. Delete AlertManager Configuration
aws amp delete-alert-manager-definition \
  --workspace-id <your-workspace-id>
2. Delete Rule Groups Namespace
aws amp delete-rule-groups-namespace \
  --workspace-id <your-workspace-id> \
  --name my-rules-namespace
3. Delete CloudWatch Log Group
aws logs delete-log-group \
  --log-group-name "/aws/vendedlogs/prometheus/example-corp-workspace" \
  --region <REGION>
4. Remove SNS Topic (if created specifically for this tutorial)
aws sns delete-topic \
  --topic-arn "arn:aws:sns:region:account-id:your-topic-name"
5. Clean up IAM Roles and Policies
Remove any IAM roles and policies created specifically for AlertManager SNS integration.
6. Delete Secrets Manager Secret (if using PagerDuty)
aws secretsmanager delete-secret \
  --secret-id <YOUR_SECRET_NAME> \
  --force-delete-without-recovery
Note: Be careful when deleting resources. Ensure you’re only removing resources created for this tutorial and not production resources.
Conclusion
In this blog, we explored how Example Corp leverages alerting best practices in Amazon Managed Service for Prometheus to monitor their containerized workloads at scale. We demonstrated how organizations can implement comprehensive alerting strategies through recording and alerting rules, utilize AlertManager for efficient notification routing, and leverage vended logs and CloudWatch metrics for monitoring visibility. We showed how teams can mitigate alerting fatigue while maintaining effective incident response capabilities. These alerting practices provide visibility into application health and enable proactive issue detection. As containerized environments grow in complexity, these alerting best practices become increasingly crucial for maintaining high availability and operational excellence. To learn more about AWS Observability, checkout the AWS Observability Best Practices Guide. To get hands-on experience with AWS Observability services, check out the One Observability Workshop.