AWS Cloud Financial Management
Streamline AWS cost analytics with new customized Billing and Cost Management Dashboards
Today, we’re excited to announce the general availability of Billing and Cost Management Dashboards, a new feature within AWS Billing and Cost Management that allows you to display multiple views of billing and cost data in a single page. With Billing and Cost Management Dashboards, you can create customized views combining data from AWS Cost Explorer and commitment coverage and utilization, helping you discover spending patterns and correlations to make data-driven financial decisions. You can also share your dashboards across accounts, enabling your FinOps teams to establish common cost reporting practices throughout their organization.
Why should you use Billing and Cost Management Dashboards?
As your organization builds more applications on AWS, many customers need to review and analyze multiple metrics simultaneously to make comparisons, understand trends, and identify outliers. Billing and Cost Management Dashboards allow you to:
- Combine multiple visualizations in a single view to identify correlations and trends.
- Create and save custom dashboards for frequent analyses.
- Share dashboards across accounts to establish common reporting practices.
Key features of the dashboard?
Billing and Cost Management Dashboards delivers several key capabilities:
Customized Dashboards: You can create custom dashboards by adding multiple widgets. Each widget serves as a self-contained visualization component that you can configure and add to your dashboards to display data as either graphs or tables. These widgets can be combined in a single dashboard to help you discover correlations and make data-driven financial decisions. For instance, you might create a dashboard to track your cost optimization efforts by combining charts showing Savings Plans coverage and utilization alongside Amazon Elastic Compute Cloud (Amazon EC2) Spot and On-Demand spend by application. You can customize dashboard layout by adjusting widget sizes and positions to create your ideal view.
Multiple Widget Types: You can create dashboards using various widget types:
Custom Widgets: These are atomic widgets that you can customize to serve your reporting needs.
- Cost widget: This provides visualization of cost data and can be used as an example to track spending patterns across different services
- Usage widget: This visualizes your aggregate usage across all AWS services and helps you monitor overall resource consumption
- Savings Plans Utilization and Coverage widget: The utilization widget helps you visualize the percentage of your Savings Plans commitments you are utilizing across your applicable usage. The coverage widget shows what percentage of your applicable AWS usage costs are being covered by your Savings Plans during your selected time period.
- Reserved Instance Utilization and Coverage widget: The utilization widget helps you visualize the percentage of your Reserved Instances you are utilizing across your applicable usage. The coverage widget shows what percentage of your applicable AWS usage costs are being covered by your Reserved Instances during your selected time period.
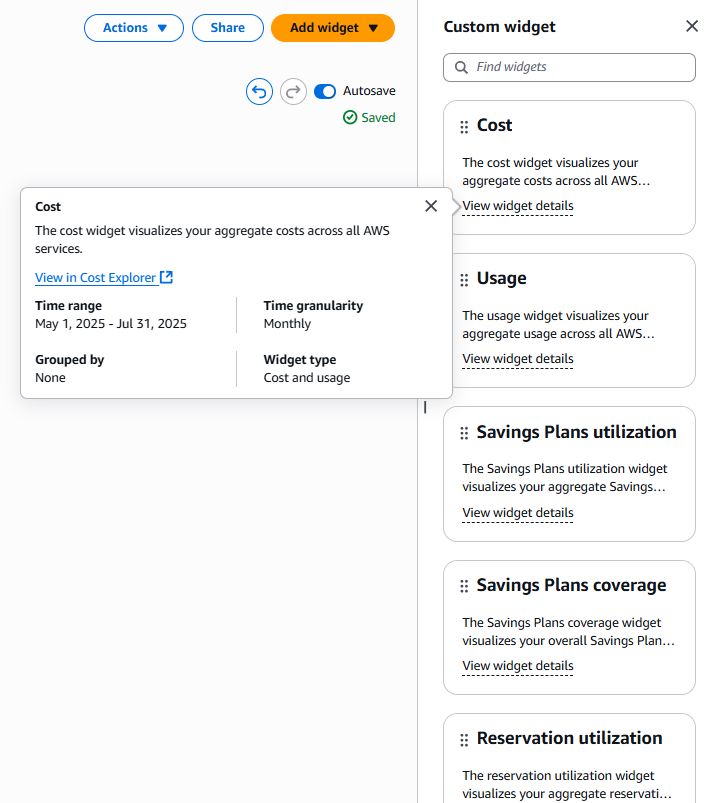
Figure 1. Screenshot of the custom widget options
Predefined Widgets: These are widgets that are meant to be used out of the box to serve common use cases such as reporting monthly service costs or daily costs. You can further customize these costs to serve your reporting needs.
- Monthly costs by service: This visualizes your aggregate monthly costs across all AWS services for the last six months.
- Monthly costs by linked account: This visualizes your aggregate monthly costs across all AWS linked accounts for the last six months.
- Monthly EC2 running hour costs: This visualizes your monthly Amazon EC2 running hour costs for the last six months.
- Daily costs: This visualizes your daily AWS costs for the last six months.
- AWS Marketplace costs: This visualizes your AWS Marketplace costs for the last six months
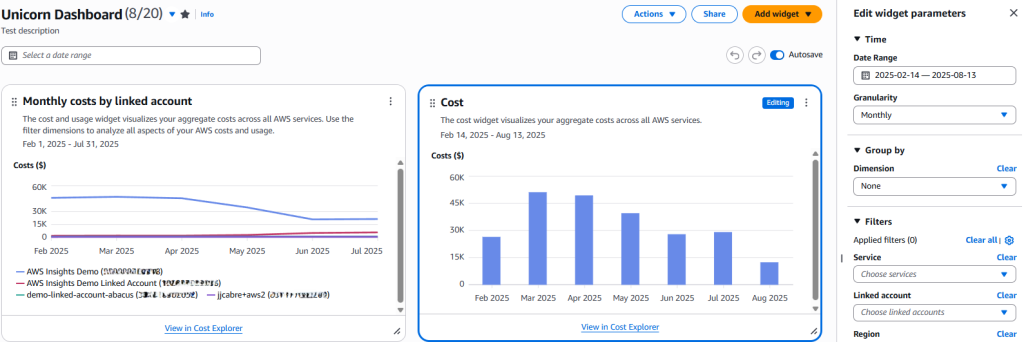
Figure 2. Sample Dashboard using predefined widgets for Unicorn, a fictional company
Flexible Layout Options: Each dashboard can contain up to 20 widgets, and you can customize the layout by adjusting widget sizes and positions to create your ideal view.
Sharing Capabilities: You can share dashboards across accounts within your AWS Organization or with external accounts using AWS Resource Access Manager (RAM). When sharing dashboards, you can set permissions as either “Can View” or “Can Edit” access. By sharing a dashboard you are not sharing any underlying cost related data with the recipient. You are only sharing the widget configuration (e.g. cost metrics and filters for each widget) and widget layout with the recipient. You can create a custom billing view to grant member accounts in your organization access to cost and usage views spanning multiple member accounts. The recipients will view the dashboards with same layout and filters but with data they have access to.
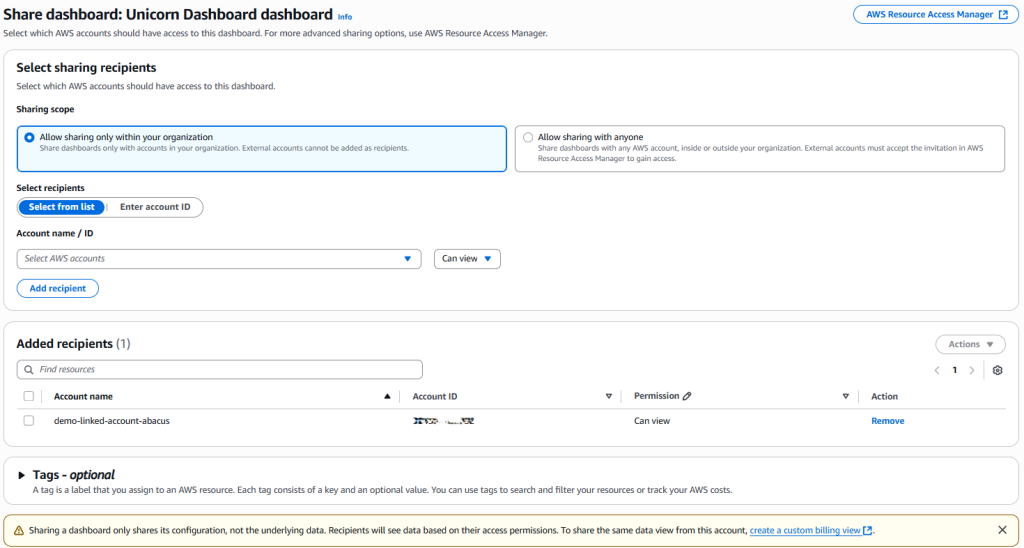
Figure 3. Screenshot of how to share the dashboard
How to get started?
Prerequisites:
Before getting started, you will need permissions to view, list, create, update and delete Dashboards and migrate to fine-grained access controls for AWS Cost Management. For more information, see Using identity-based policies (IAM policies) for AWS Cost Management. To use cost and usage related widgets, you need to enable AWS Cost Explorer.
You will need to use AWS Resource Access Manager (RAM) to share dashboards to other accounts in your organization. RAM allows you to securely share resources, such as Dashboards across AWS accounts. In order to share custom dashboards, you will need permissions to share Dashboards using AWS Resource Access Manager. For more information, see How AWS RAM works with IAM.
Create a new custom dashboard by following the user guide instructions. These dashboards are available at no additional charge. You can also programmatically create and manage dashboards using APIs – refer to the API Reference Guide for more details.
Conclusion
Billing and Cost Management Dashboards provide a powerful way to visualize and analyze your AWS costs while enabling better collaboration across your organization. To learn more, visit the documentation or get started today in the AWS Billing and Cost Management Console.