AWS Business Intelligence Blog
Manage your Amazon QuickSight datasets more efficiently with the new user interface
| All your trusted BI capabilities of Amazon QuickSight now come with powerful new AI features that integrate chat agents, deep research, and automation in one seamless experience with Amazon Quick Suite! Learn more » |
Amazon QuickSight has launched a new user interface for dataset management. Previously, the dataset management experience was a popup dialog modal with limited space, and all functionality was displayed in this one small modal. The new dataset management experience replaces the existing popup dialog with a full-page experience, providing a clearer breakdown of a dataset’s properties.
In this post, we walk through the end-to-end dataset management user experience.
Access the new UI
To get started, choose Datasets in the navigation pane on the QuickSight console, and choose any dataset that you want to manage.
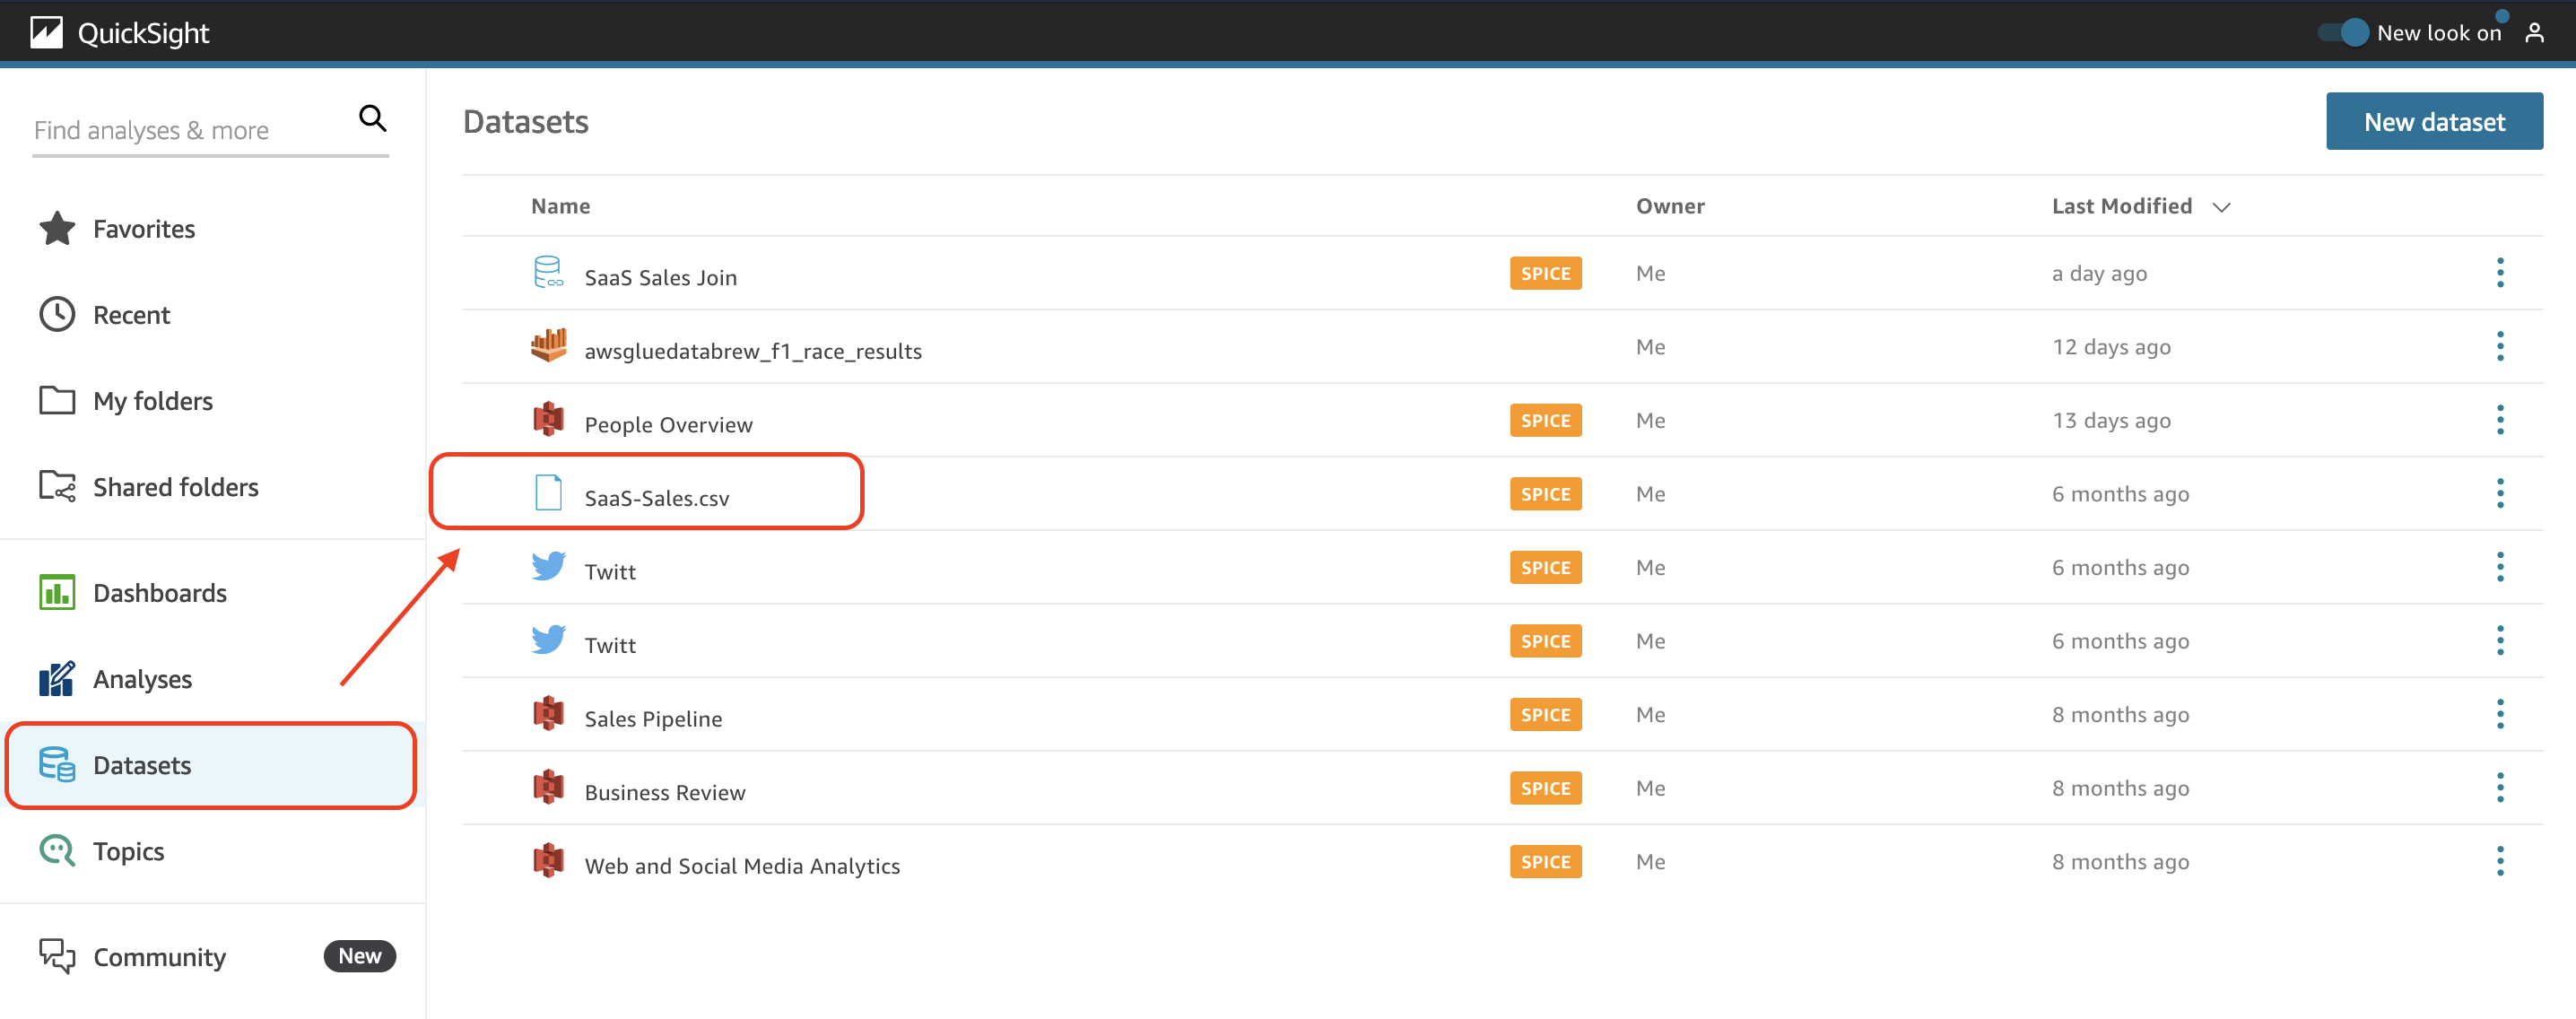
When you choose a dataset, you see the full-page dataset management UI. This new UI is divided into four main tabs: Summary, Refresh, Permissions, and Usage.
Use case overview
Let’s consider a fictional company, AnyCompany. They have used QuickSight for a long time and now have a large number of datasets that have to be managed. Among the datasets they use, they have a combination of Direct Query and SPICE modes. They need a unified view of each dataset, with details related to permissions, refreshes, and usage. Additionally, they need to be able to schedule when they want to refresh the data and have a history of all the successful and failed attempts of these updates.
The Summary tab
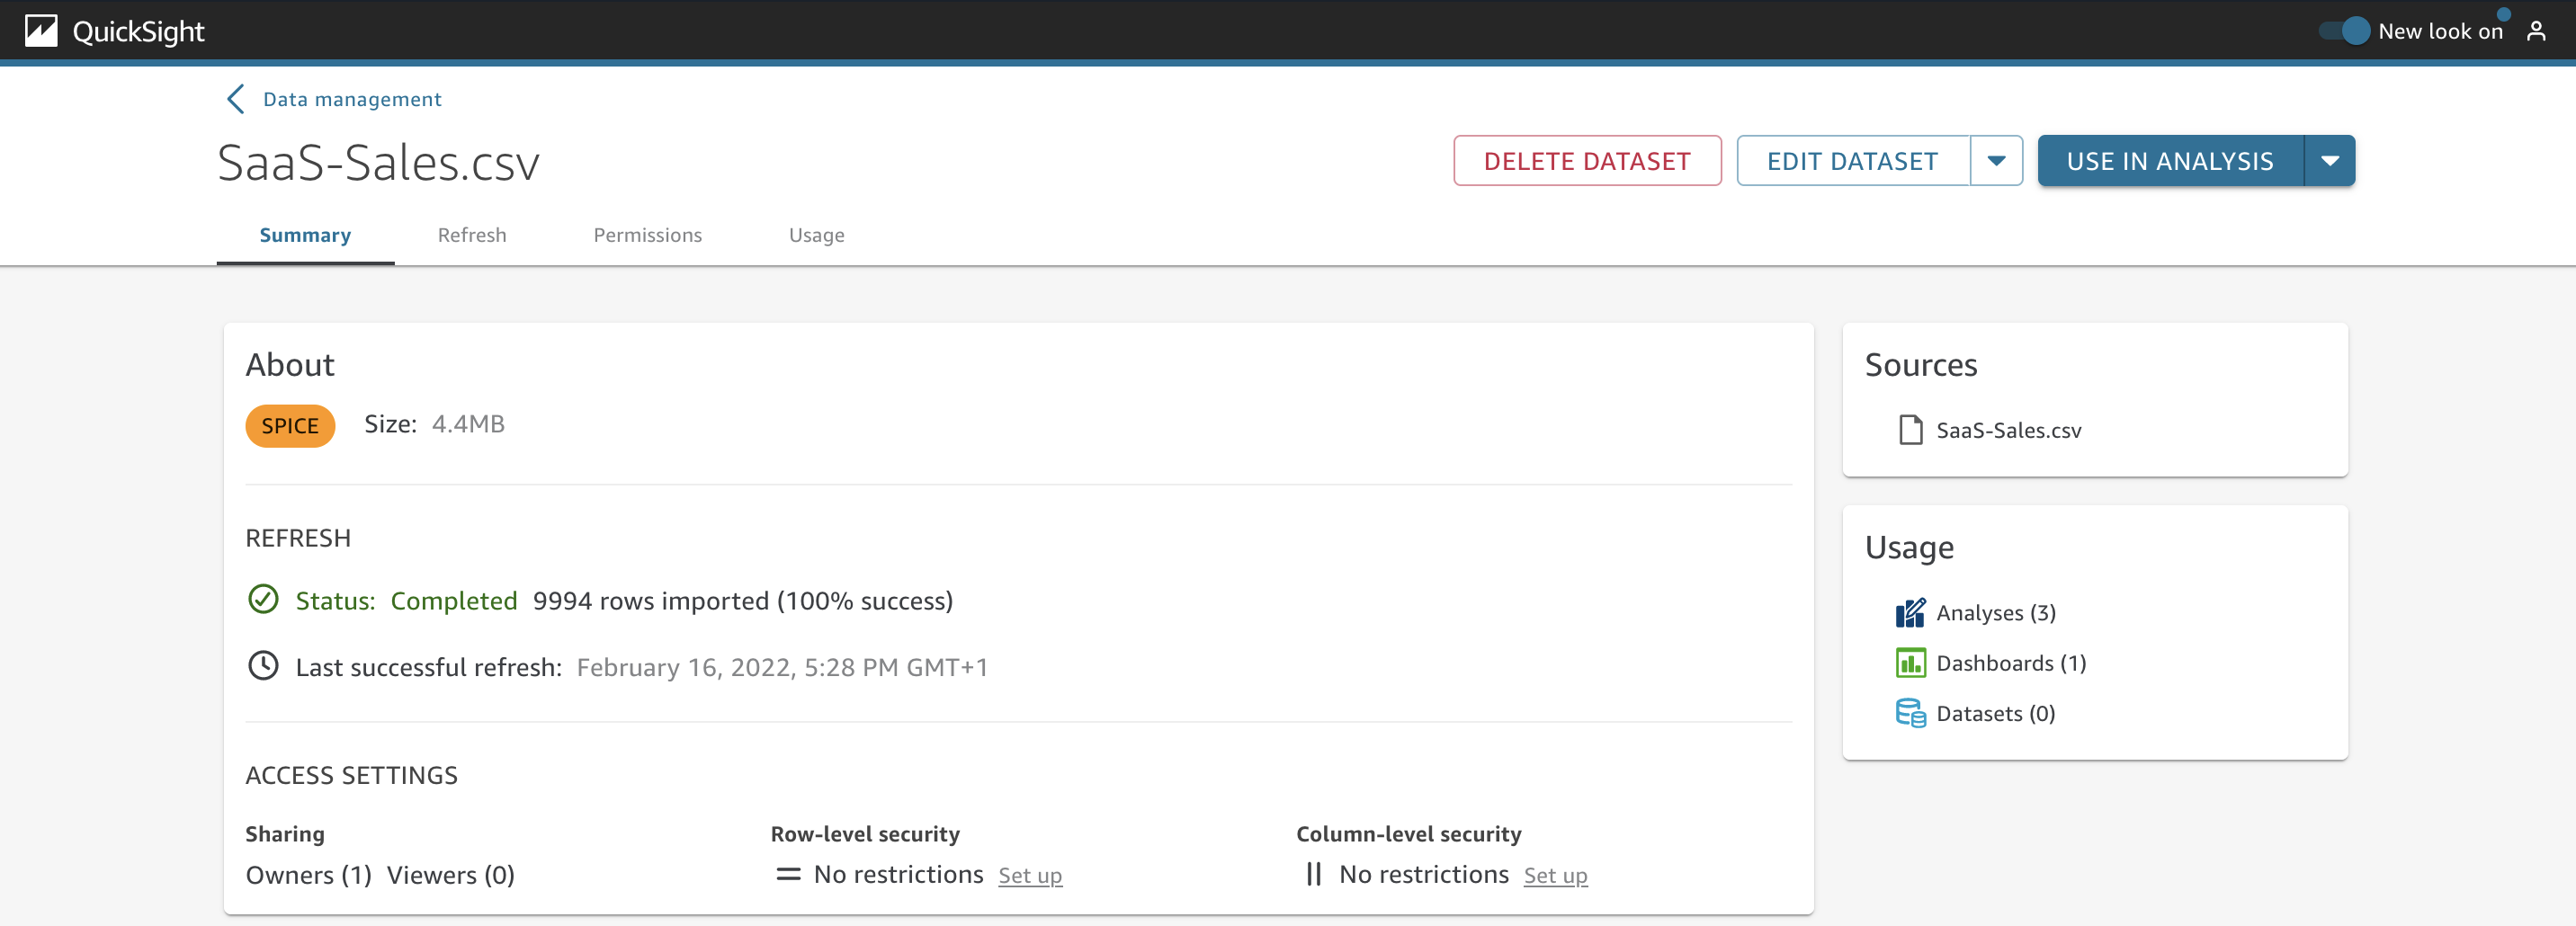
As a data analyst at AnyCompany, you need to review details about your datasets. You can find several options by navigating to the Summary tab.
The About section shows if the dataset is stored in SPICE or if it’s using Direct Query. If the dataset is stored in SPICE, you can also get the size of the dataset. If the dataset is using Direct Query, you can choose Set alert schedule to setup a schedule for when alerts on dashboards should be evaluated.
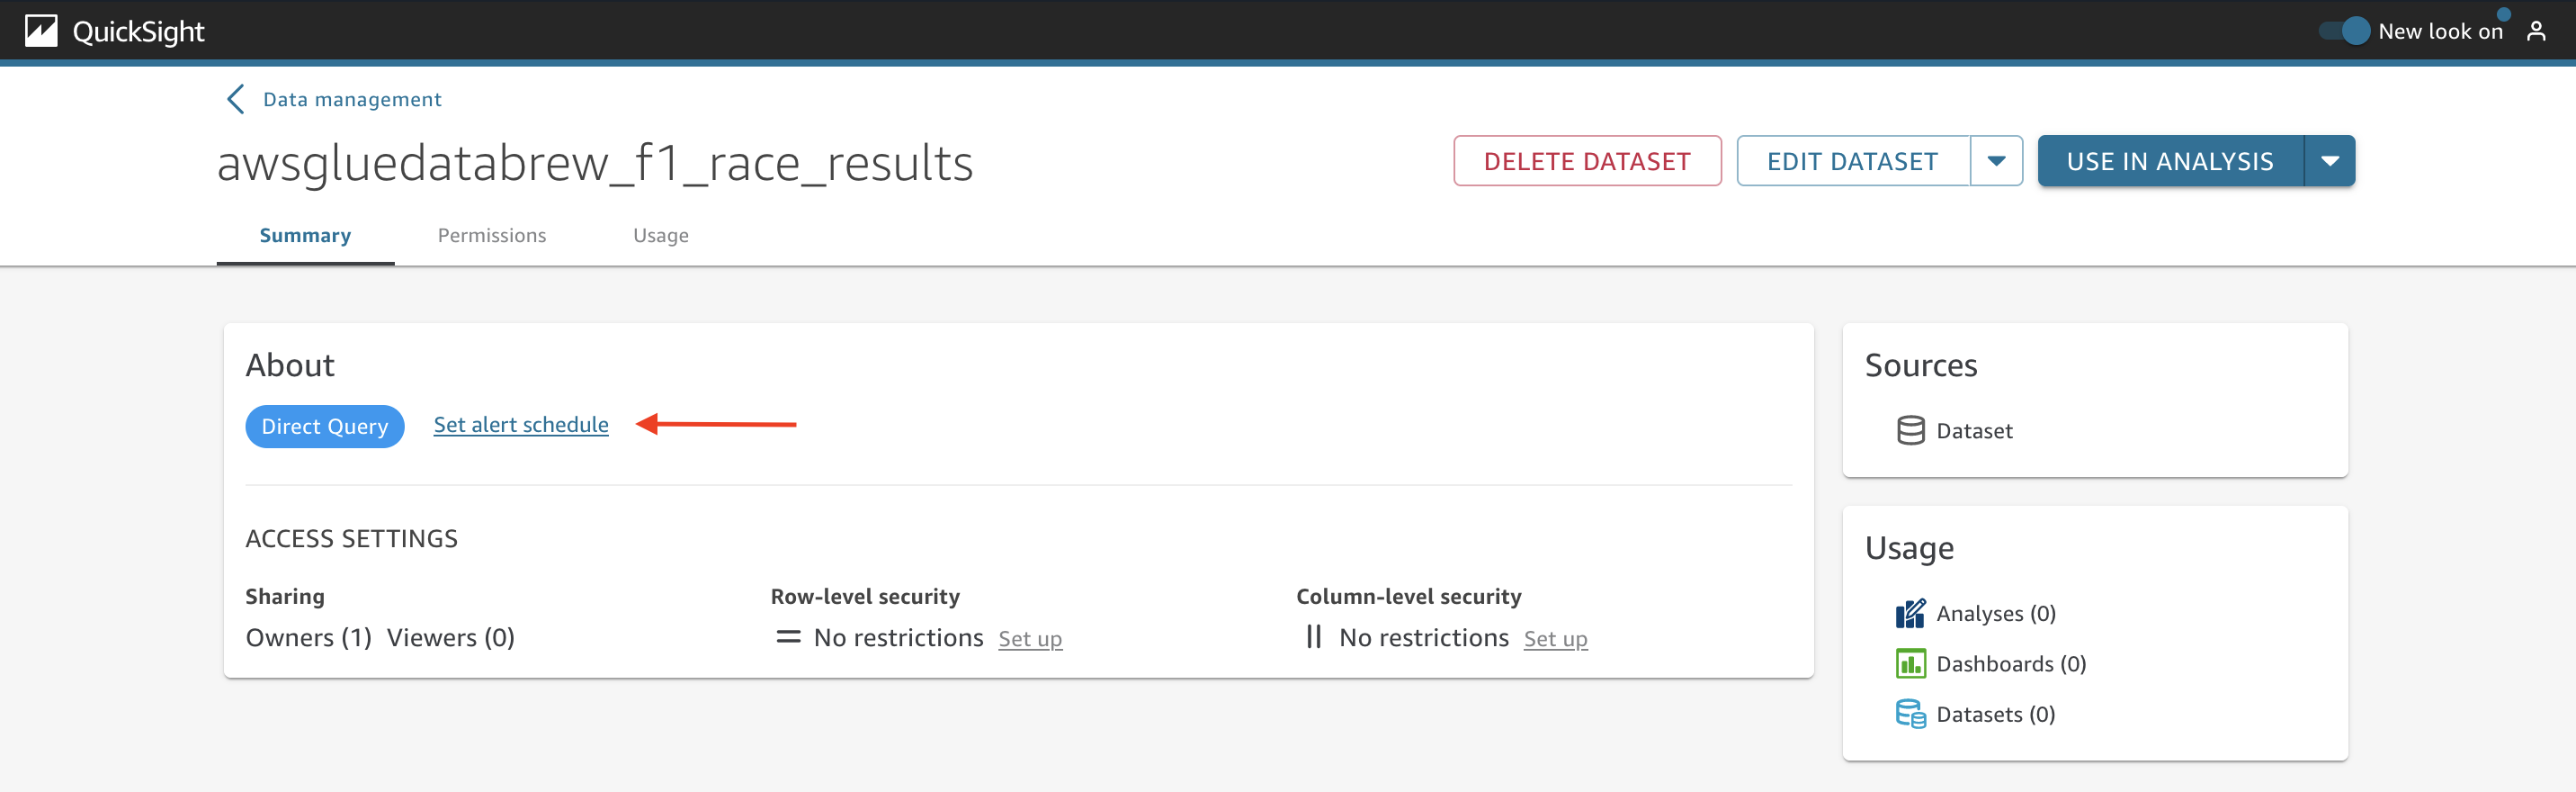
Specify the time zone, if you want to repeat it daily or hourly, and the start time.

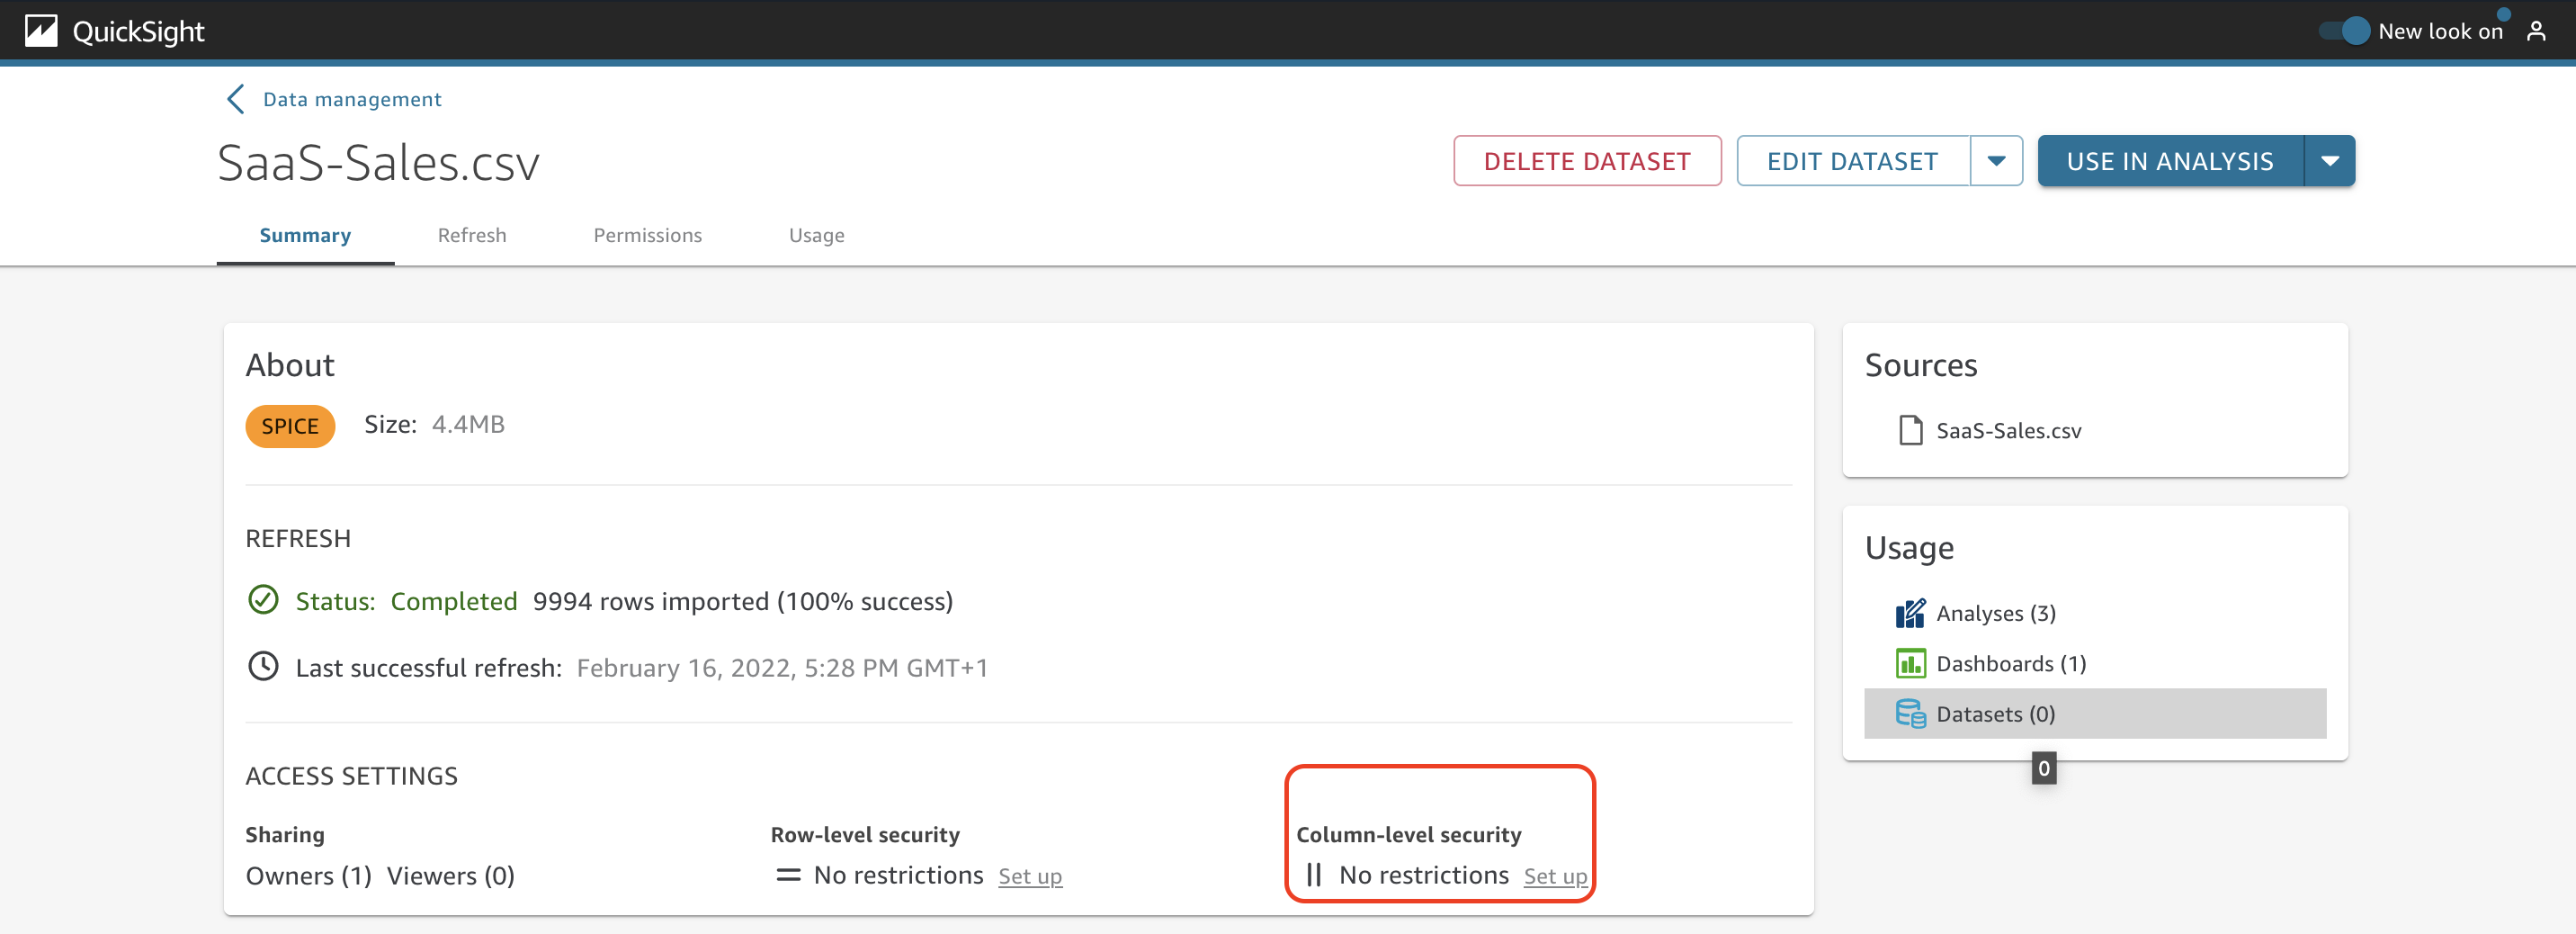
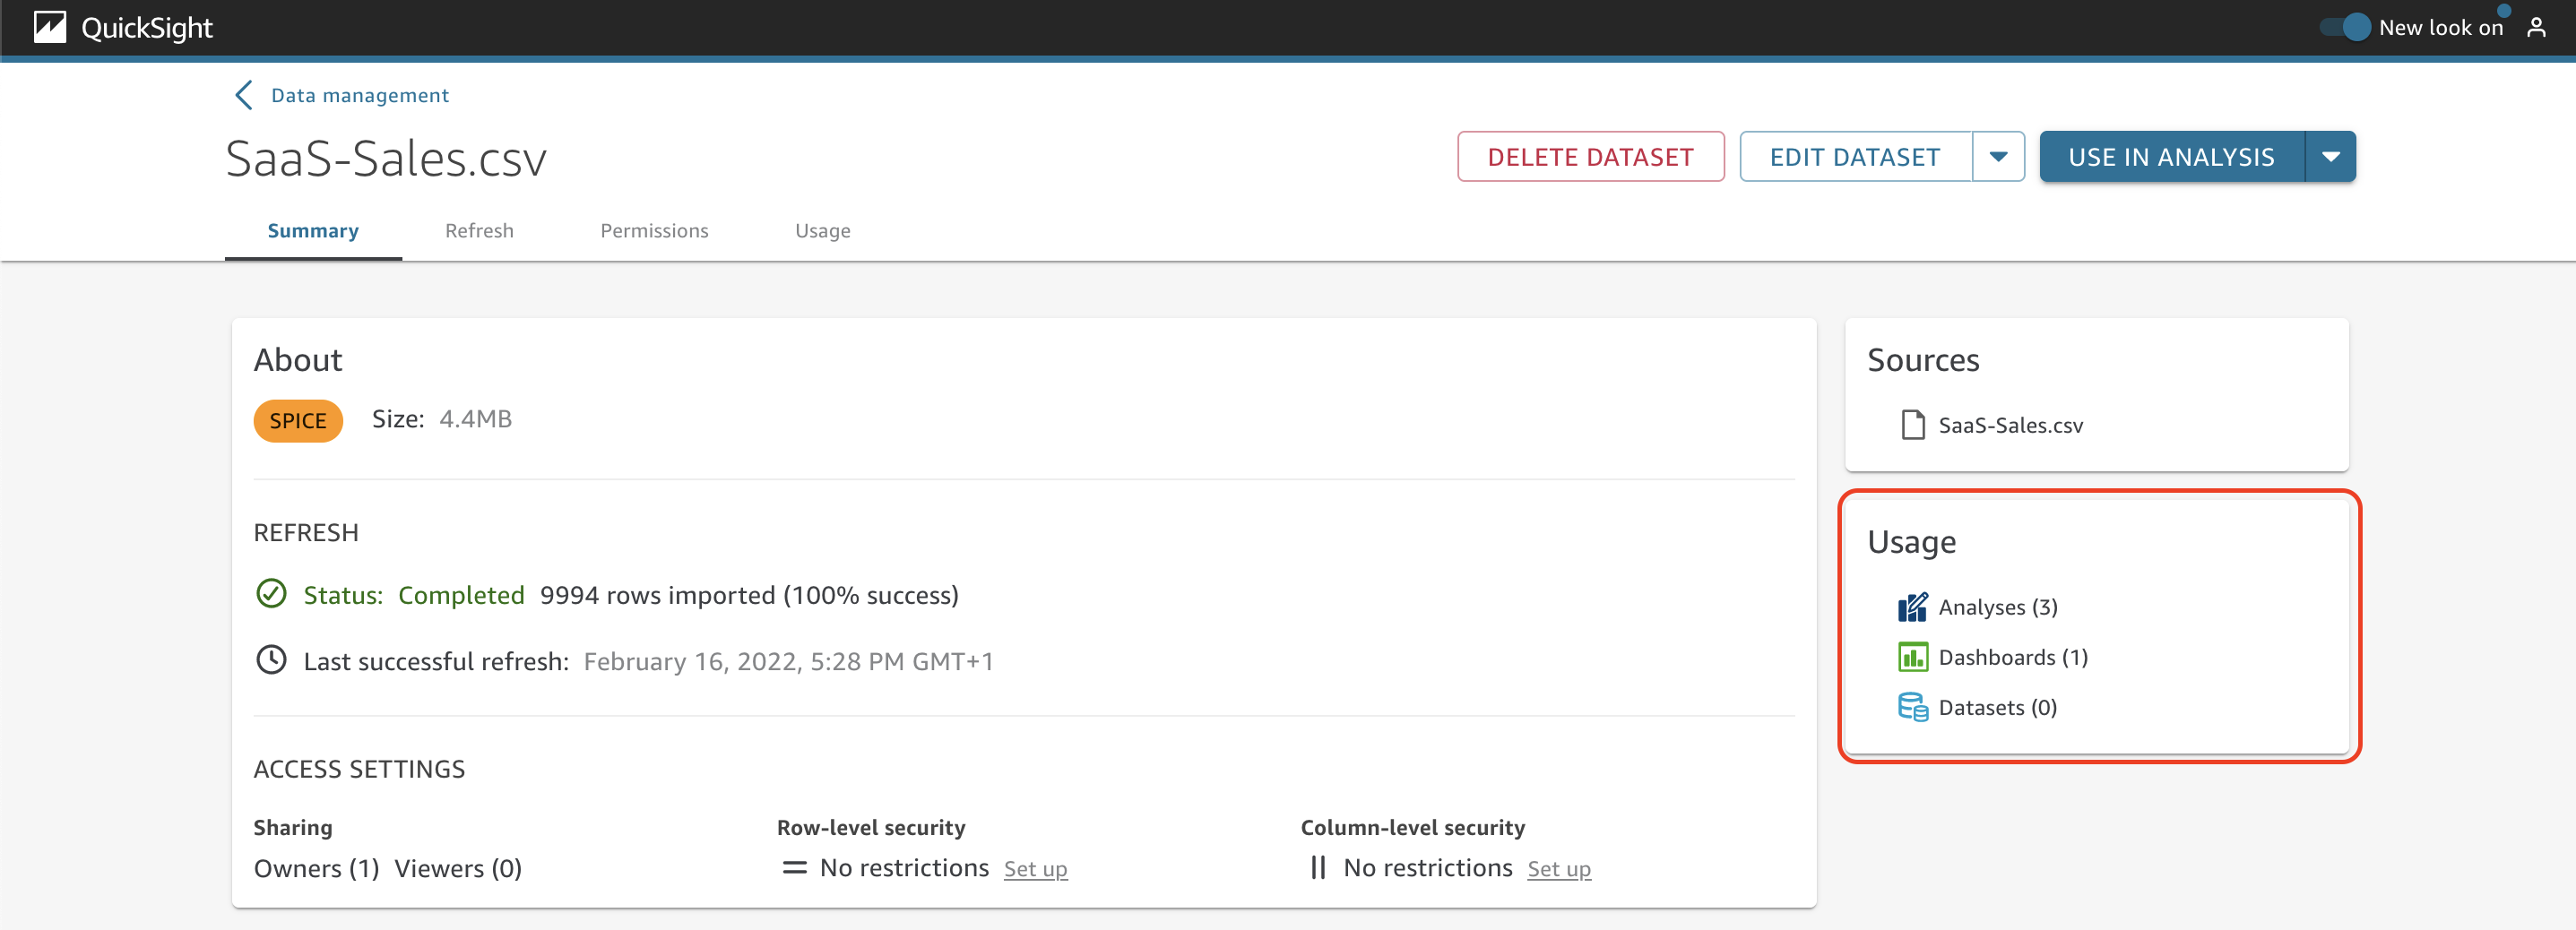
To continue exploring the dataset, choose a new dataset that is stored in SPICE. In the Refresh section, you can verify the status of the SPICE dataset and the last successful refresh date.

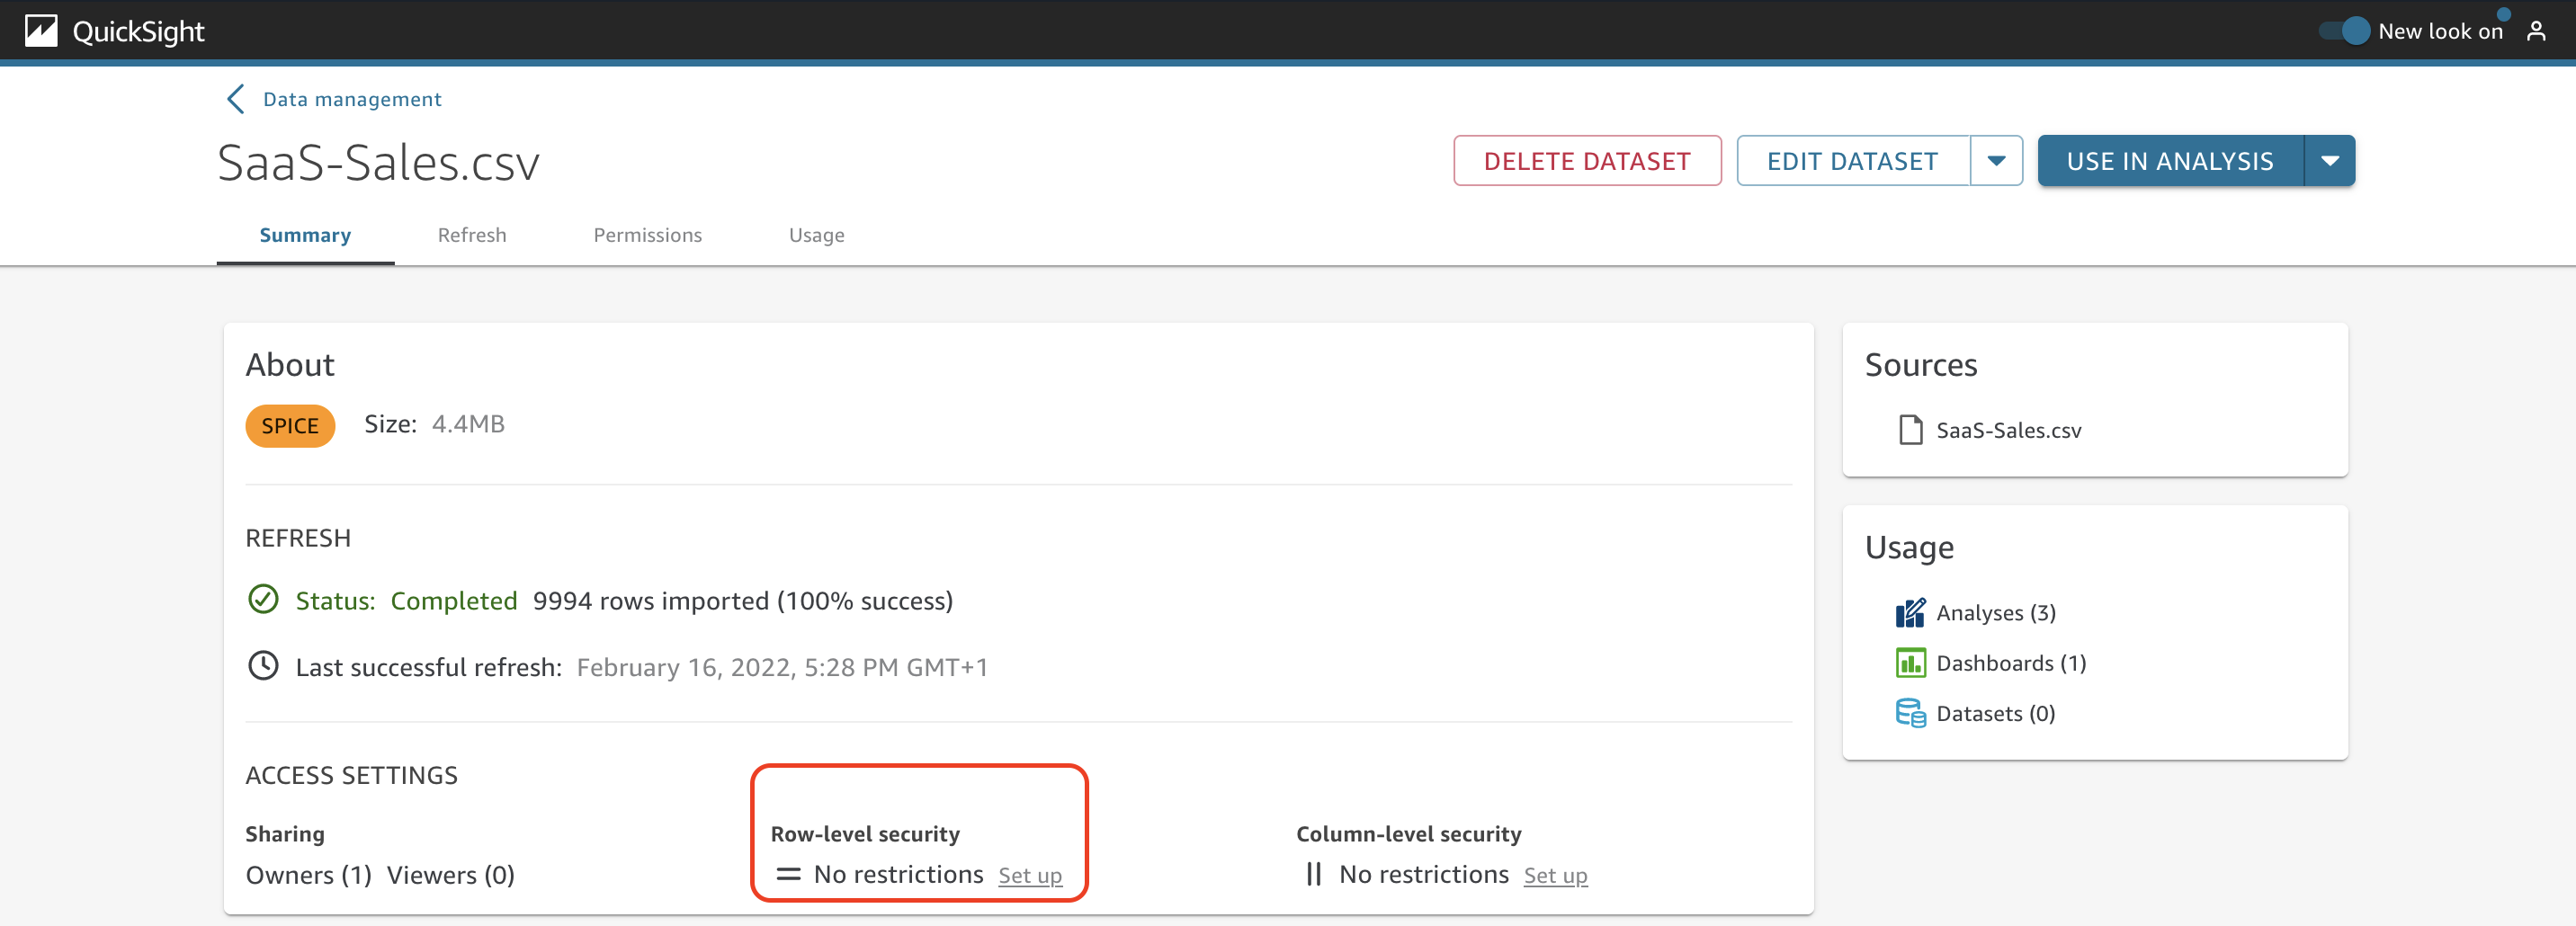
Under Access Settings, you can see details about how many owners and viewers this dataset has and also the options to enable row-level and column-level security.
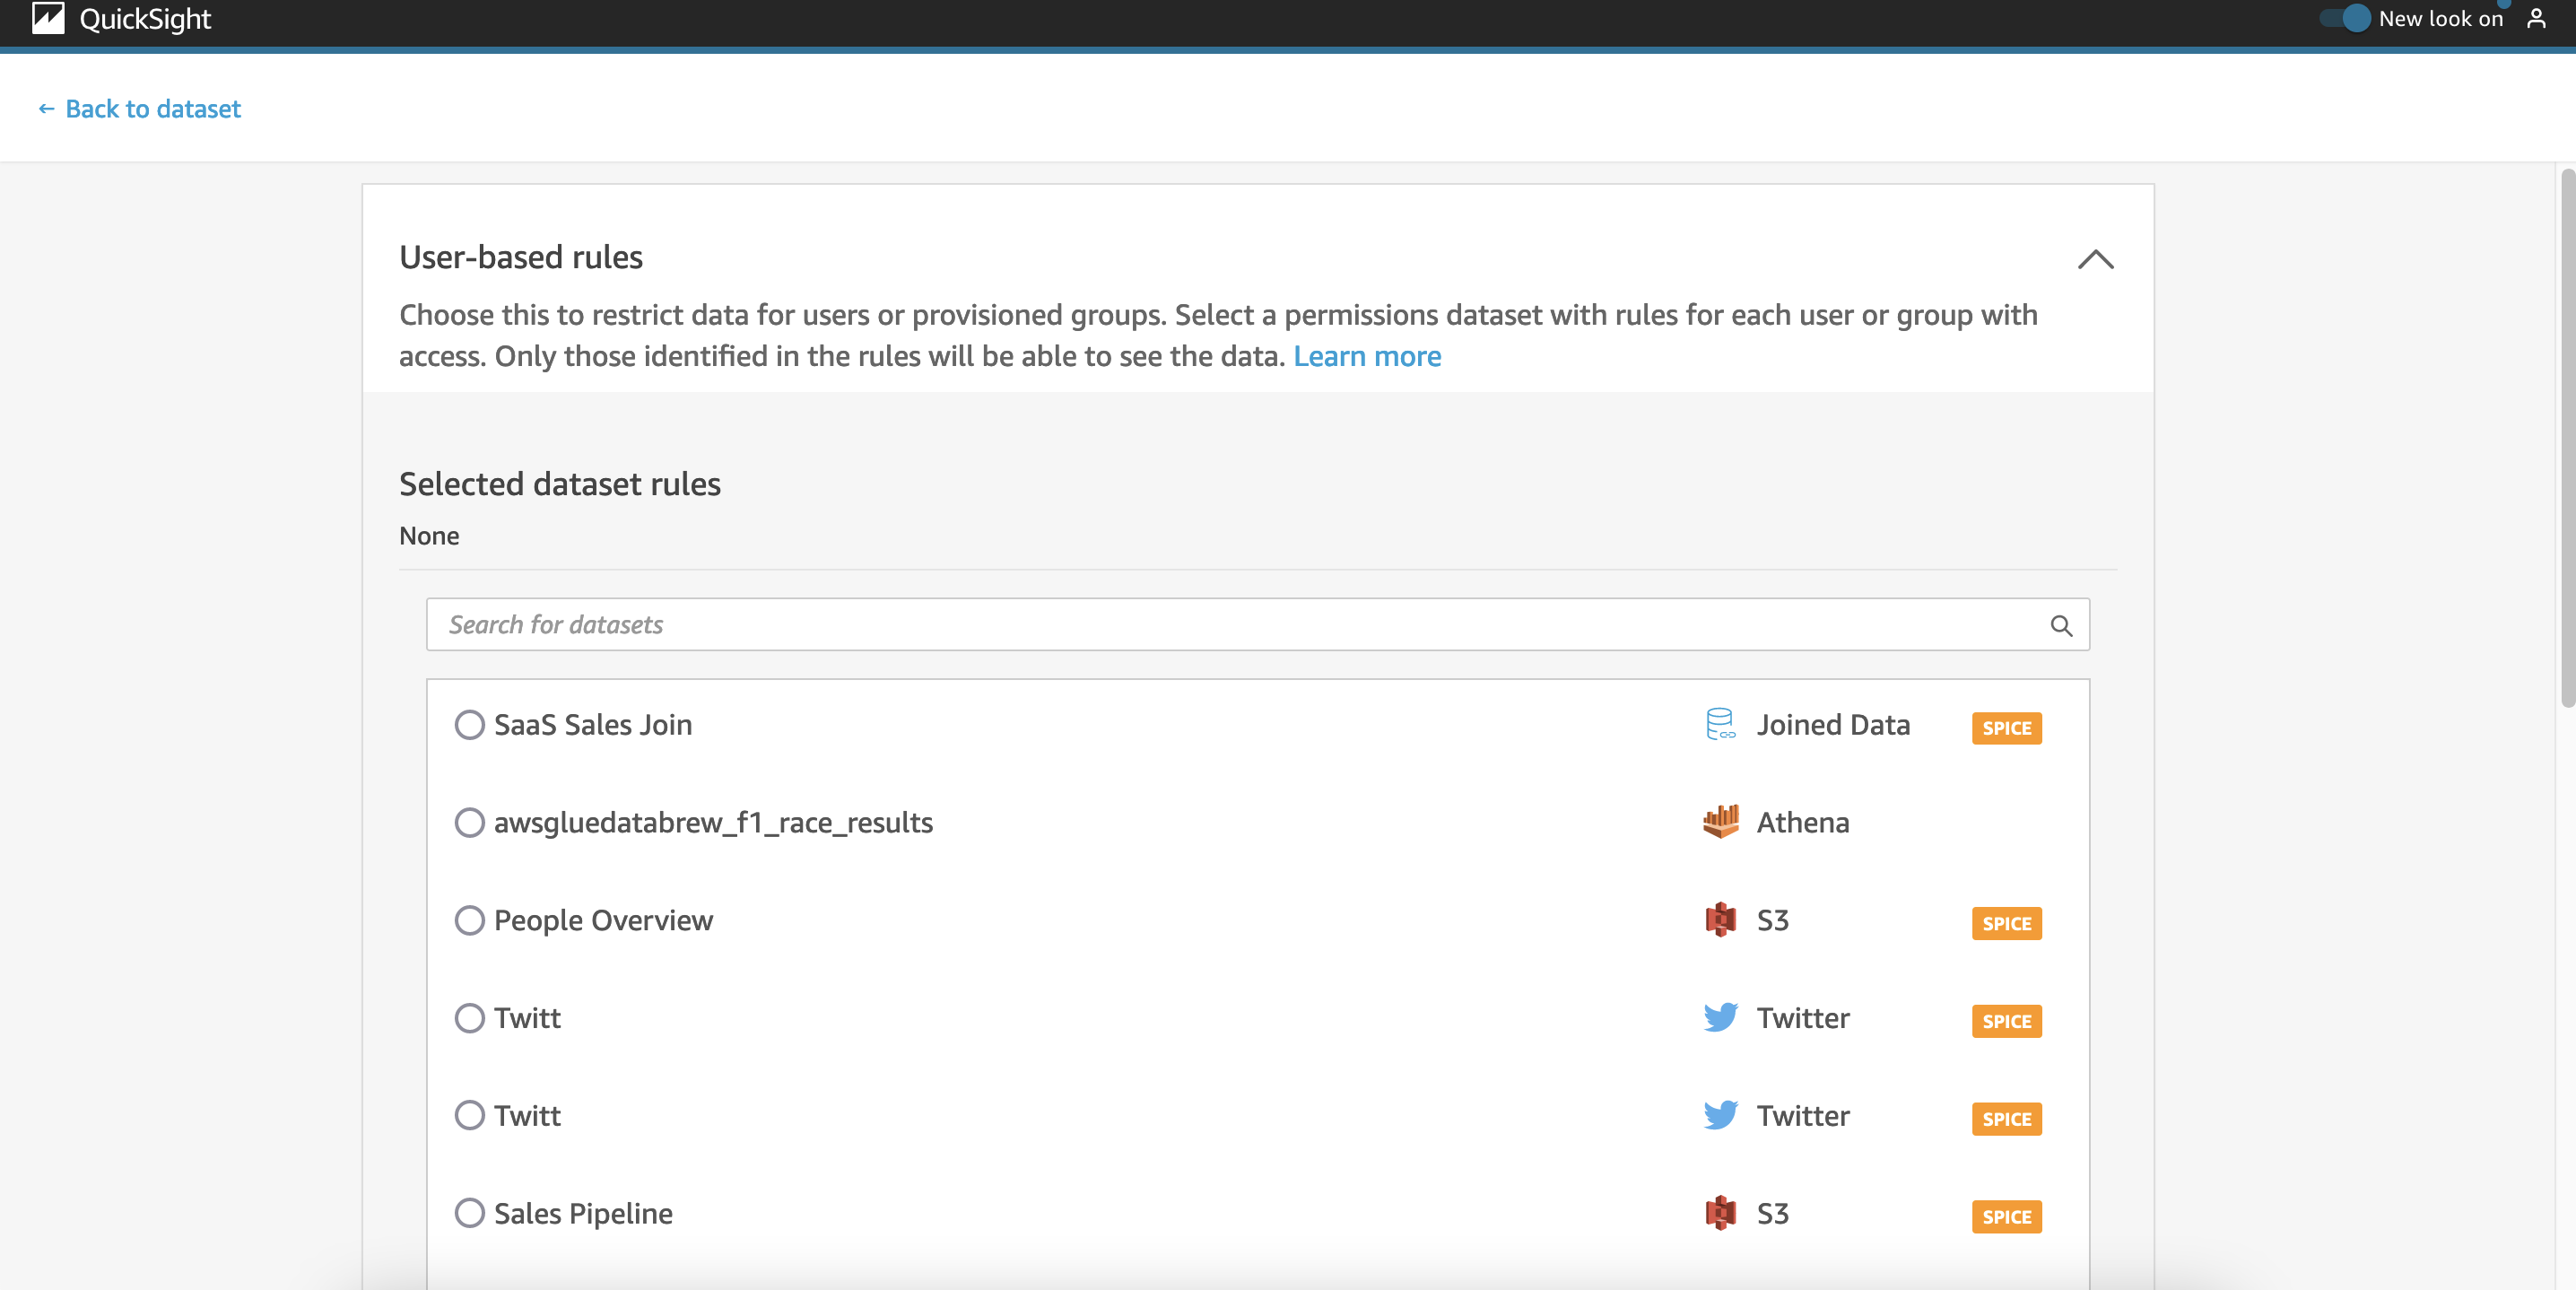
To add row-level security to this dataset, choose Set up under Row-level security.
Under User-based rules, select the permissions dataset with rules to restrict access for each user or group.
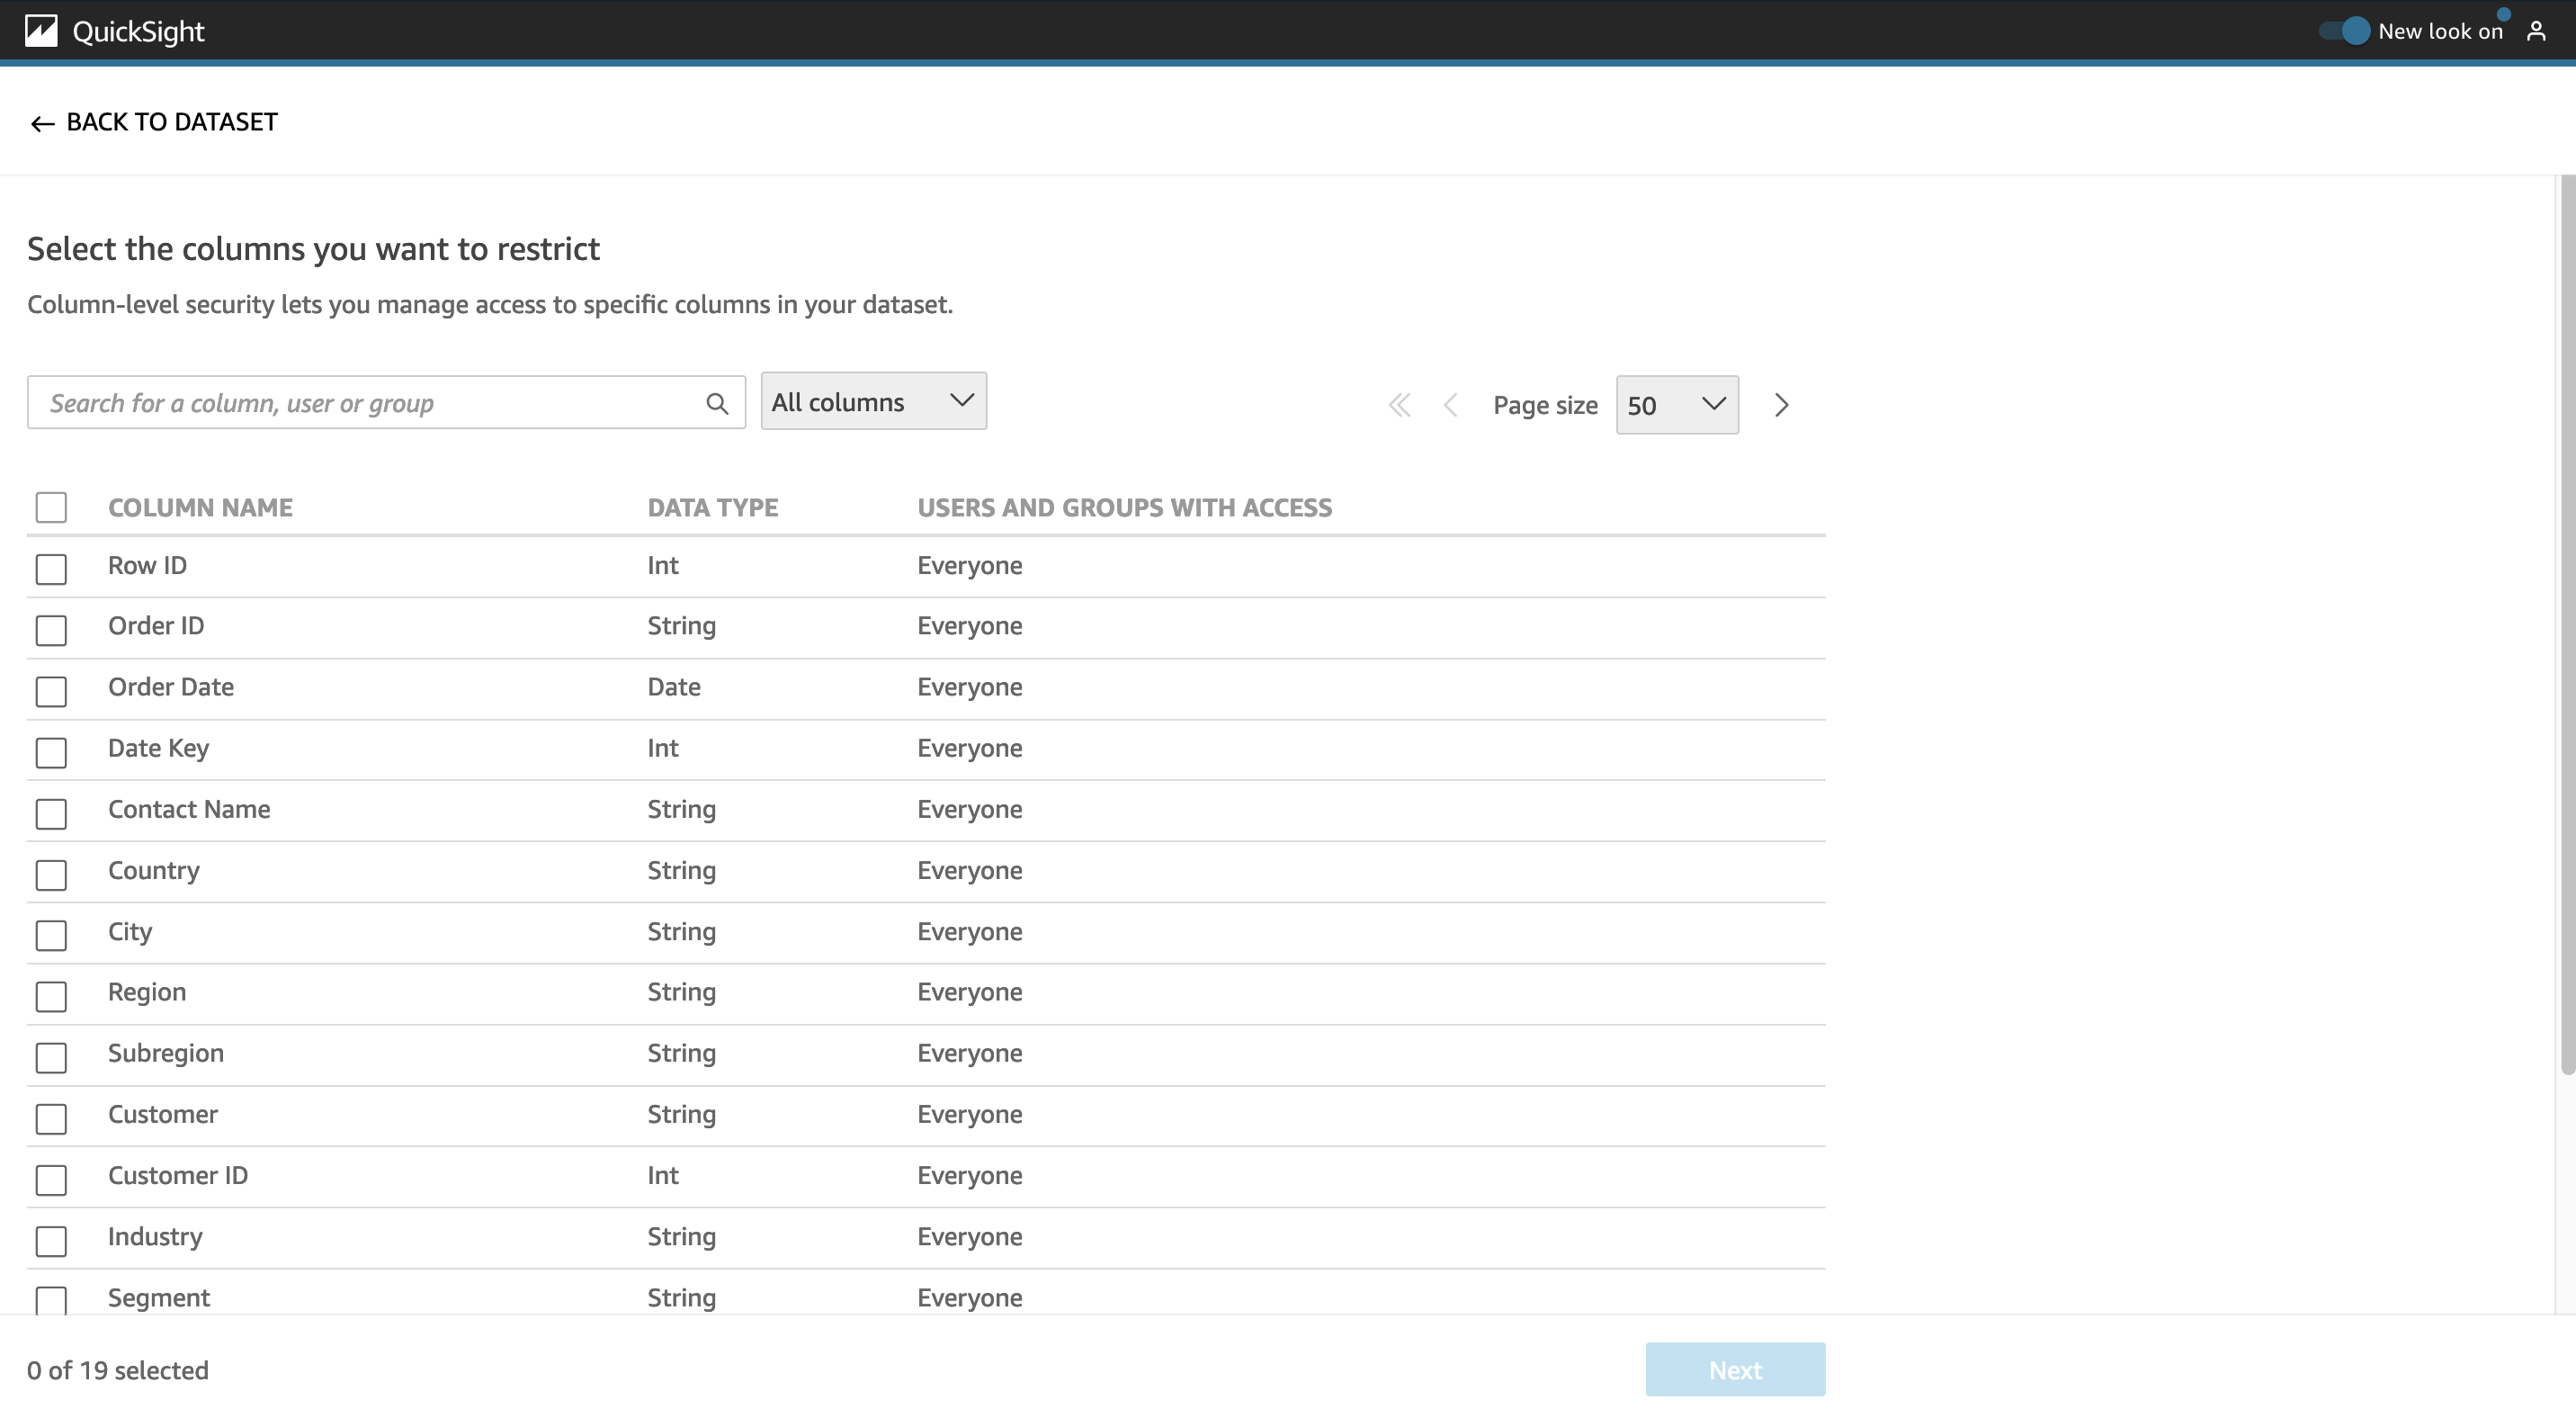
To apply column-level security, choose Set up under Column-level security.
Select the columns to be restricted and choose Next.
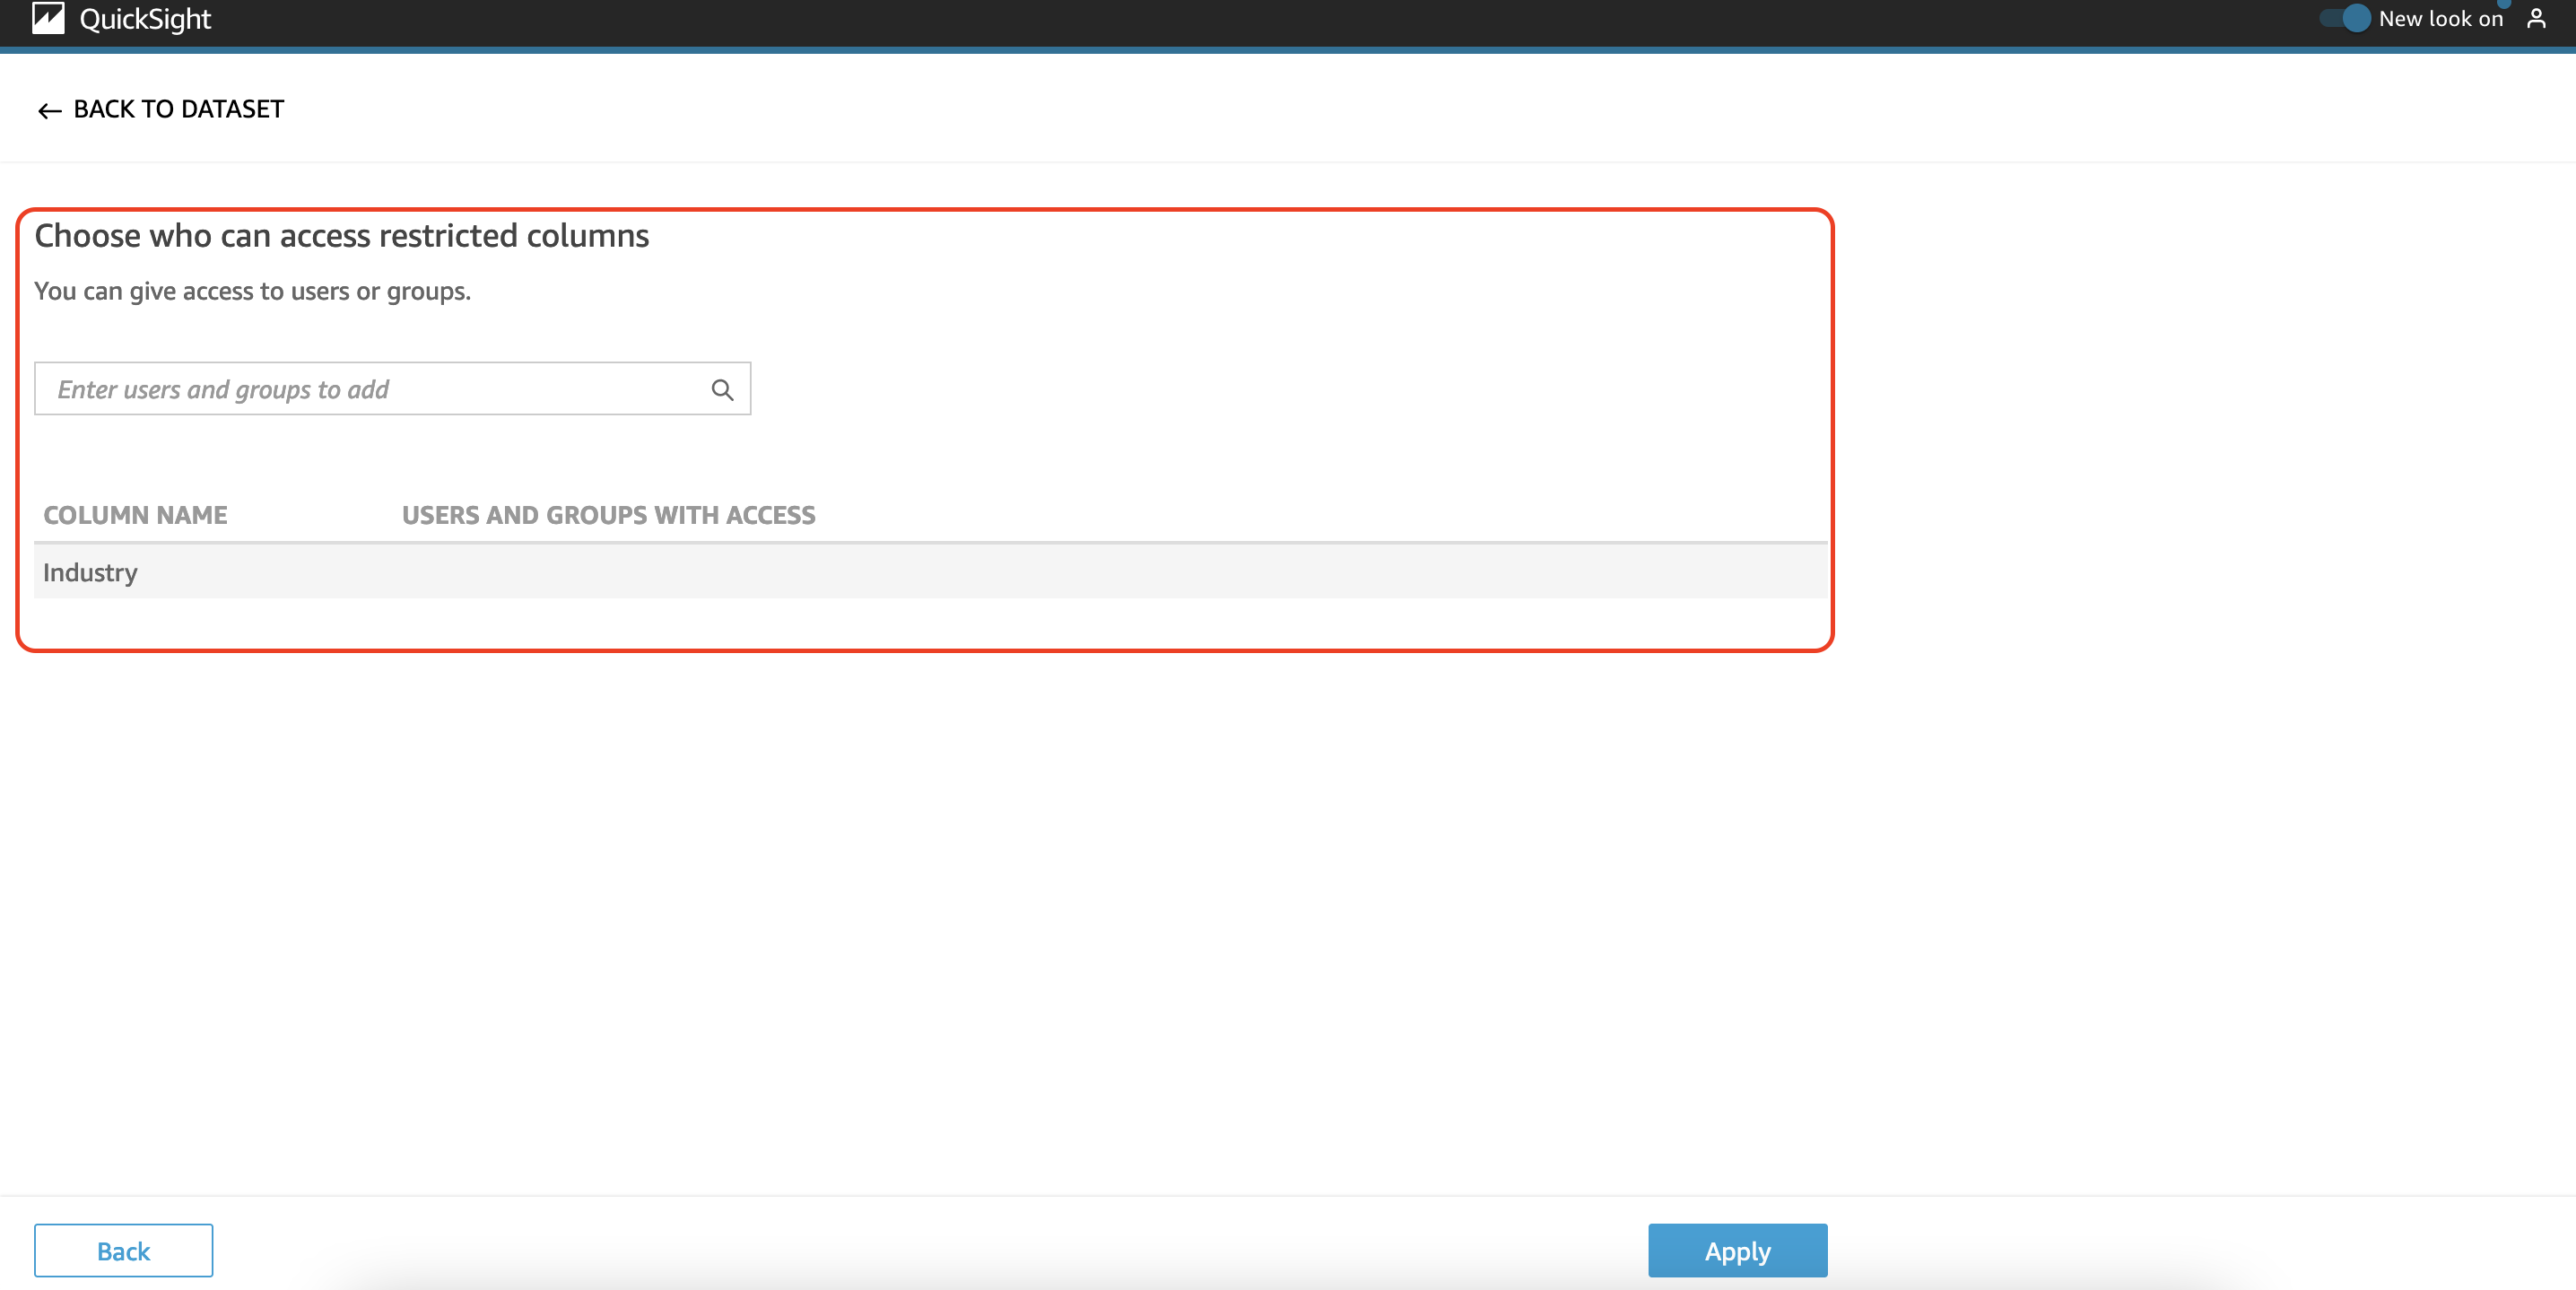
Choose who can access the restricted columns and choose Apply.
In the Sources section on the Summary tab, a list of data sources is displayed to show the ones used in this dataset. In the following example, we can see the sources SaaS Sales 2022.csv and SaaS-Sales-MonthlySummary.
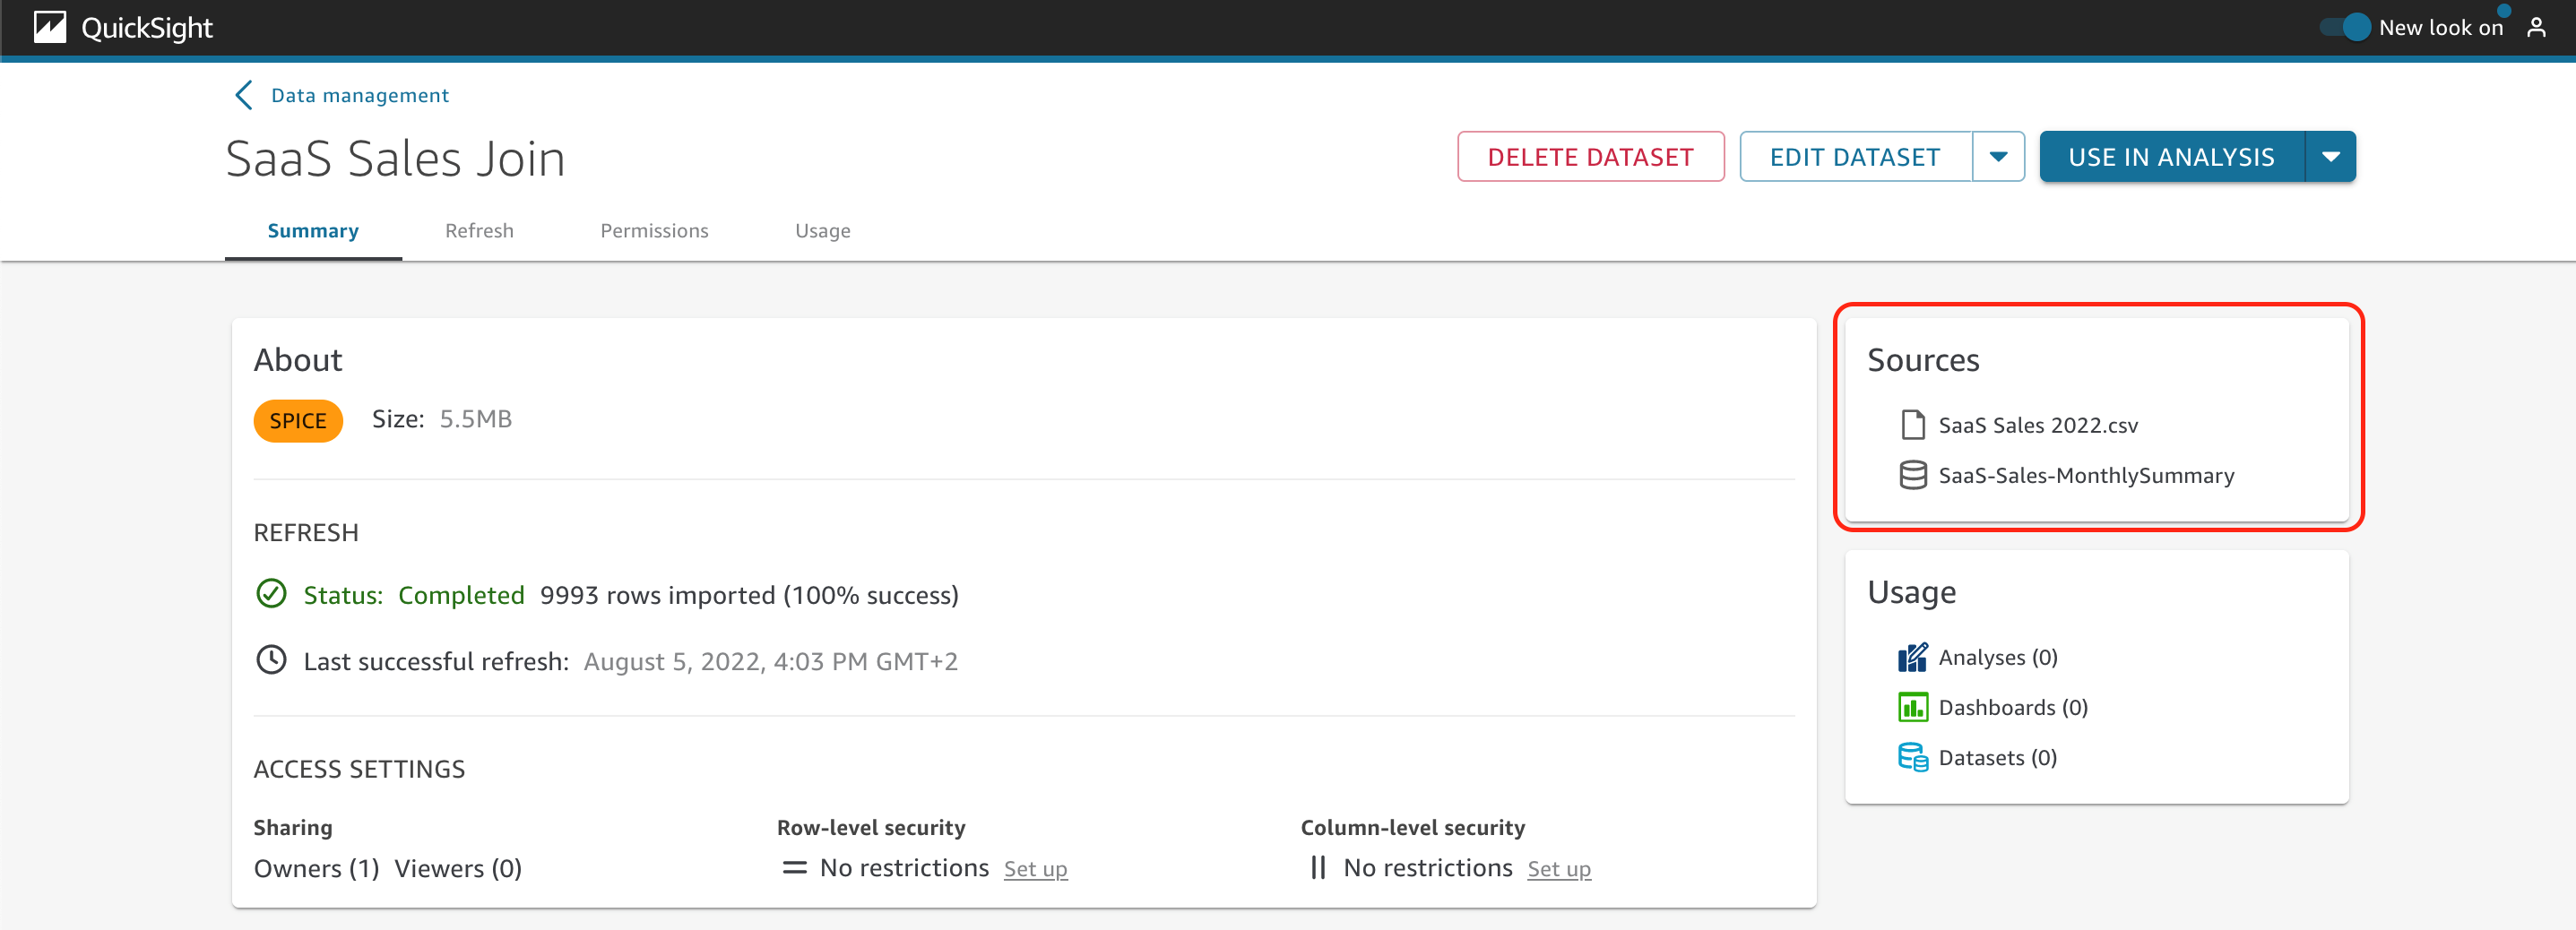
You also need to identify where (analysis, dashboards, or other datasets) the different datasets are being used, to determine if you can eliminate some unused ones.
To verify this, you just have to look at the Usage section (more details are on the Usage tab).
It’s also possible to go to the data prep interface by choosing Edit dataset or duplicate it by opening the drop-down menu.
You can also directly create a new analysis with this dataset or choose Use in dataset to take advantage of dataset as a source capability. When you use this option, any data preparation that the parent dataset contains, such as any joins or calculated fields, is kept. You can add additional preparation to the data in the new, child datasets, such as joining new data and filtering data. You can also set up your own data refresh schedule for the child dataset and track the dashboards and analyses that use it. Some of the advantages are: Central management of datasets, reduction of dataset management, predefined key metrics and flexibility to customize data.

The Refresh tab
At AnyCompany, you also need to refresh the latest data for your datasets. To achieve this, you have two different options.
You can choose Refresh now to manually get the latest records in the dataset.
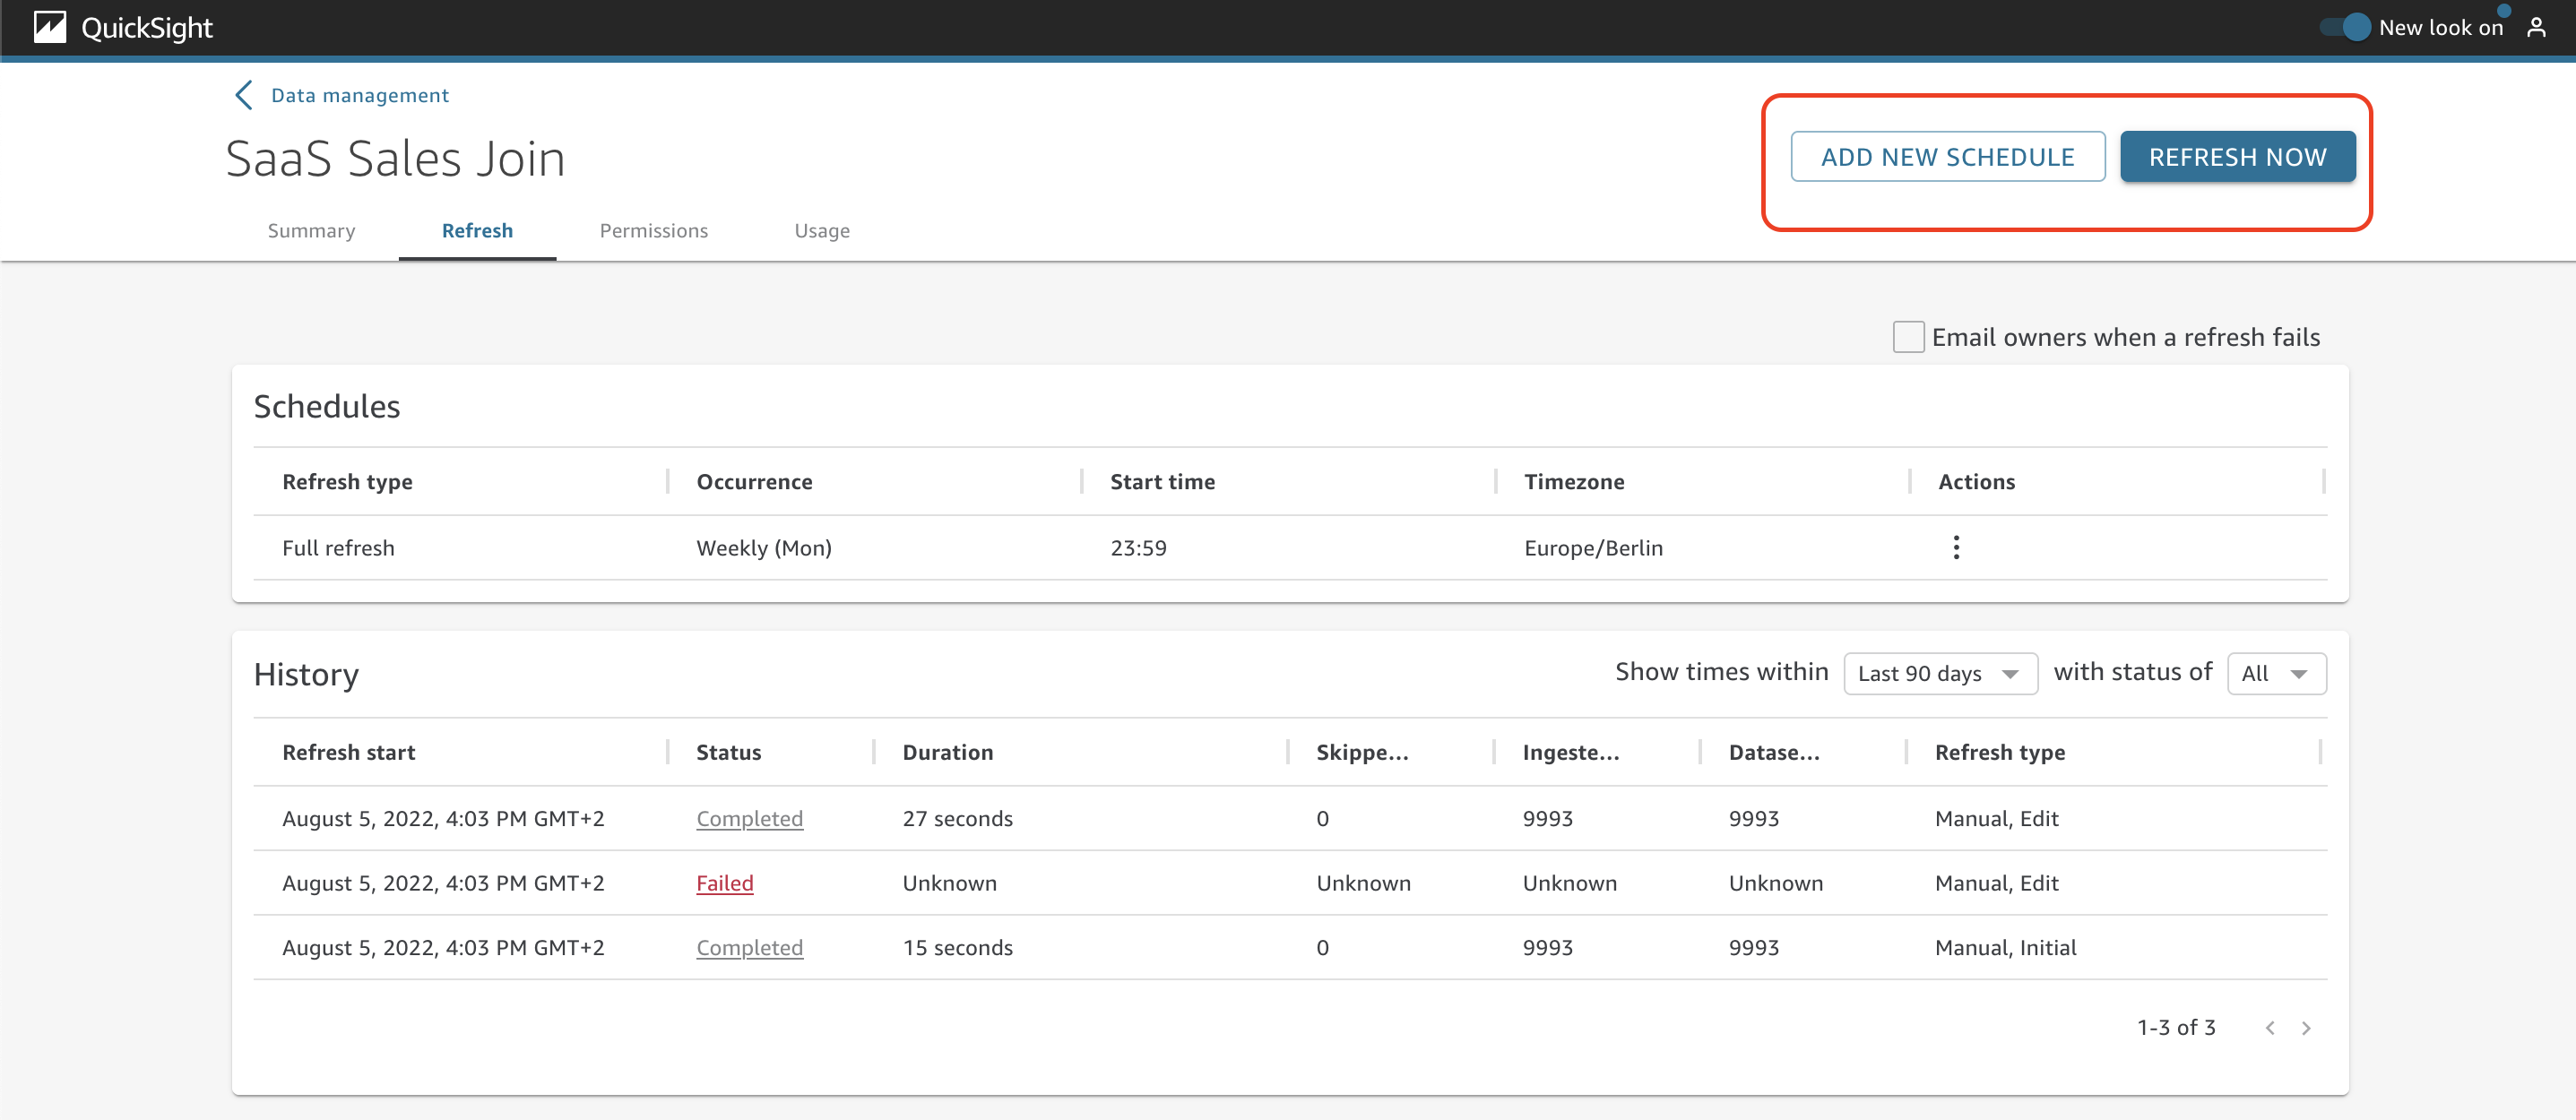
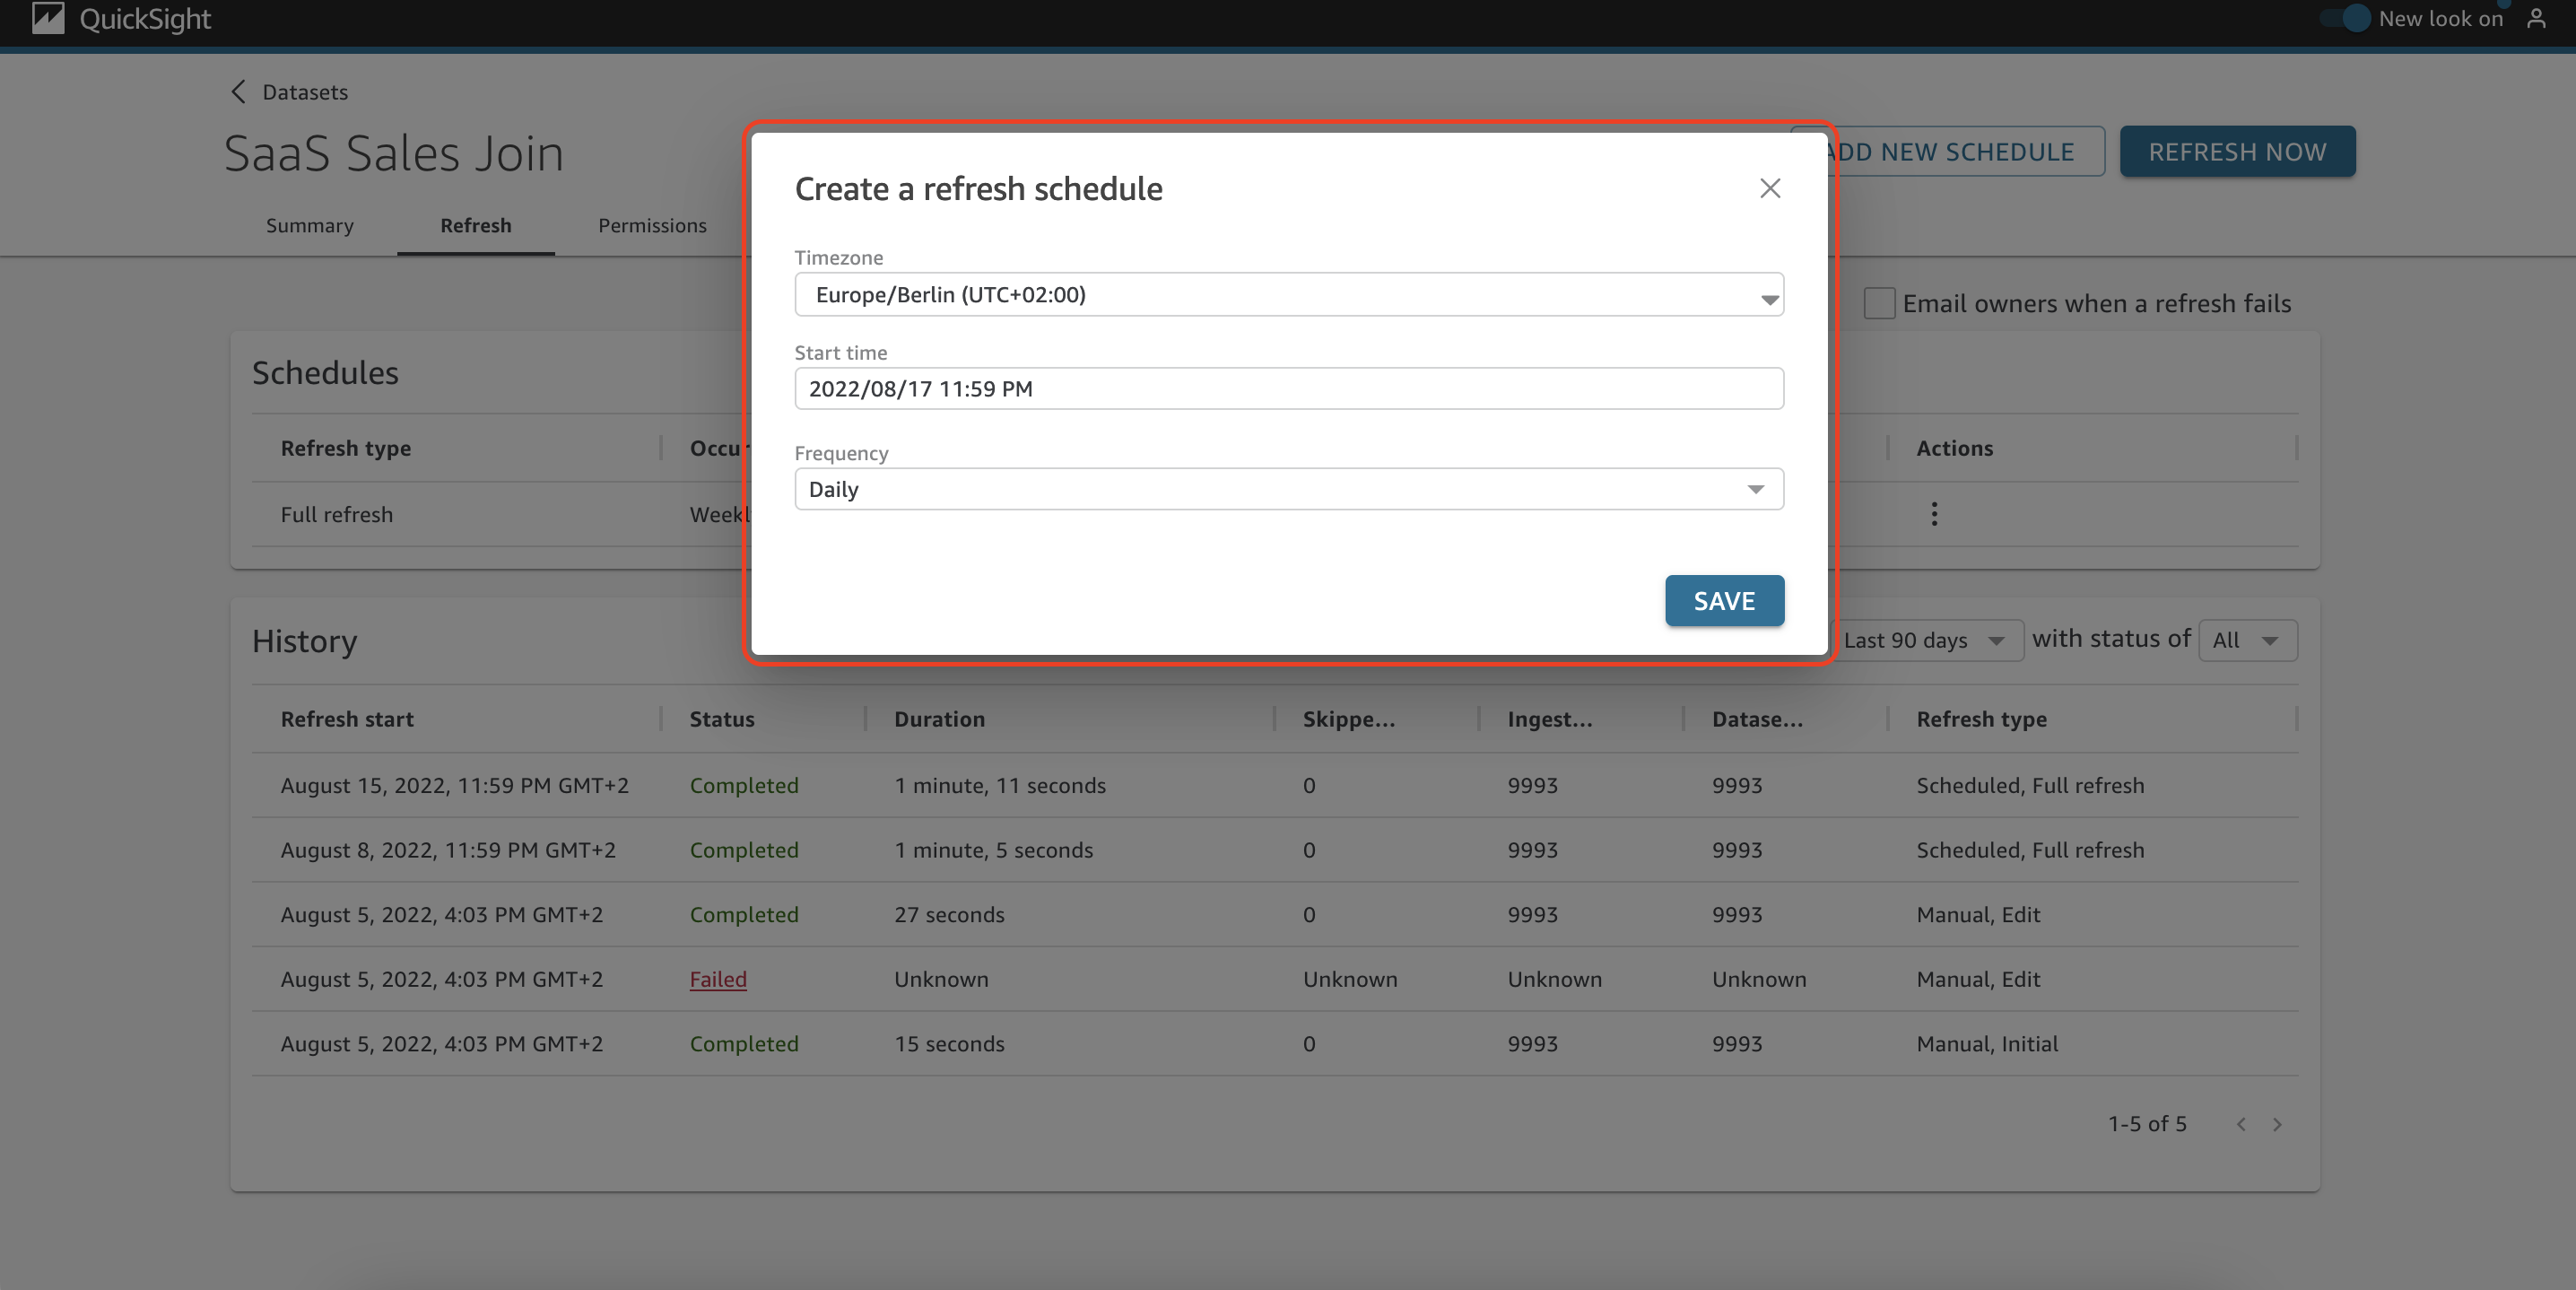
You can also choose Add new schedule to create a refresh schedule and not worry about running it manually in the future. You can set the time zone, start time, and frequency.
There are two types of scheduled refresh: full refresh and incremental refresh. Full refresh will completely reload the whole dataset, while incremental refresh only updates a specified small portion of your dataset. Using incremental refresh enables you to access the most recent insights much sooner.
In order to setup the incremental refresh, you need to perform the following actions:
- Choose Refresh Now.
- For Refresh type, choose Incremental refresh.
- If this is your first incremental refresh on the dataset, choose Configure.
- On the Configure incremental refresh page, do the following:
- For Date column, choose a date column that you want to base the look-back window on.
- For Window size, enter a number for size, and then choose an amount of time that you want to look back for changes.You can choose to refresh changes to the data that occurred within a specified number of hours, days, or weeks from now. For example, you can choose to refresh changes to the data that occurred within two weeks of the current date.
- Choose Submit.

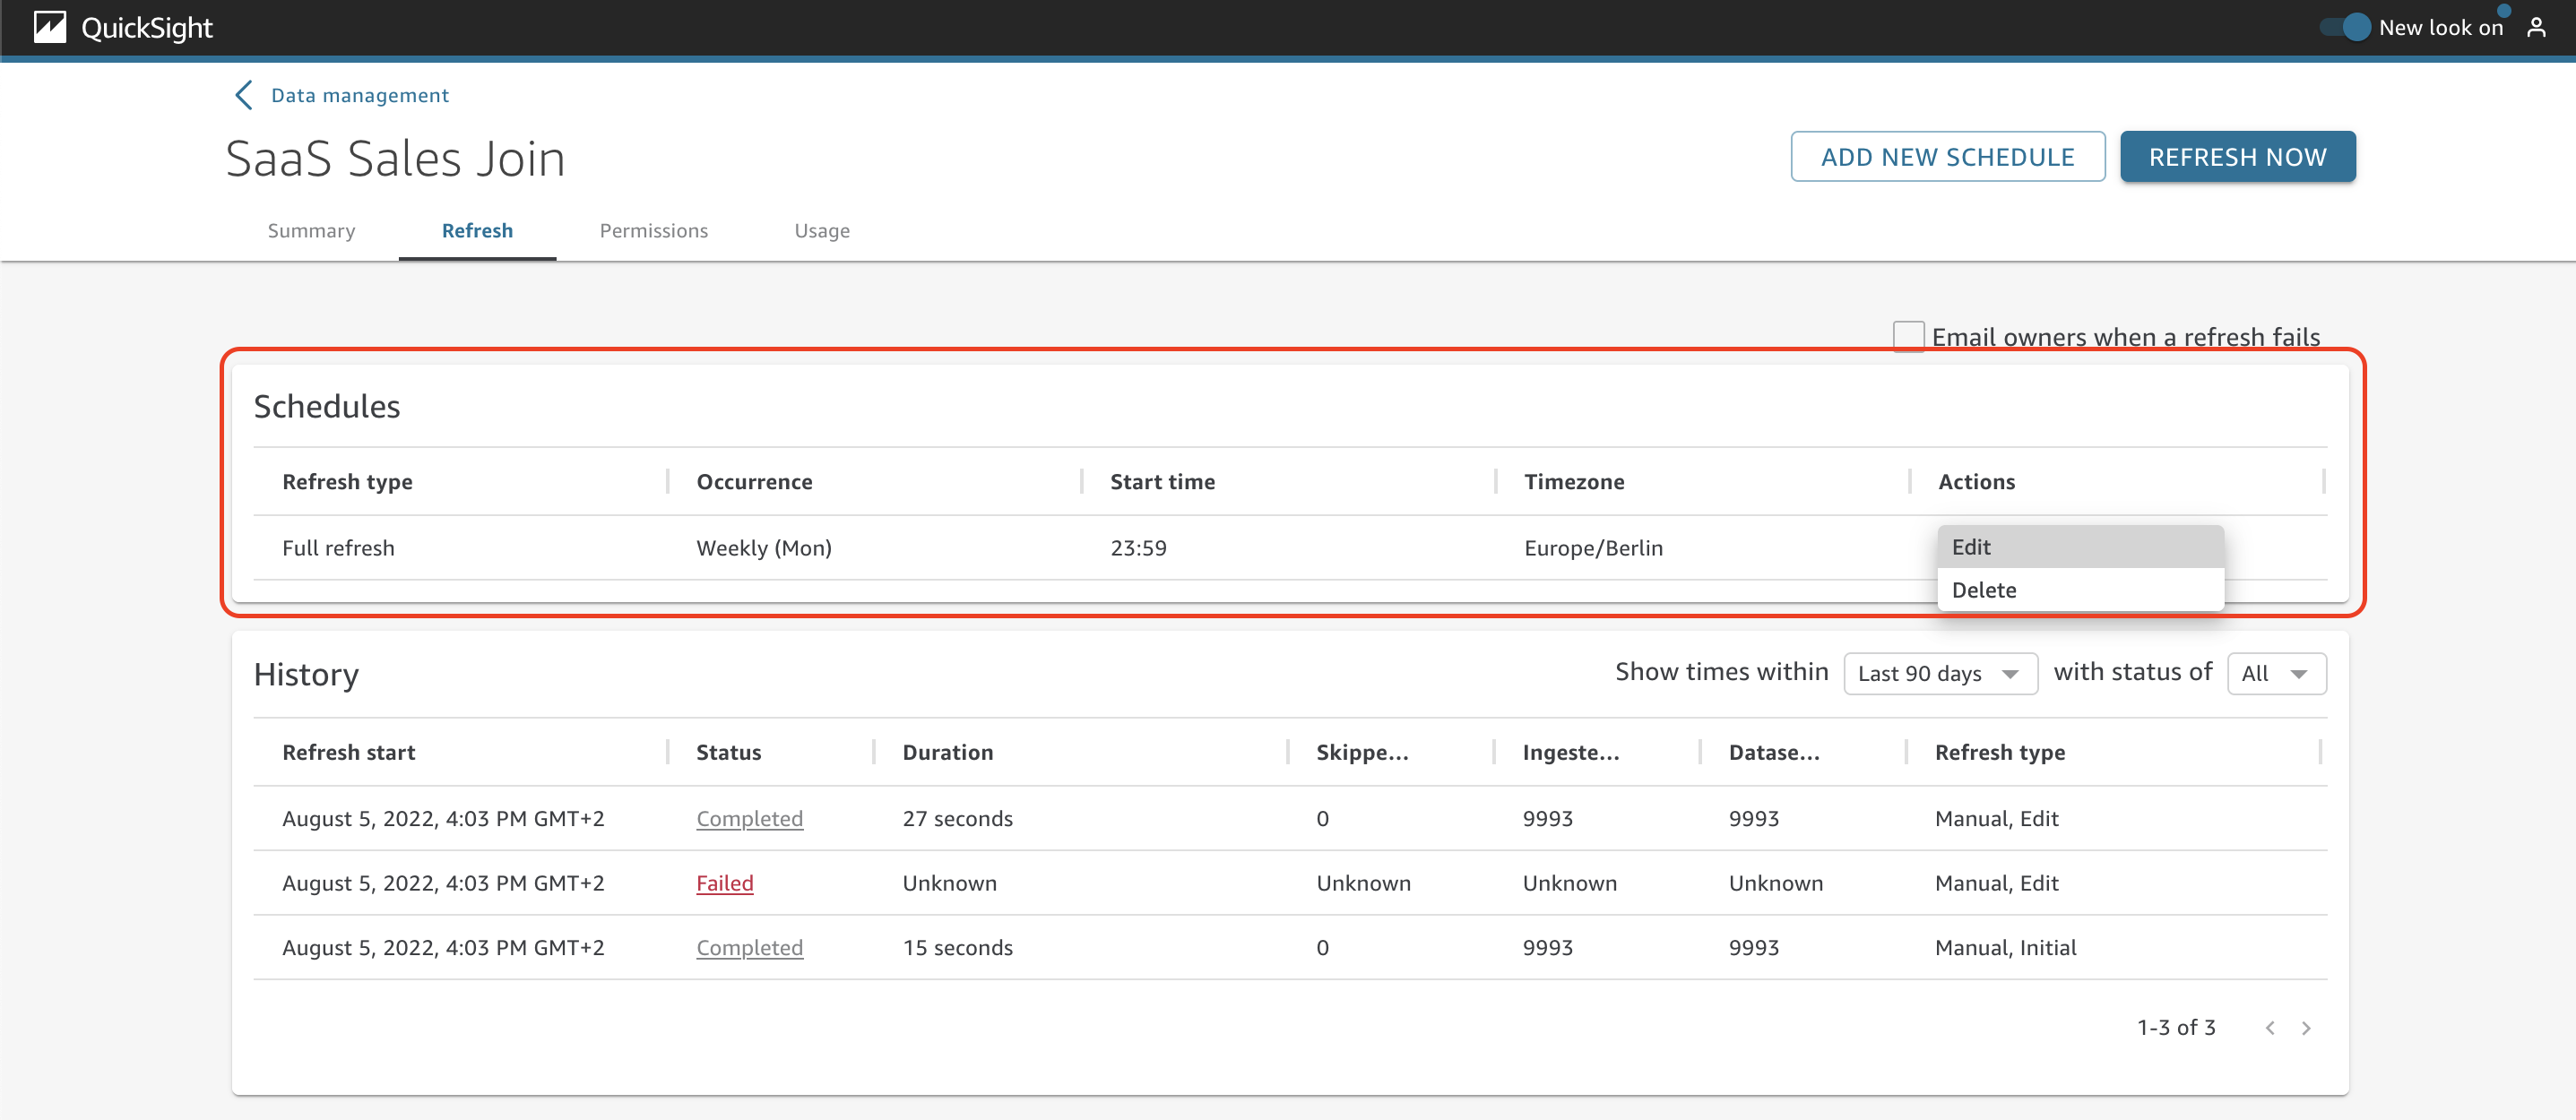
There are two main sections on the Refresh tab: Schedules and History. Under Schedules, you can see details about the scheduled refreshes of the dataset. There is also the option to edit and delete the schedule.
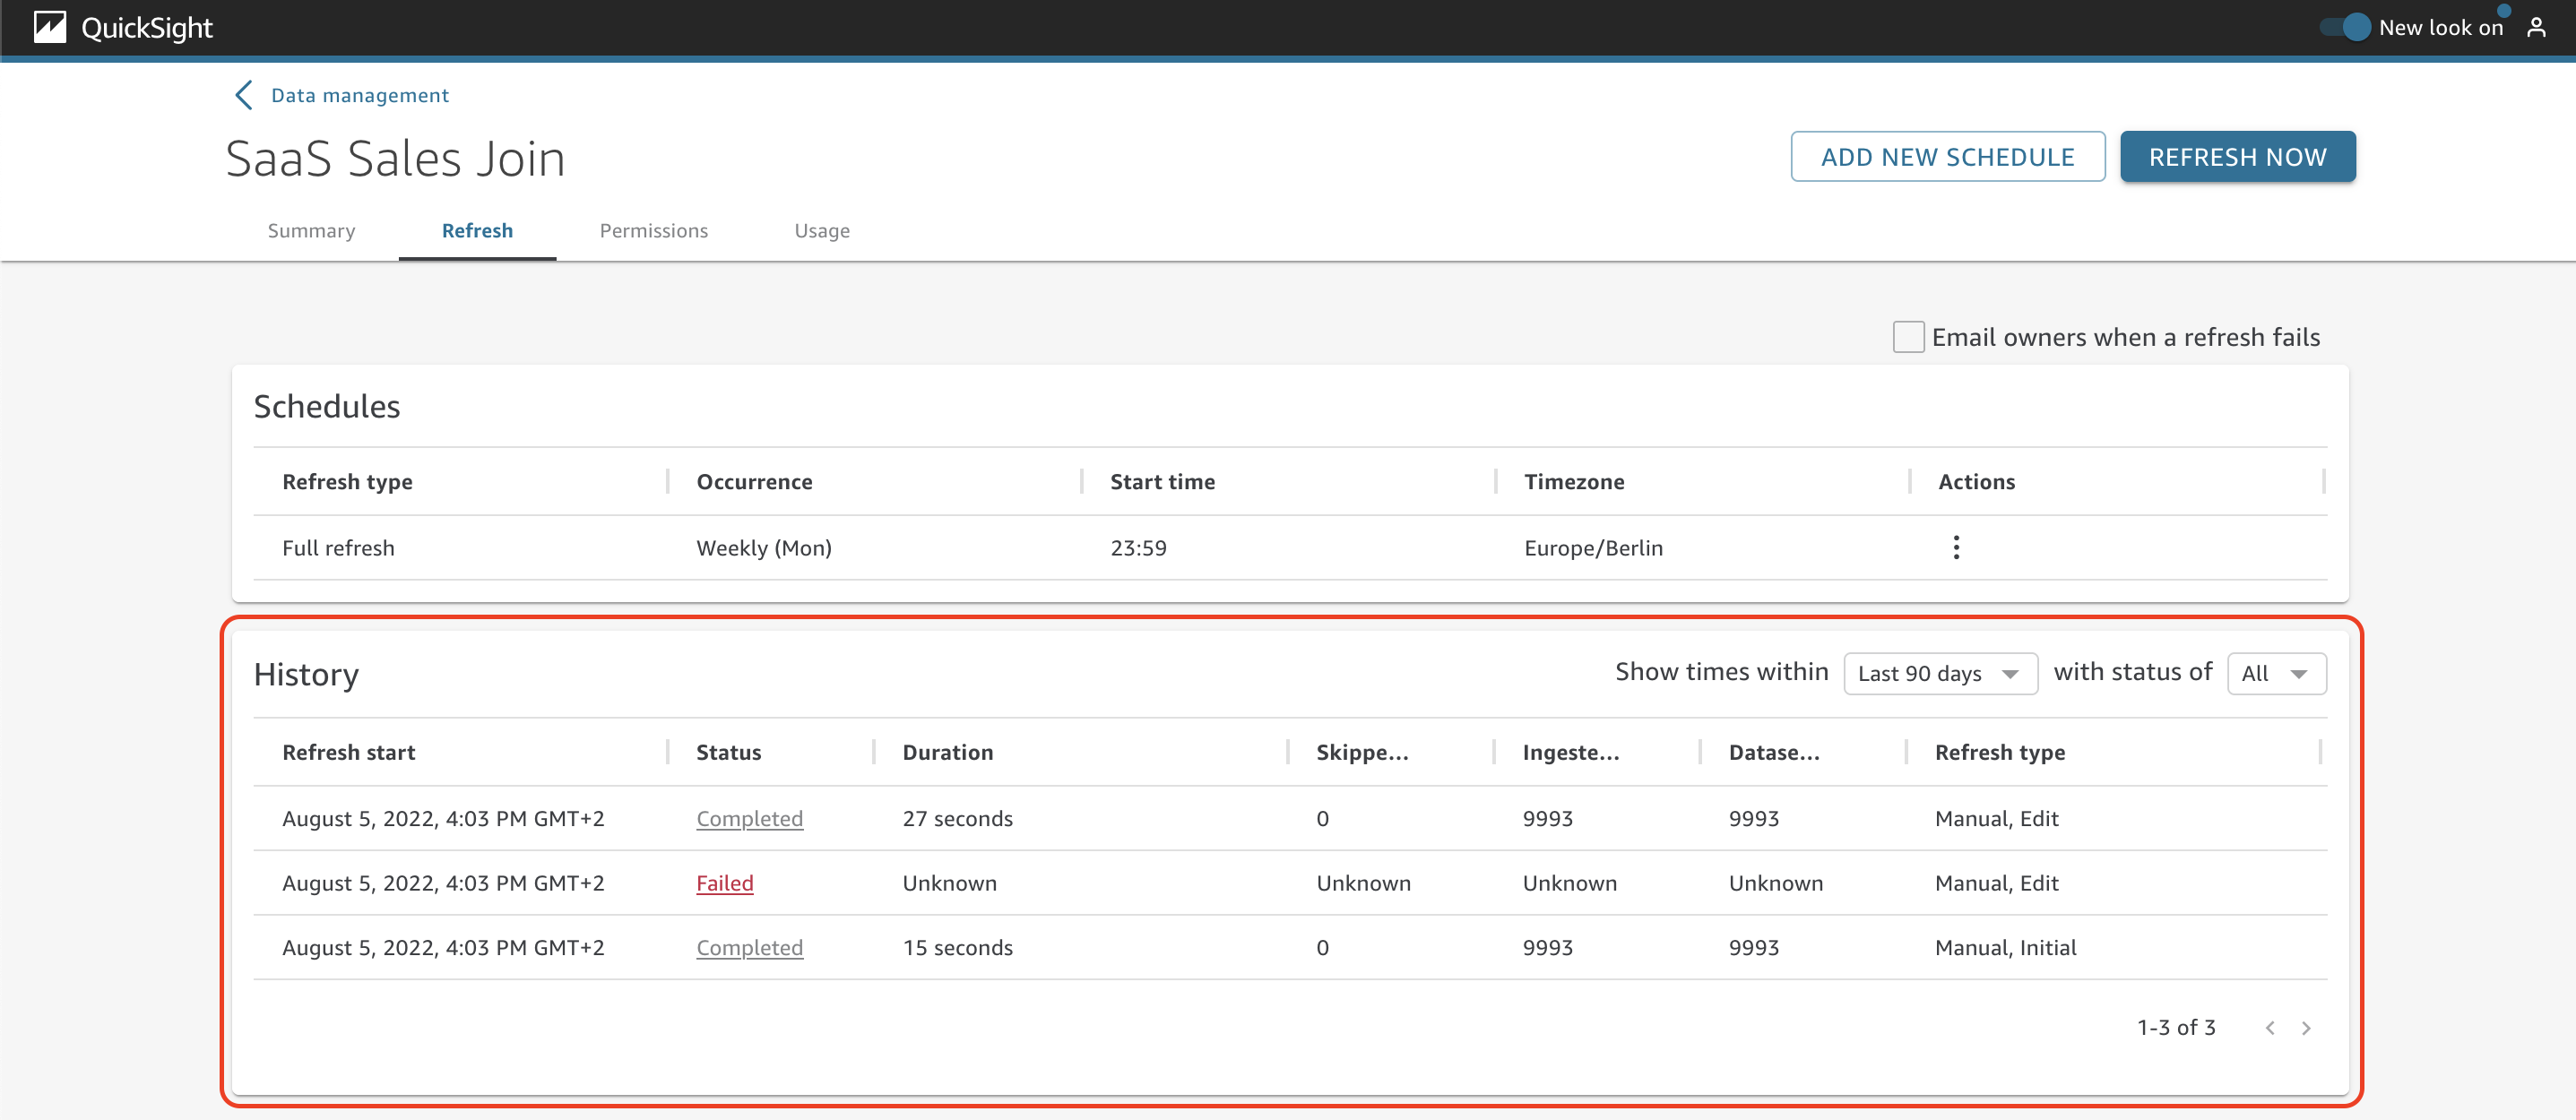
In the History section, you can see details about the past refreshes, such as status, duration, skipped rows, ingested rows, dataset rows, and refresh type.
The Permissions tab
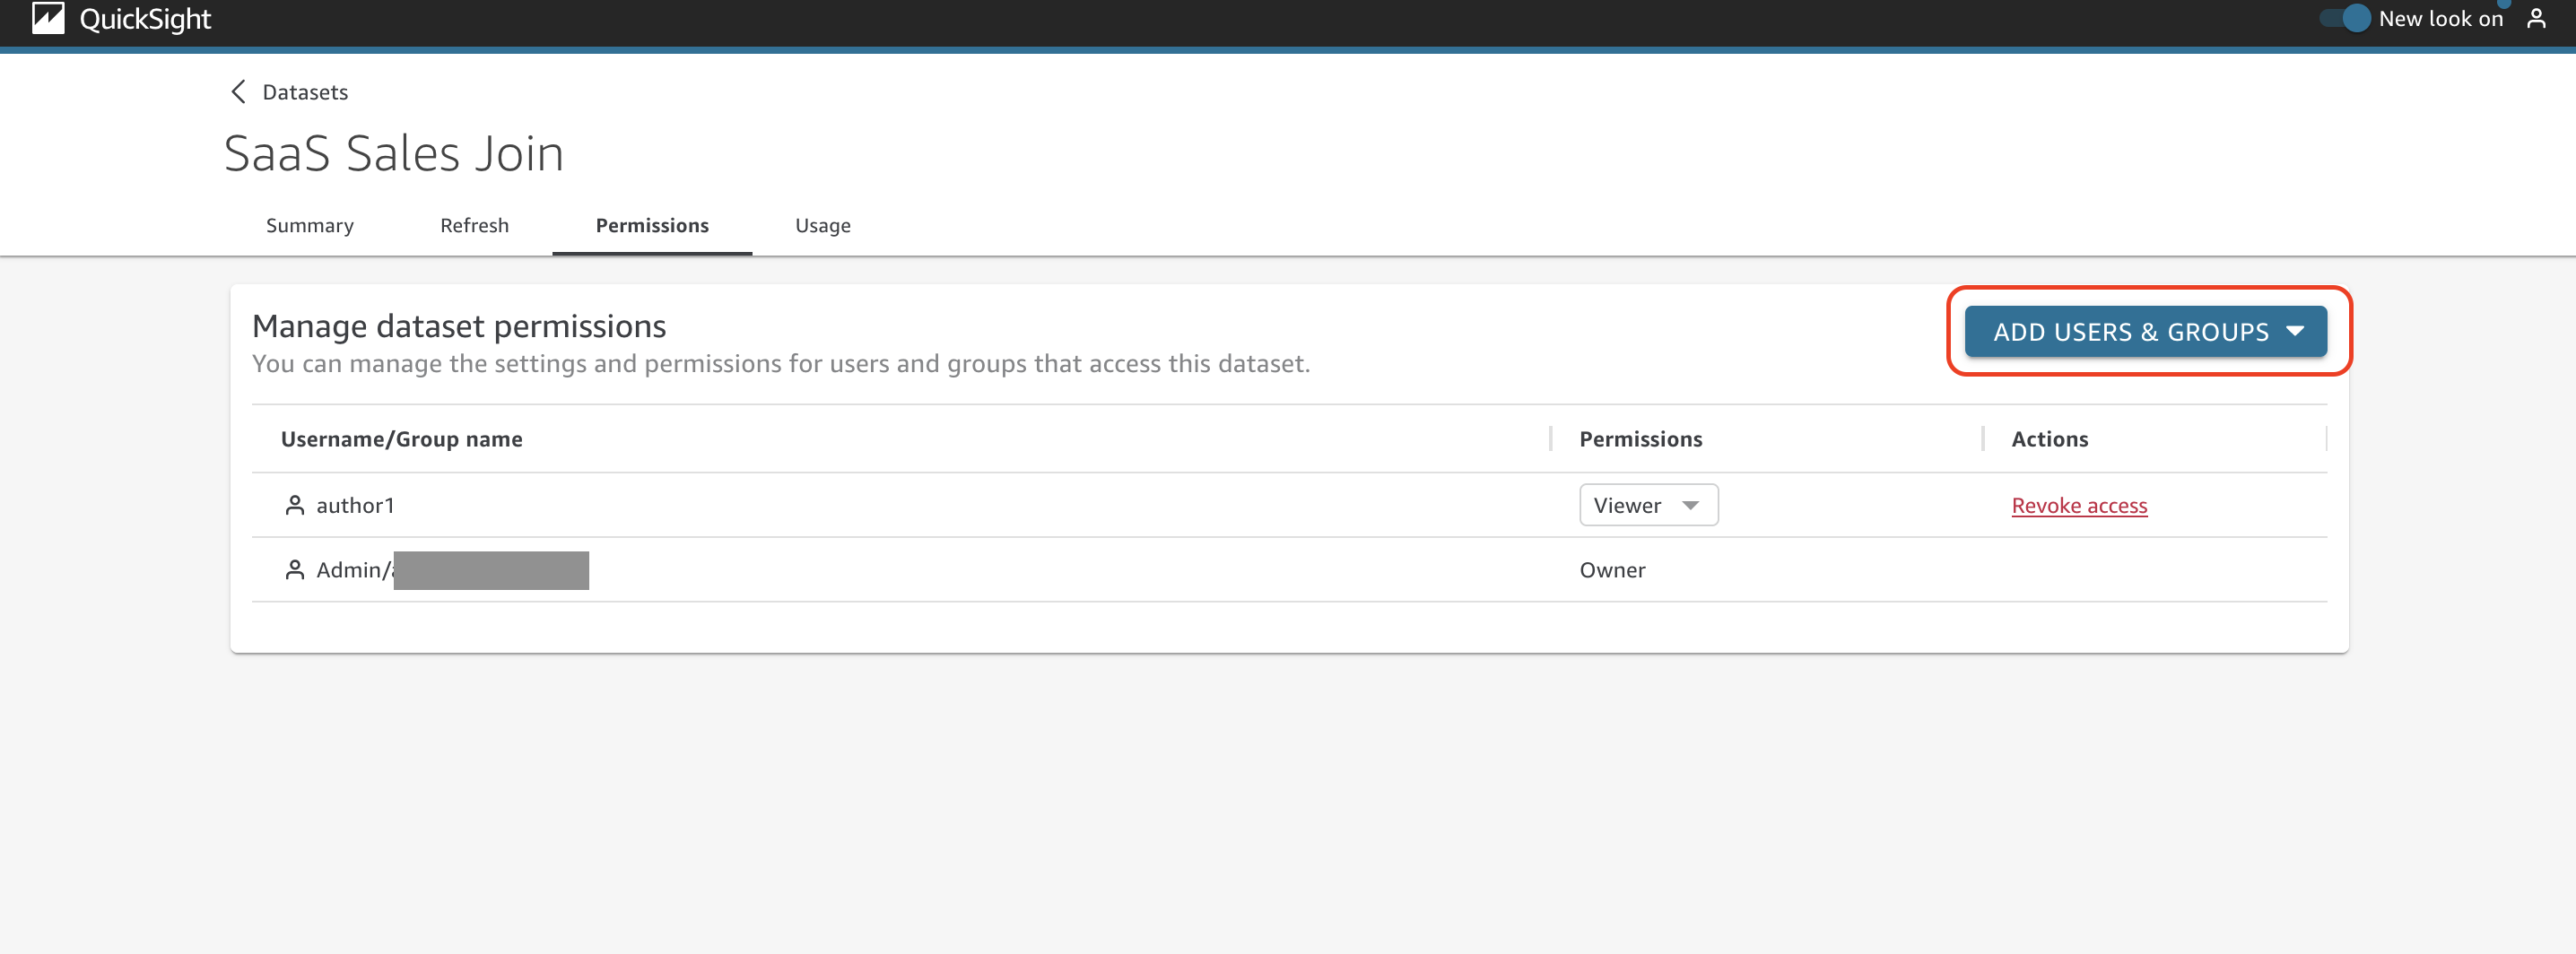
On the Permissions tab, you can manage the settings and permissions for users and groups that access the dataset.
As the dataset owner at AnyCompany, you need to manage access to the datasets and add users and groups. To do so, simply choose Add users & groups.
Choose the specific user or group to provide access to this dataset.

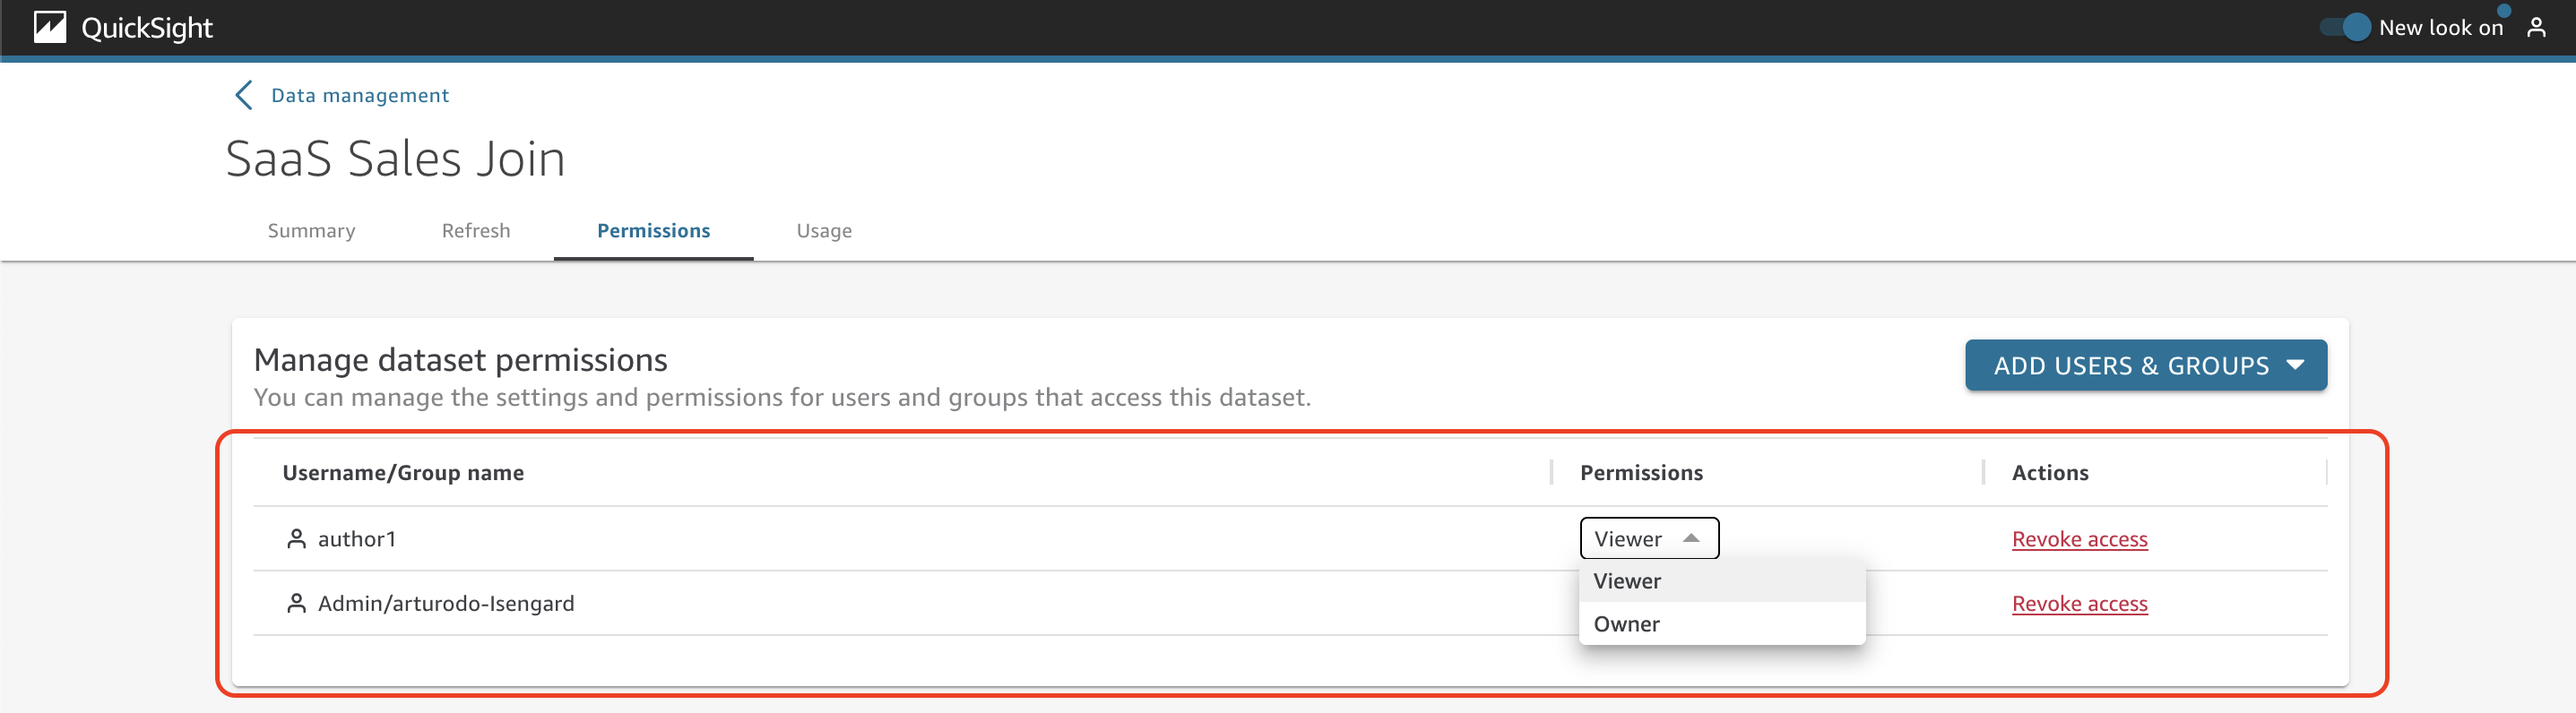
Review the list of users and groups that have access to the dataset as well as the level of permission (viewer or owner). You can also revoke access to the users or groups.
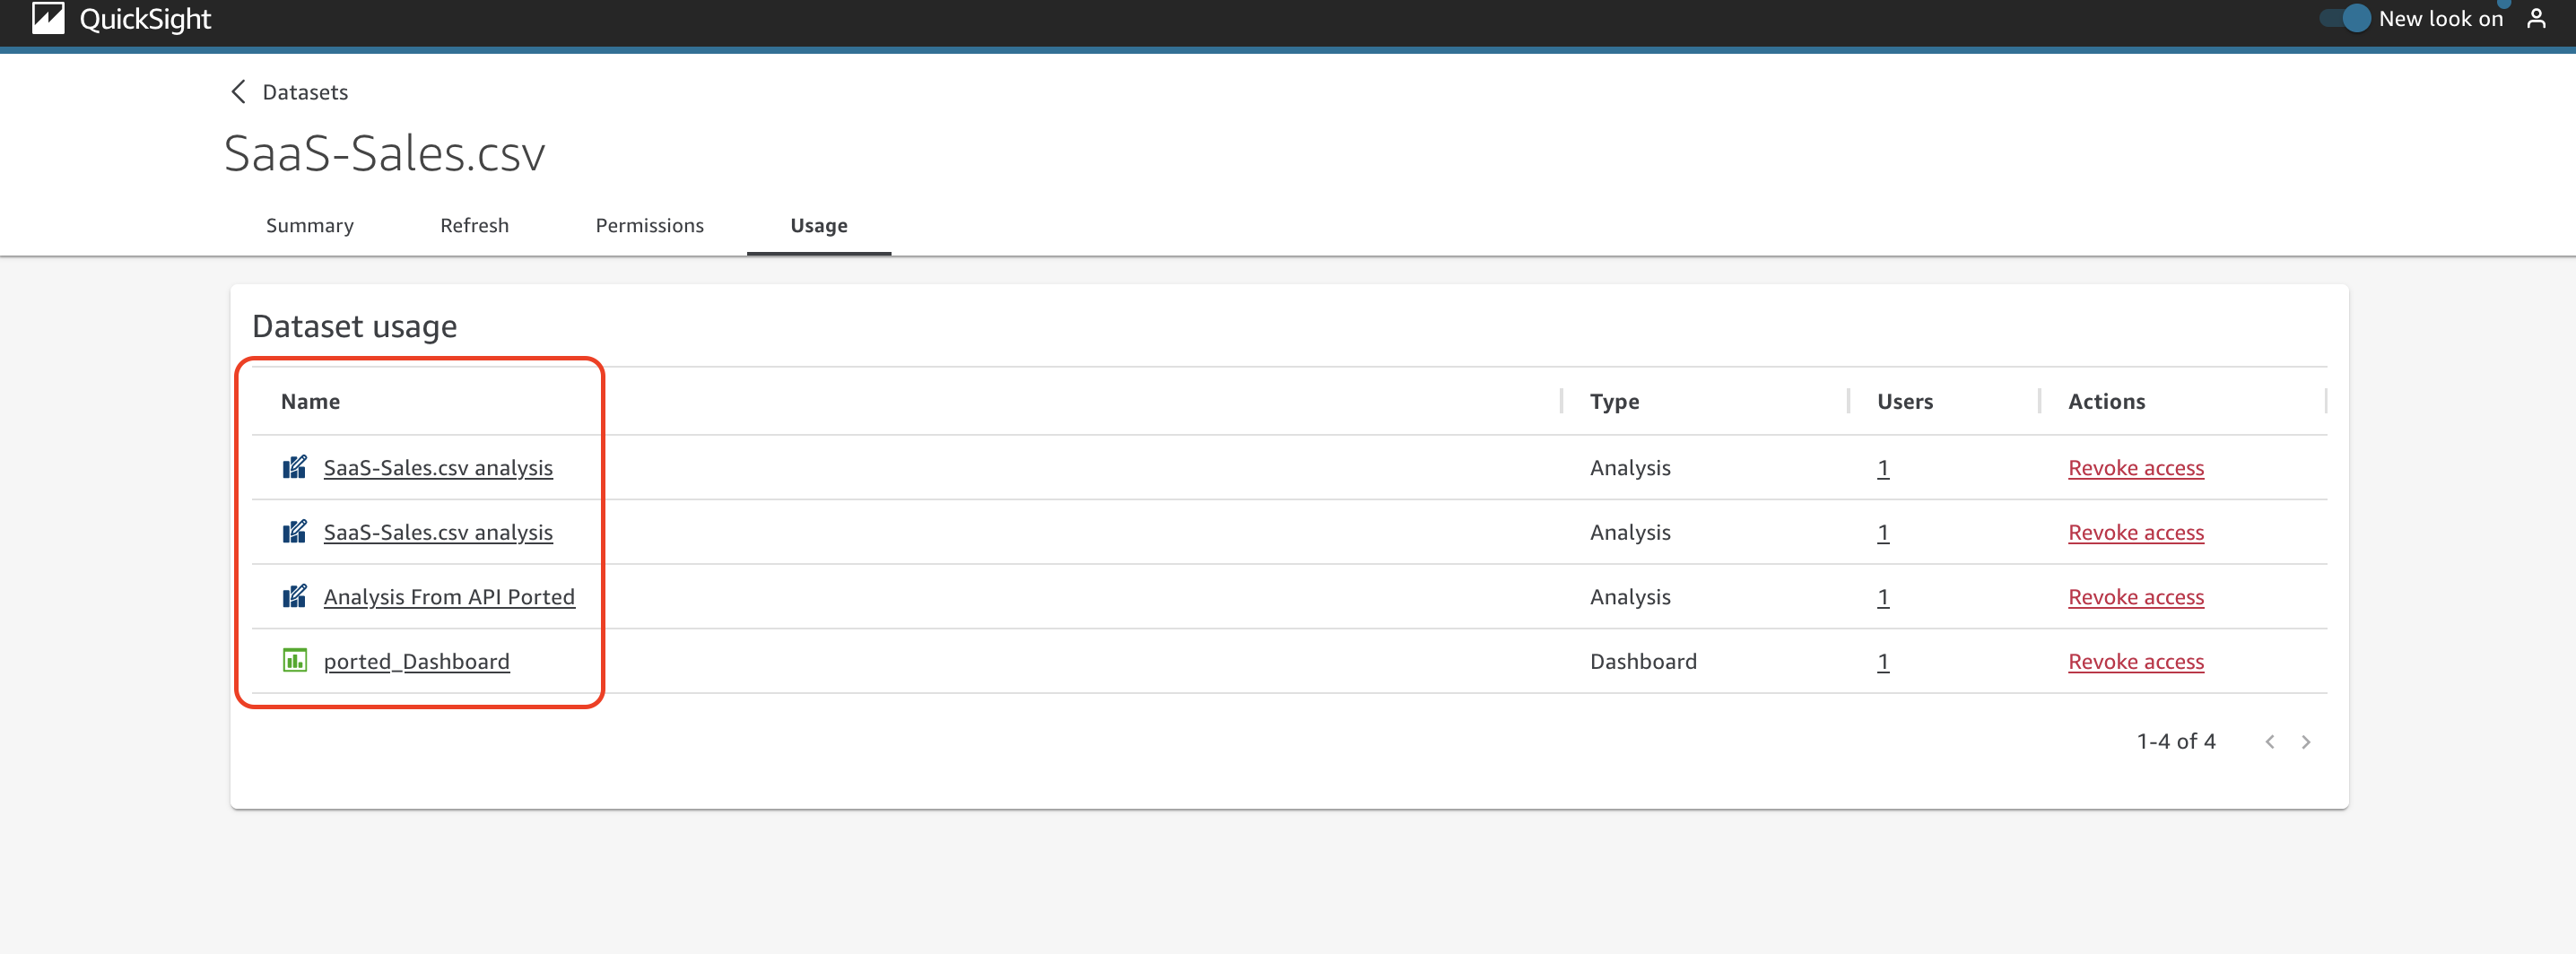
The Usage tab
It’s not always easy for AnyCompany to determine whether or not a dataset is being used by users or in other assets such as analyses or dashboards.
To answer this kind of question, you can easily review the information on the Usage tab. Here you can review the list of analyses and dashboards where the dataset is being used (choose the name of an analysis or dashboard to view the actual asset).
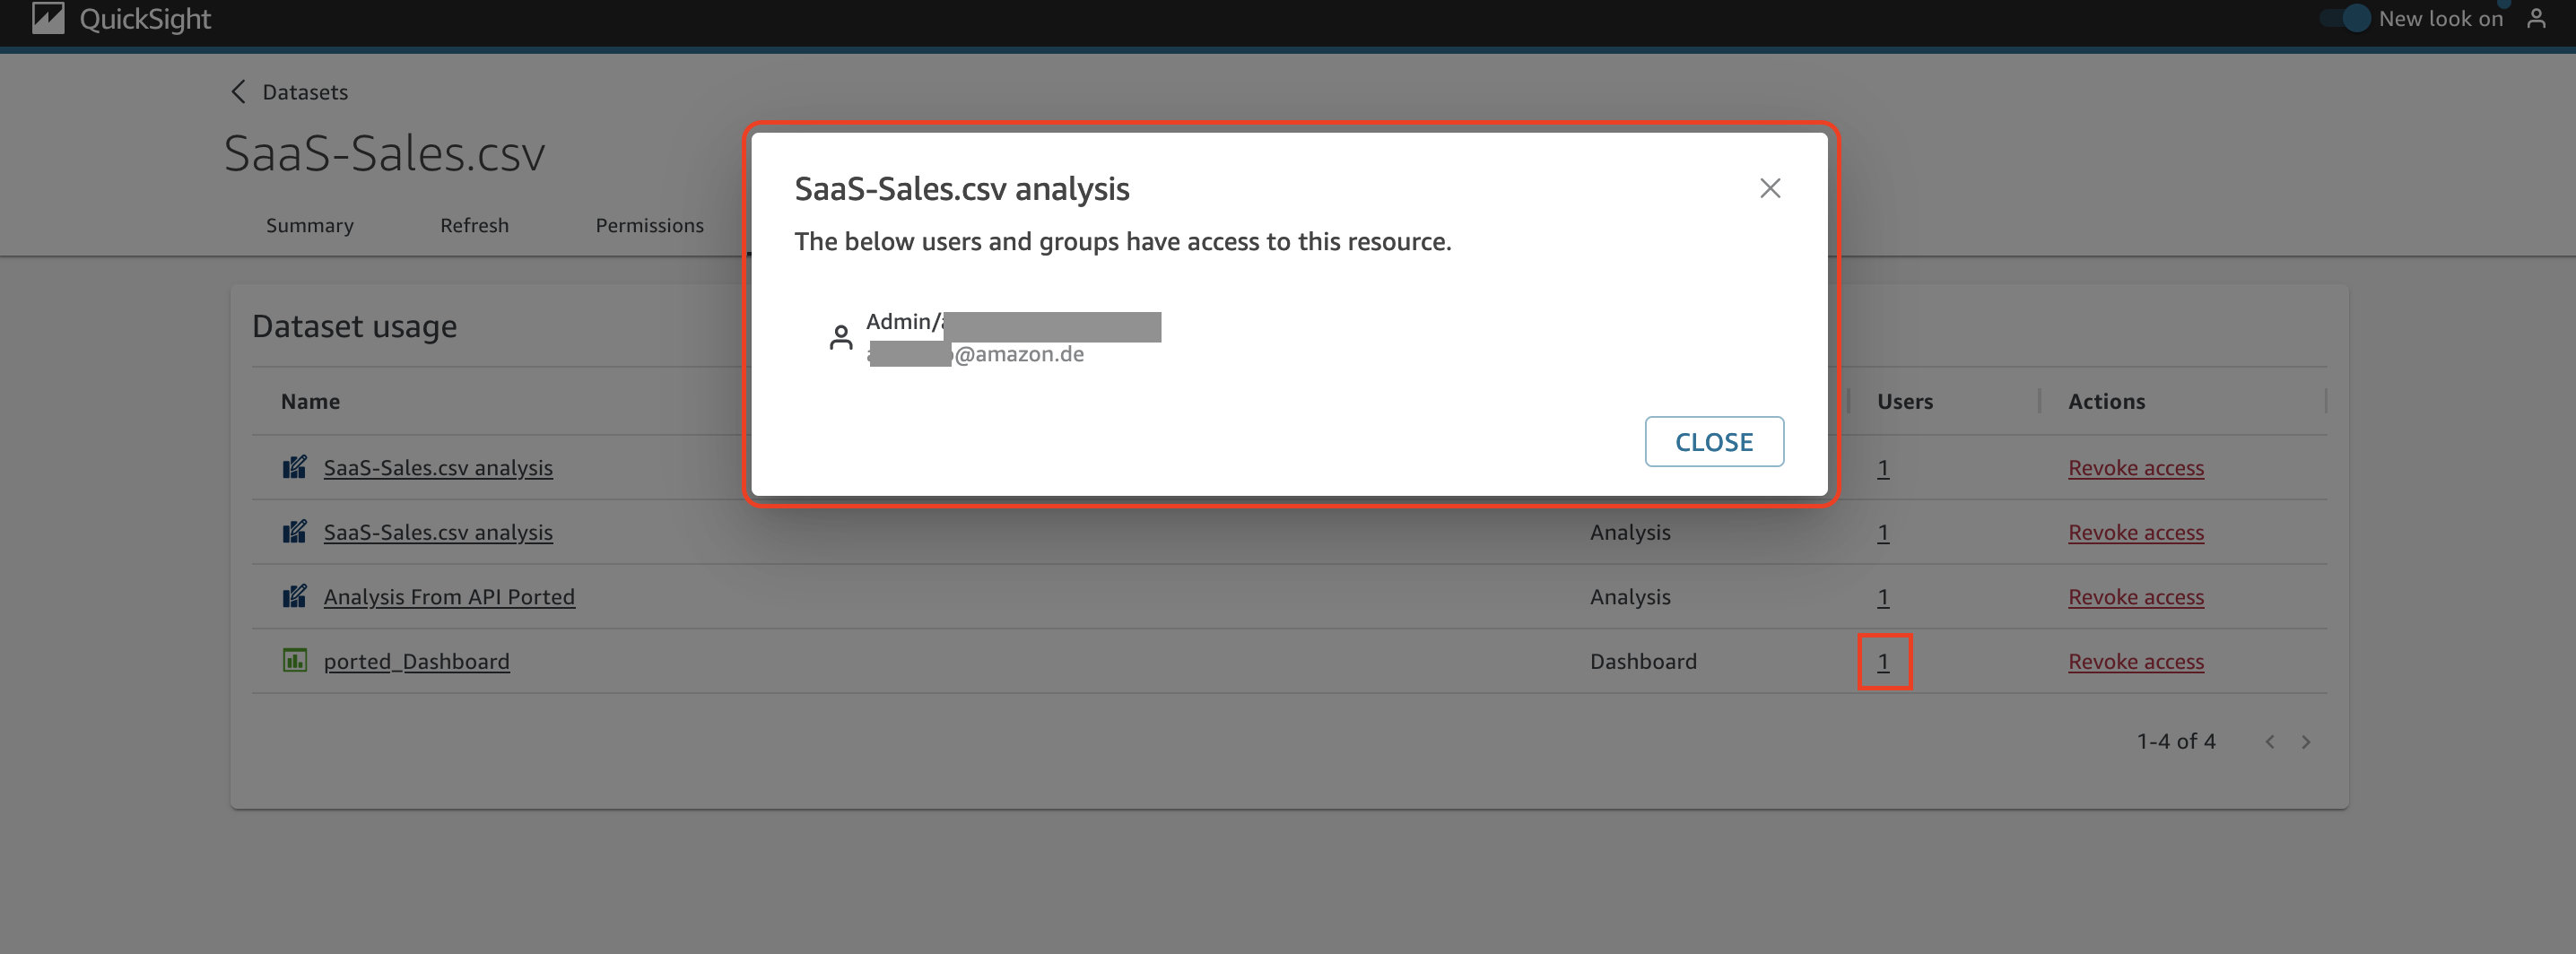
Under the Users column, you can get the details about who is using this analysis or dashboard.
Conclusion
In this post, we introduced the new user interface of the dataset management page on the QuickSight console. This new user interface simplifies the administration and use of datasets by having everything organized and centralized. This will primarily help authors and administrators quickly manage their datasets, while also contributing to a better QuickSight navigation experience. The new user interface is now generally available in all supported QuickSight Regions.
We look forward to your feedback and stories on how you use the new dataset management interface for your business needs.
Join the Quicksight Community to ask, answer and learn with others and explore additional resources.
About the Authors
 Arturo Duarte is a Partner Solutions Architect focused on Amazon QuickSight at Amazon Web Services. He works with EMEA APN Partners to help develop their data and analytics practices with enterprise and mission-critical solutions for their end customers.
 Emily Zhu is a Senior Product Manager at Amazon QuickSight, AWS’s cloud-native, fully managed SaaS BI service. She leads the development of the QuickSight analytics and query capability. Before joining AWS, she worked in the Amazon Prime Air drone delivery program and the Boeing company as senior strategist for several years. Emily is passionate about the potential of cloud-based BI solutions and looks forward to helping customers advance in their data-driven strategy making.