AWS Business Intelligence Blog
How Tradeshift delivers value to buyers and sellers through Amazon Quick Suite and Amazon Q
This guest post is co-written by Raphael Bres, Robert Iordache, Anca Andone, and Ioana Ploesteanu of Tradeshift.
As a leading e-invoicing and AP automation platform, Tradeshift connects buyers and sellers through an AI-enhanced network. Our analytics needs are unique because we serve two distinct user groups with different requirements. Buyers need visibility into their procurement processes and supplier relationships, and sellers require insights into payment patterns and customer relationships.
In this post, we demonstrate how Tradeshift’s integration of Amazon Quick Suite and Amazon Q delivers powerful analytics solutions, resulting in an 82% reduction in support tickets and 80% cost savings while enhancing buyer and seller insights across our e-invoicing platform.
Additionally, Tradeshift used the generative AI capabilities of Quick Suite to improve operation efficiency by significantly reducing their internal analytics report preparation lead time from several weeks to 4 days.
Challenge with our legacy BI tool
At Tradeshift, we had been using Insight Center, our in-house developed business intelligence (BI) tool, and although it served our basic needs initially, we faced significant operational challenges with this solution. The tool required extensive maintenance, which drained our resources and limited our ability to scale and innovate.The technical limitations of our legacy BI tool were particularly challenging for our growing business. We were constrained by its ability to handle only up to 10,000 rows of data, a 25 MB limit for scheduled reports, and data history retention of just 6 months. As our business grew and our analytics needs became more sophisticated, these limitations became increasingly problematic. We found ourselves unable to effectively process and analyze the large-scale data that our modern, data-driven workflows demanded. Although Insight Center was functional at a basic level, it couldn’t provide the scale and agility we needed to support our diverse user needs across the organization.Before we started using the Quick Suite chat agent to support the production of our Global Index Report, the entire process was handled manually by the data team. This required not only gathering and analyzing data from our platform, but also searching for industry and market insights, then processing and interpreting that information. Because the report reflects the state of global trade, this work had to be extremely meticulous, and the team spent significant time ensuring the accuracy of every data point. With the chat agent’s speed in processing and analyzing data, the time required to produce the report has been reduced to just 4 days.
Why we chose Quick Suite
We selected Quick Suite as our new solution because its BI capabilities directly addressed our key challenges and provided significant advantages. Its ability to process large volumes of structured data and scalability capabilities helps us handle vast amounts of data effortlessly while delivering insights in seconds, benefiting both our customers and internal users. The integration with Amazon Q provides a natural language interface, helping our users explore data intuitively by simply asking questions, without requiring development or data analytics skills. Additionally, Quick Suite offers an enhanced user experience through embedded dashboards and the Quick Suite console, and its flexibility and efficiency in building, managing, and customizing data assets and reports, making it an ideal solution for our needs.
Another reason for choosing Quick Suite is the AI-powered chat agent. It revolutionized our internal data analysis processes by reducing weeks of manual effort to mere days through automated analytics and executive summary generation. The user-friendly interface has made data insights accessible to team members, regardless of technical expertise, enabling our analysts to focus on strategic initiatives and making our organization more agile in today’s competitive landscape. In the following sections, we demonstrate how the Tradeshift analytics solution can help different user personas by embedding Quick Suite.
Buyer-focused solutions
For our buyer customers, we’ve implemented a comprehensive suite of 11 ready-made reports and dashboards that address key business needs. The following screenshot illustrates the dashboard showing the Tradeshift purchase orders (PO) lifecycle.

The PO lifecycle reporting dashboard provides end-to-end visibility into procurement activities, tracking purchase orders from inception through completion. By monitoring each stage of the PO process, the dashboard helps organizations identify operational bottlenecks, assess processing efficiency, and maintain clear accountability throughout the procurement cycle. This comprehensive view supports strategic decision-making, enhances budget control, and promotes transparency across all purchasing activities. Through Amazon Q, buyers can ask natural language questions like “What is my average purchase order processing time this quarter compared to last?” or “Show me the top 5 countries with increased invoice amounts compared to previous month?” The following screenshot shows an example of Amazon Q answering these business questions.
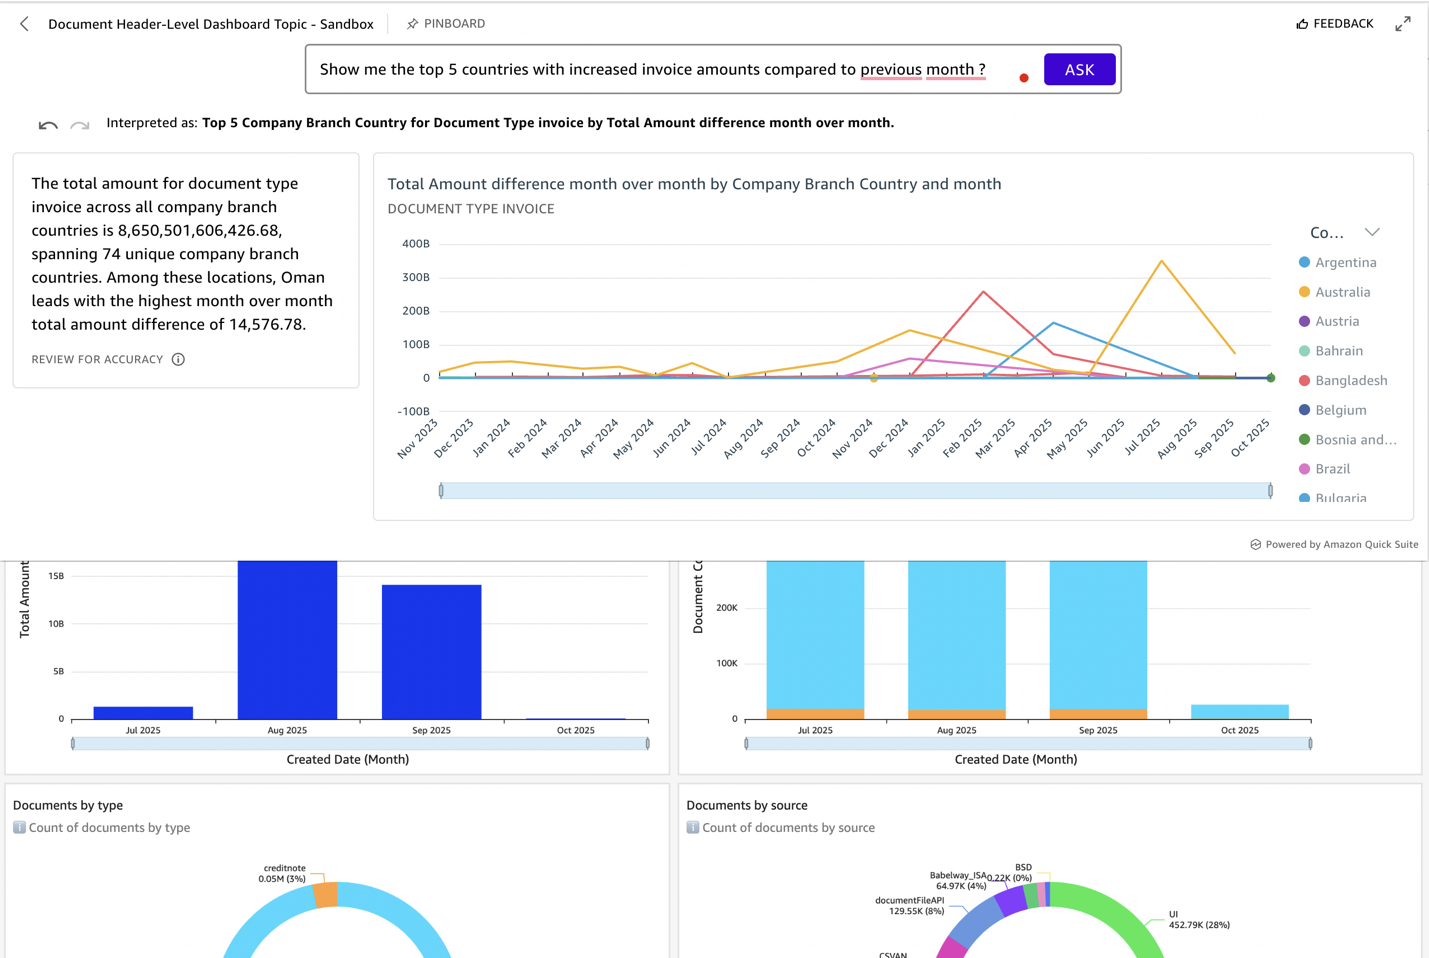
This capability has helped our buyers reduce processing times by identifying bottlenecks and optimizing workflows. The workflow report and dashboard (shown in the following screenshot) provides comprehensive monitoring of document progression through Tradeshift’s predefined workflow stages. It tracks critical performance indicators, including workflow status, document aging, approval statistics, approver activities, automated processing rates, and error frequencies.
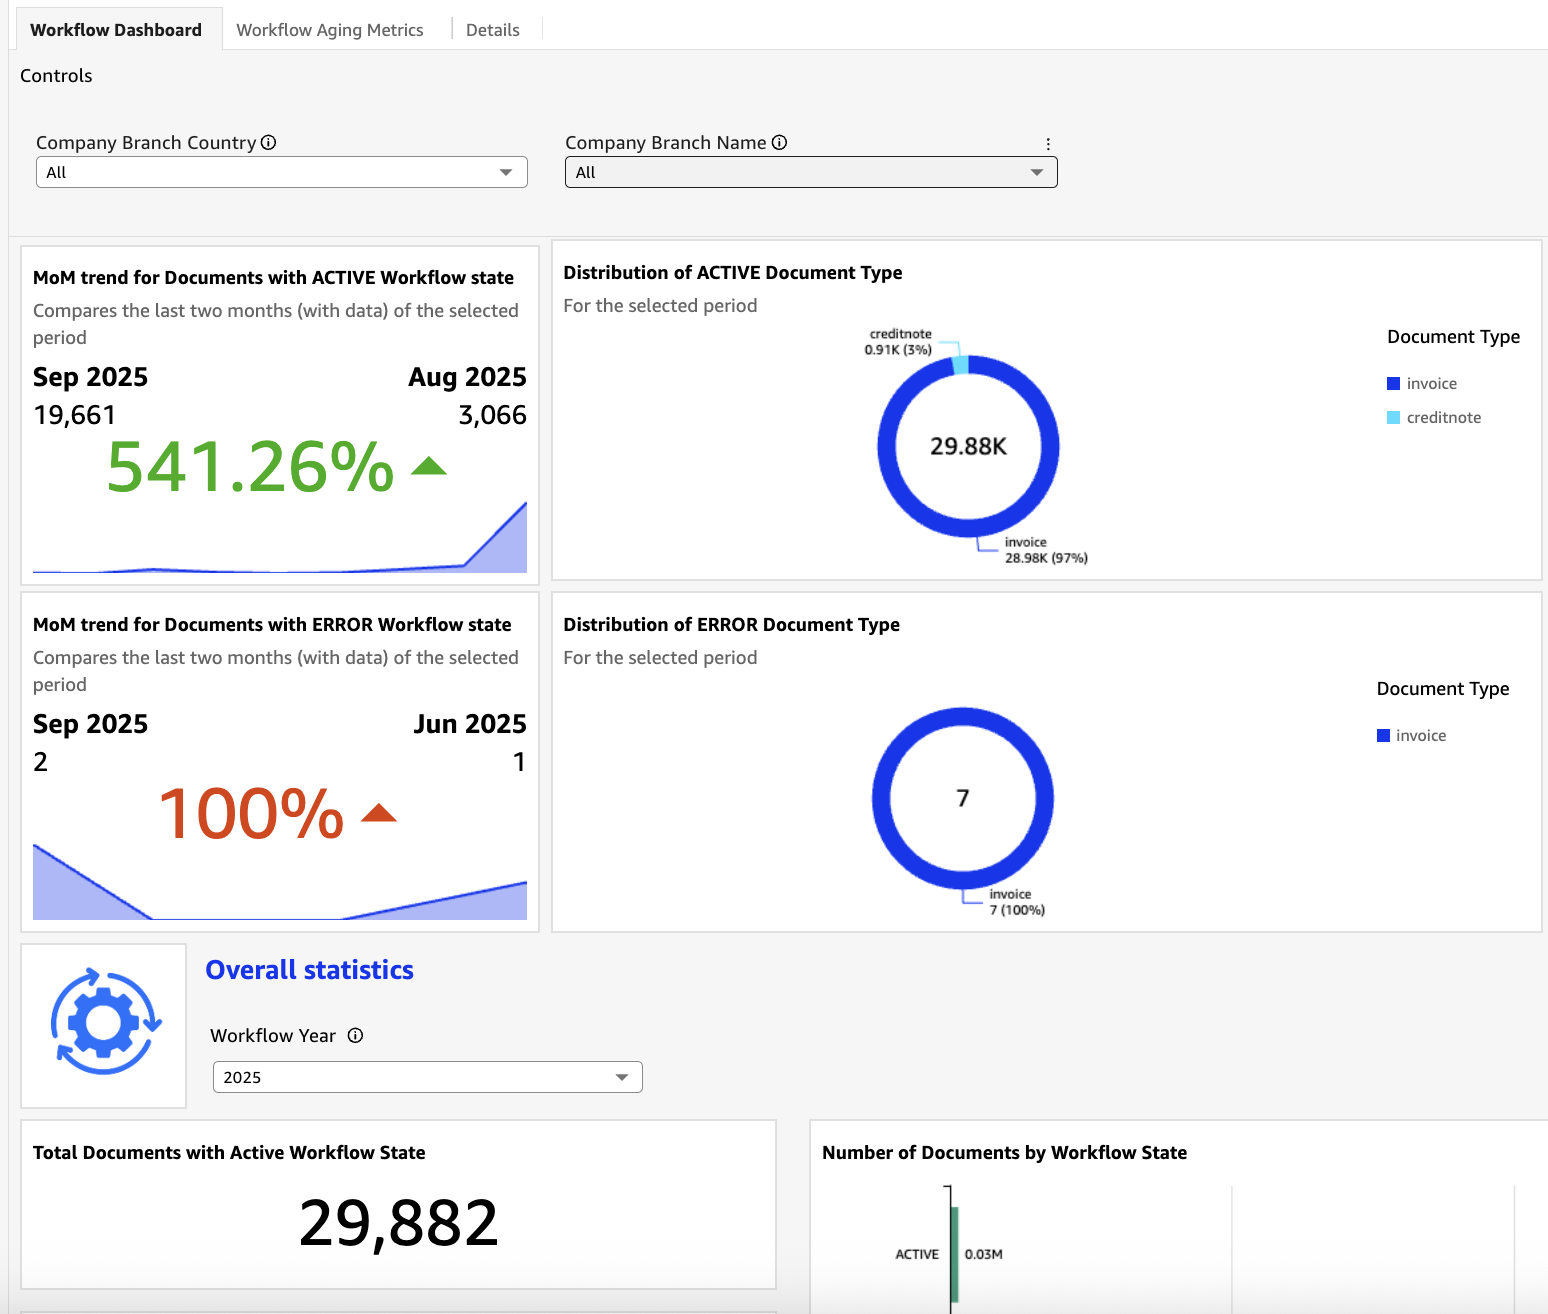
Through detailed analytics of these workflow metrics, customers can identify bottlenecks, optimize approval processes, and enhance operational efficiency. The dashboard’s ability to maintain detailed audit trails of document handling supports process improvement initiatives and makes sure regulatory compliance requirements are met. The document header-level report and dashboard (as shown in the following screenshot) functions as a detailed tracking system for individual documents processed through the Tradeshift platform. This comprehensive tool captures essential transaction details, including unique document identifiers, monetary values in both local and USD currencies, tax information, accounting references, and cost center allocations.
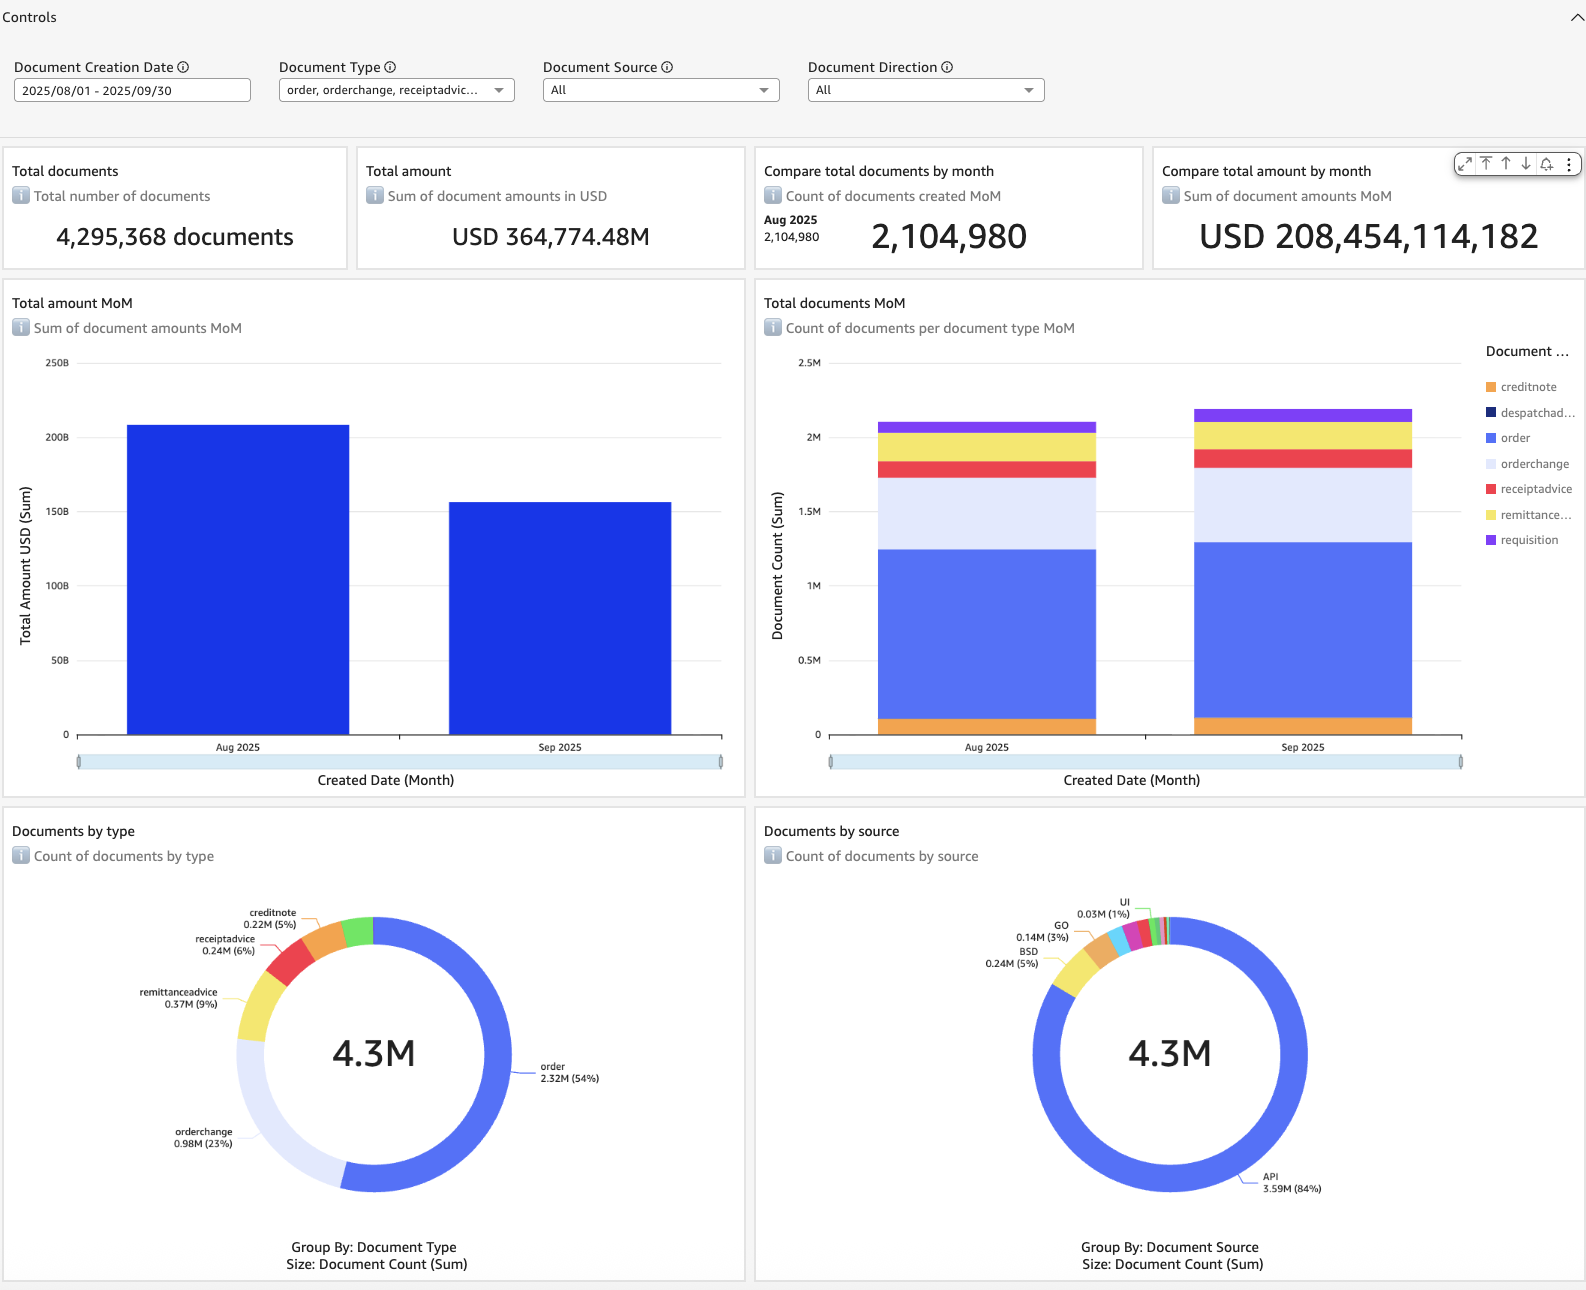
By providing granular visibility into document-level data, the dashboard enables efficient payment processing, cost optimization, and informed business decisions, making it an invaluable resource for financial operations management The document analytics dashboard provides buyers with real-time visibility into their transaction flows. Using Amazon Q, buyers can quickly analyze spending patterns with queries such as “What is my total spend by supplier category in Q3?” This has enabled more strategic sourcing decisions and better cash flow management.
Seller-focused solutions
The payment prediction analytics system combines historical payment data with actual invoice information to generate accurate forecasts of future payment patterns. By using advanced machine learning (ML) algorithms, the system analyzes multiple variables, including customer payment behaviors, historical transactions, and market conditions to predict payment outcomes. This predictive capability enables businesses to proactively manage their cash flow, minimize financial risks, and optimize their payment strategies for improved operational efficiency. The following screenshot shows an example of how the dashboard displays predicted payments-related metrics.

For our seller network, the Payment Predictor Report has been a game changer. Using ML, it forecasts payment dates based on historical patterns. Sellers can use Amazon Q to ask questions like “What’s my expected payment date for invoices submitted this week?” or “Show me customers with the longest payment cycles.” This functionality has helped sellers improve cash flow forecasting and working capital management.
Measurable impact across user groups
The platform user analytics dashboard (shown in the following screenshot) is a monitoring tool that provides detailed insights into user interactions within the Tradeshift platform. It enables comprehensive tracking of user login patterns, approval limits across different currencies, role assignments, and connections to company cost centers.
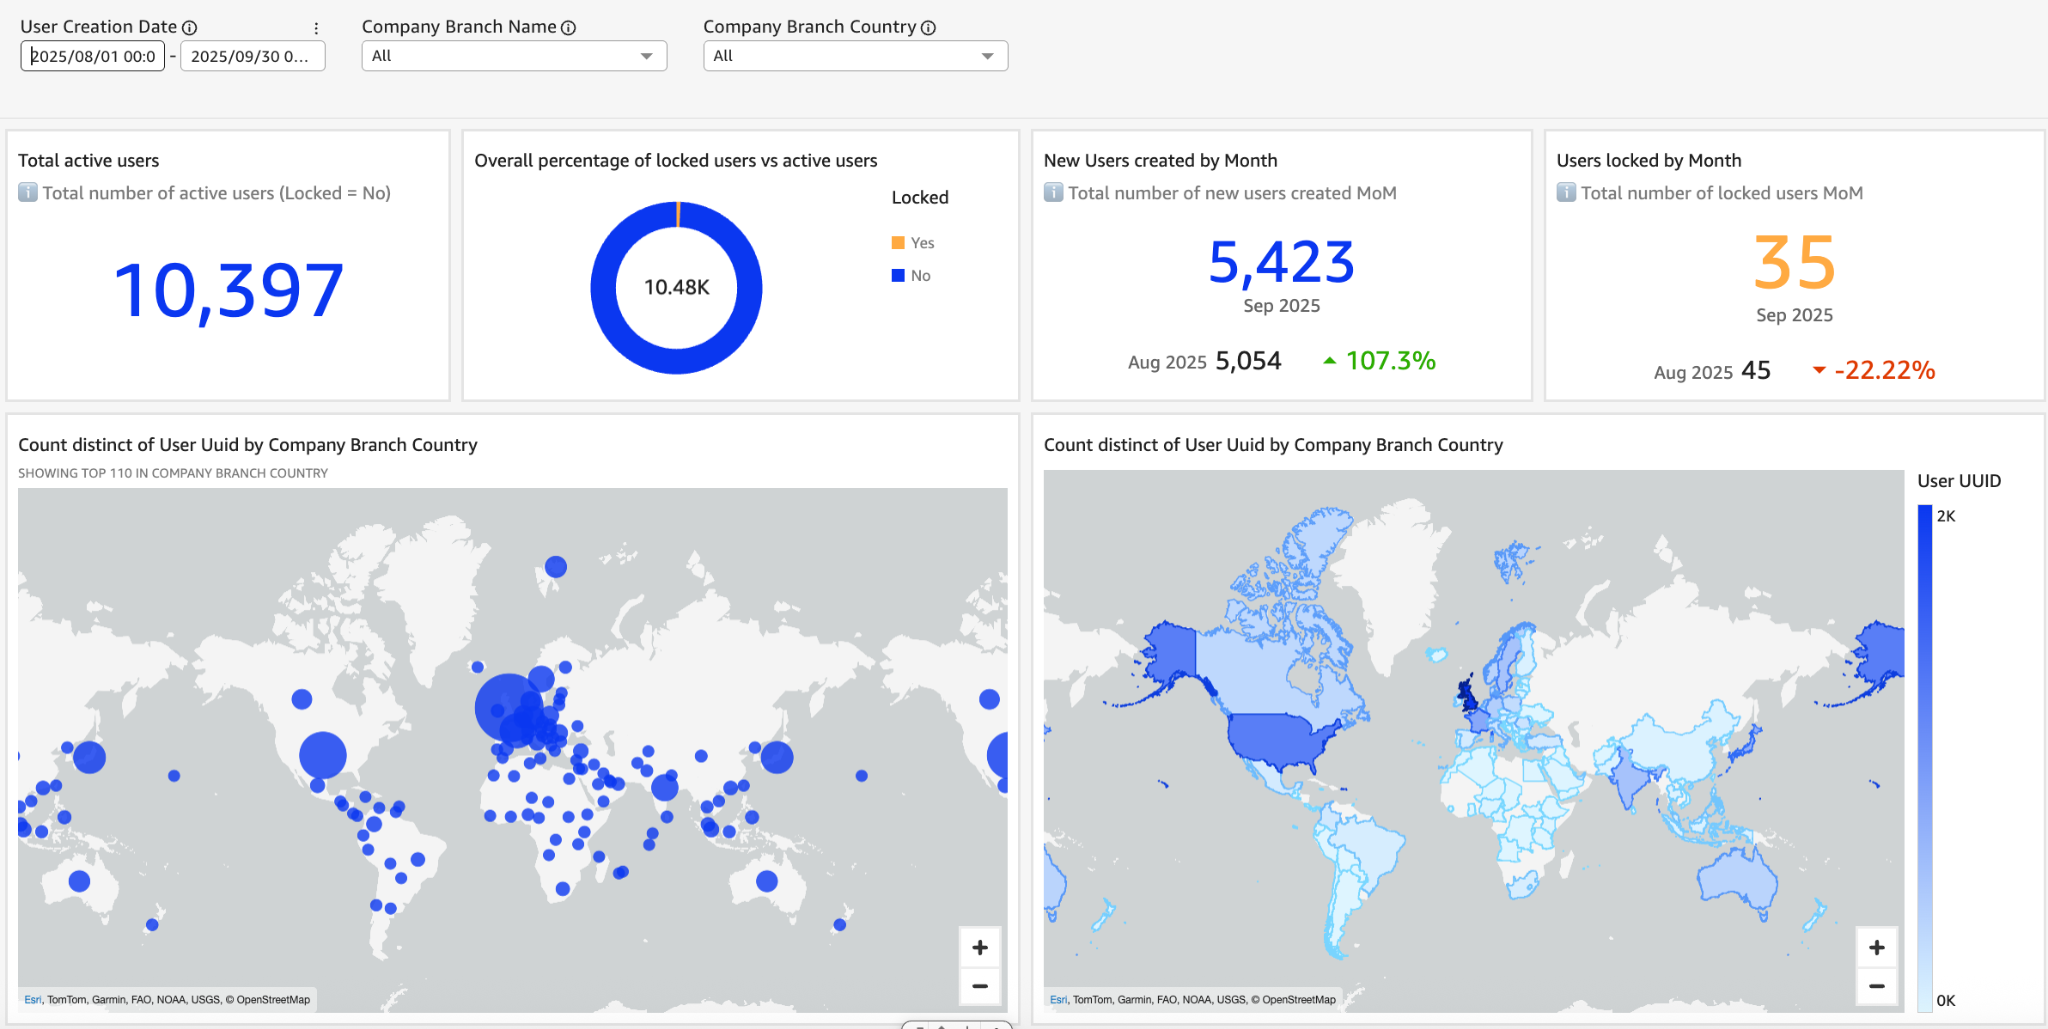
Through these detailed analytics, the dashboard helps identify potential security threats, fraudulent activities, and platform misuse, ultimately providing a secure and reliable business environment for all users. Since implementing Quick Suite, we’ve achieved the following:
- 60% customer adoption rate across both buyer and seller accounts
- 82% reduction in support tickets related to analytics queries
- 75% faster turnaround time for new reporting requests
Our network connections dashboard (shown in the following screenshot) serves as a centralized hub for managing and monitoring seller onboarding within the Tradeshift platform. It streamlines the procurement and payment processes by providing real-time visibility into each seller’s onboarding status, standardized documentation, and relationship details. The dashboard captures critical seller information, including legal documentation, tax credentials, and payment details, while tracking the nature and status of buyer-seller relationships.
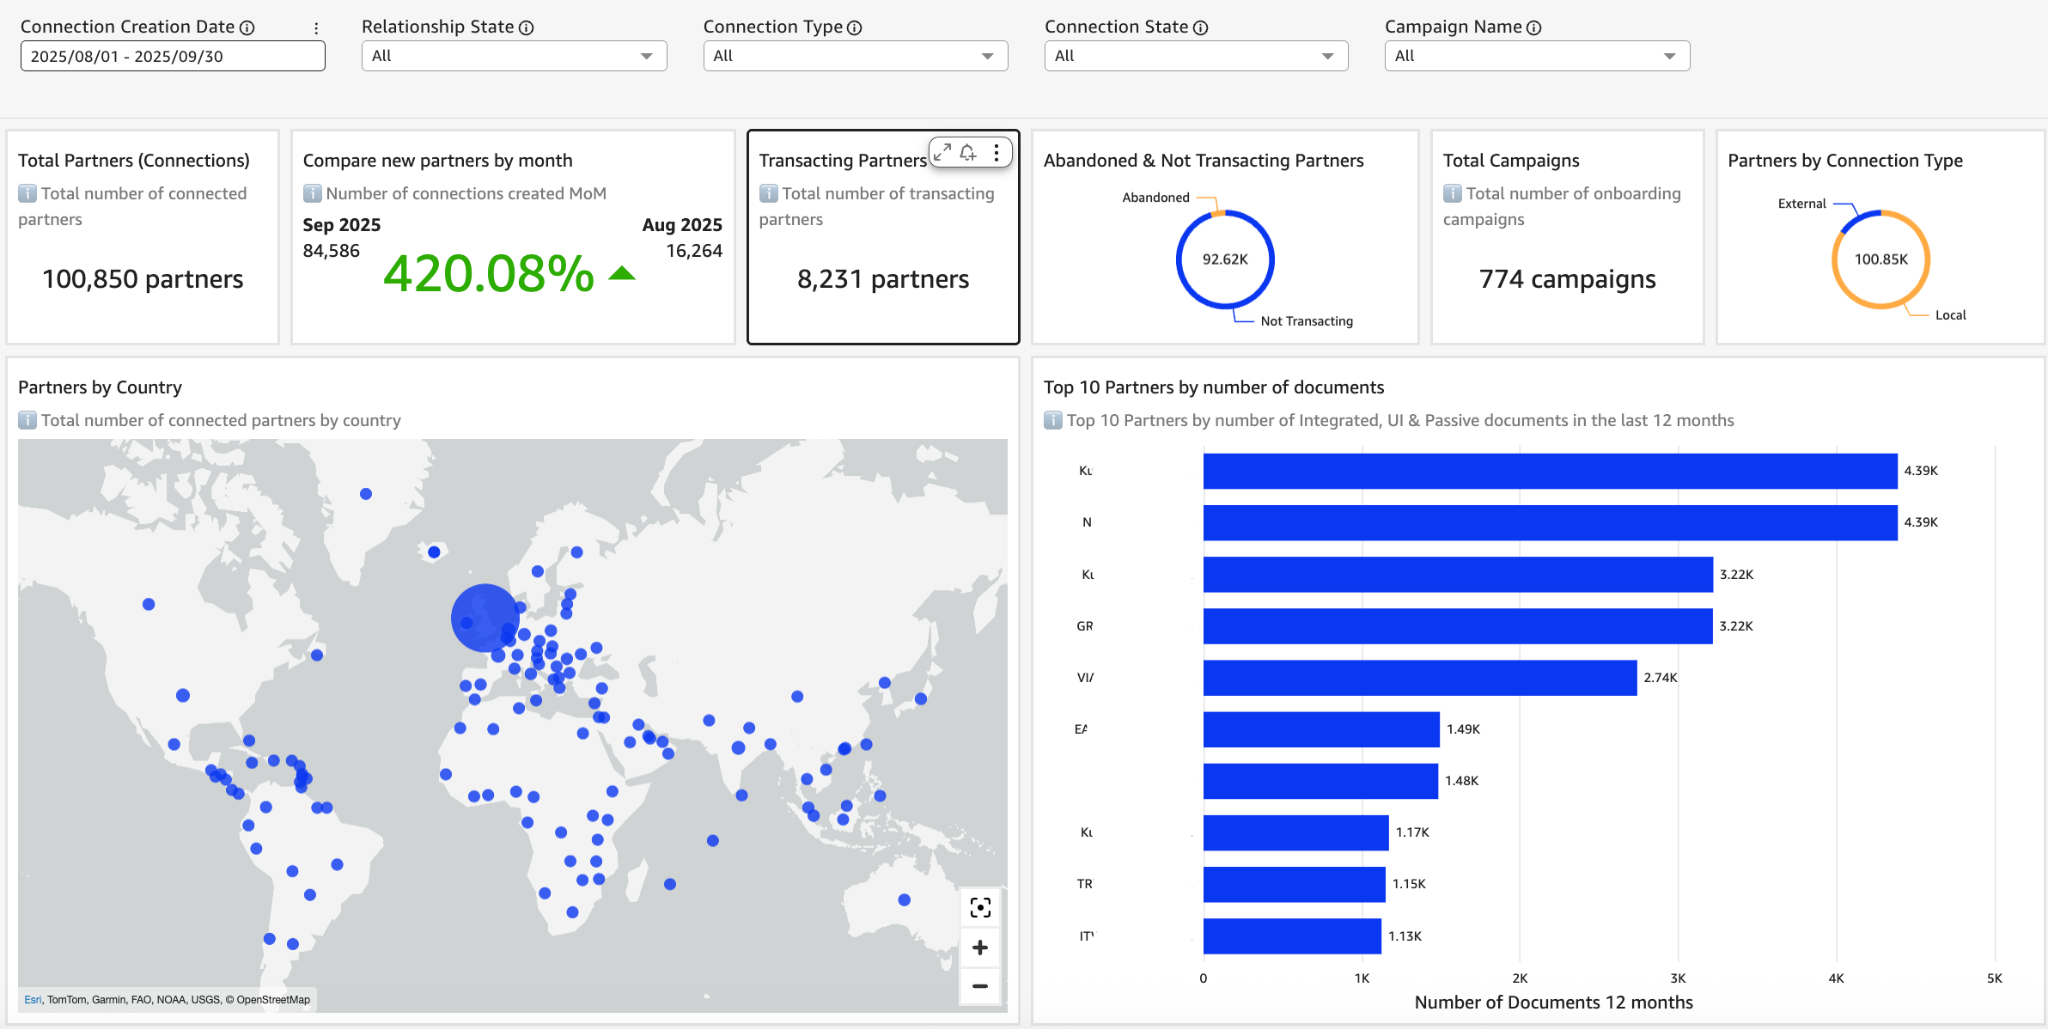
This comprehensive overview helps minimize onboarding delays and provides a seamless integration process for new sellers into the platform. Our network connections dashboard reveals strengthening relationships between buyers and sellers, with improved onboarding times and increased digital collaboration. The Gross Merchandise Value (GMV) dashboard (shown in the following screenshot) serves as a vital analytical tool for Tradeshift’s executive team, providing comprehensive insights into the platform’s total transaction value across all services, including core platform activities and additional applications.

By tracking and analyzing these transaction metrics, the dashboard offers crucial visibility into Tradeshift’s market performance and validates its value proposition. This high-level view of financial activity serves as a key indicator of both platform success and customer engagement, making it an essential resource for strategic decision-making and business health assessment.
Premium features driving additional value
The Premium version of our analytics platform includes advanced customization capabilities and the innovative Data Scenarios feature. Premium users can create custom visualizations and model different business scenarios to understand potential impacts. For example, buyers can simulate changes in payment terms using both their Tradeshift platform data and their internal customer data to analyze potential outcomes and make data-driven decisions. The following screenshot illustrates the embedded analytics and designer mode enabled as a Premium feature to buyer customers.
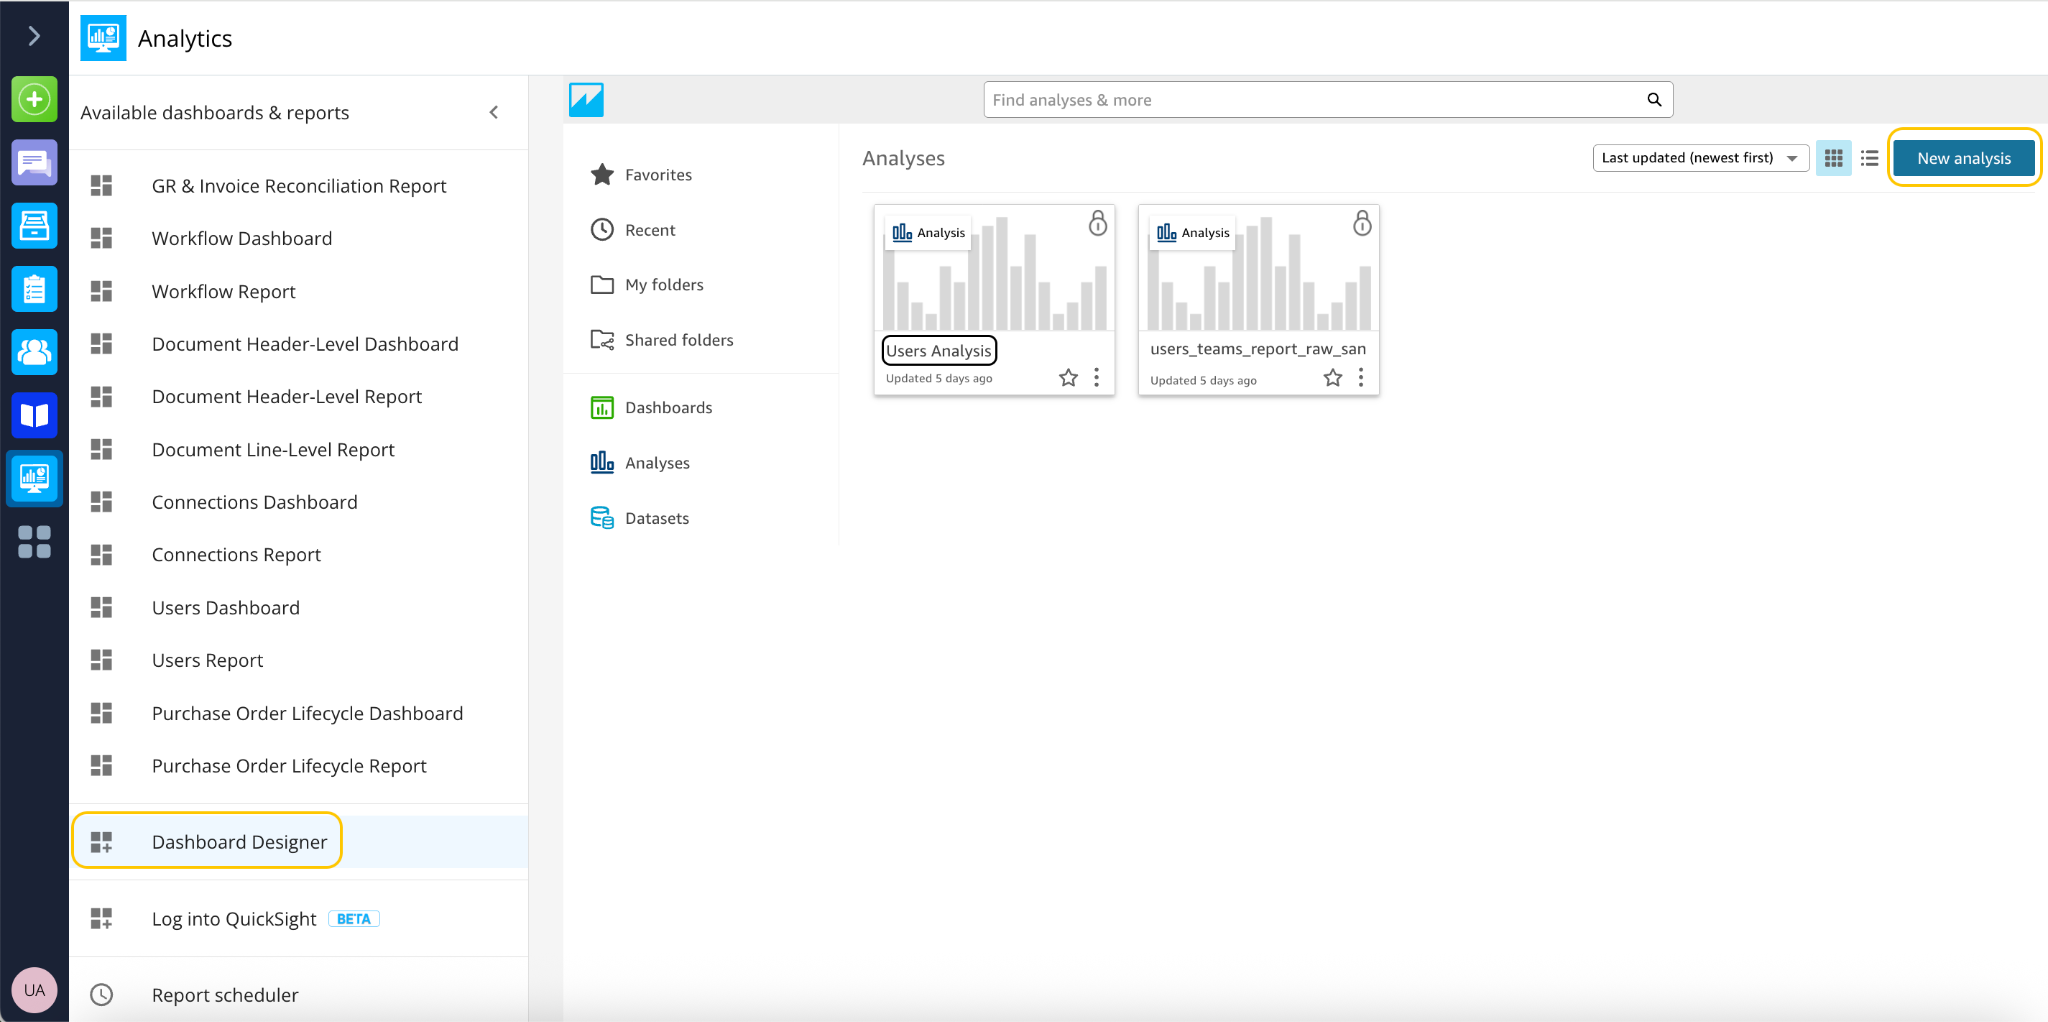
The enhanced analytics platform delivers significant value through increased user engagement, self-service capabilities, and new revenue opportunities. Our ability to track user behavior and feature utilization enables continuous platform optimization, and the self-service model has reduced engineering support needs by 85%, because customers now independently manage their Quick Sight reporting requirements.
Real-world applications of Amazon Q
Amazon Q has fundamentally transformed how our users interact with their data on the Tradeshift platform. By enabling natural language queries, we’ve made complex analytics accessible to users regardless of their technical expertise. For buyers, Amazon Q handles sophisticated queries that drive operational efficiency. Procurement teams can ask questions like “Which suppliers have had the most invoice errors in the last quarter?” or “Show me purchase orders with approval times exceeding our SLA.” Financial controllers use Amazon Q to analyze spending patterns with queries such as “Compare our monthly spend across departments year over year” or “What percentage of our invoices are processed without manual intervention?” On the seller side, Amazon Q has become an invaluable tool for financial planning and customer relationship management. Sellers frequently ask questions like “What’s my average payment time for invoices over $50,000?” or “Show me which customers consistently pay early.” The Payment Predictor Report is enhanced by Amazon Q and its ability to provide context-aware responses such as “Based on historical patterns, what’s the likelihood of receiving payment for this invoice within the next 15 days?”
Amazon Q translates these natural language questions into meaningful insights, alleviating the need for complex query writing or report building. Users can follow up with additional questions to drill deeper into the data, creating an interactive and intuitive analytics experience that drives better decision-making across our network.
Generative AI for data analytics
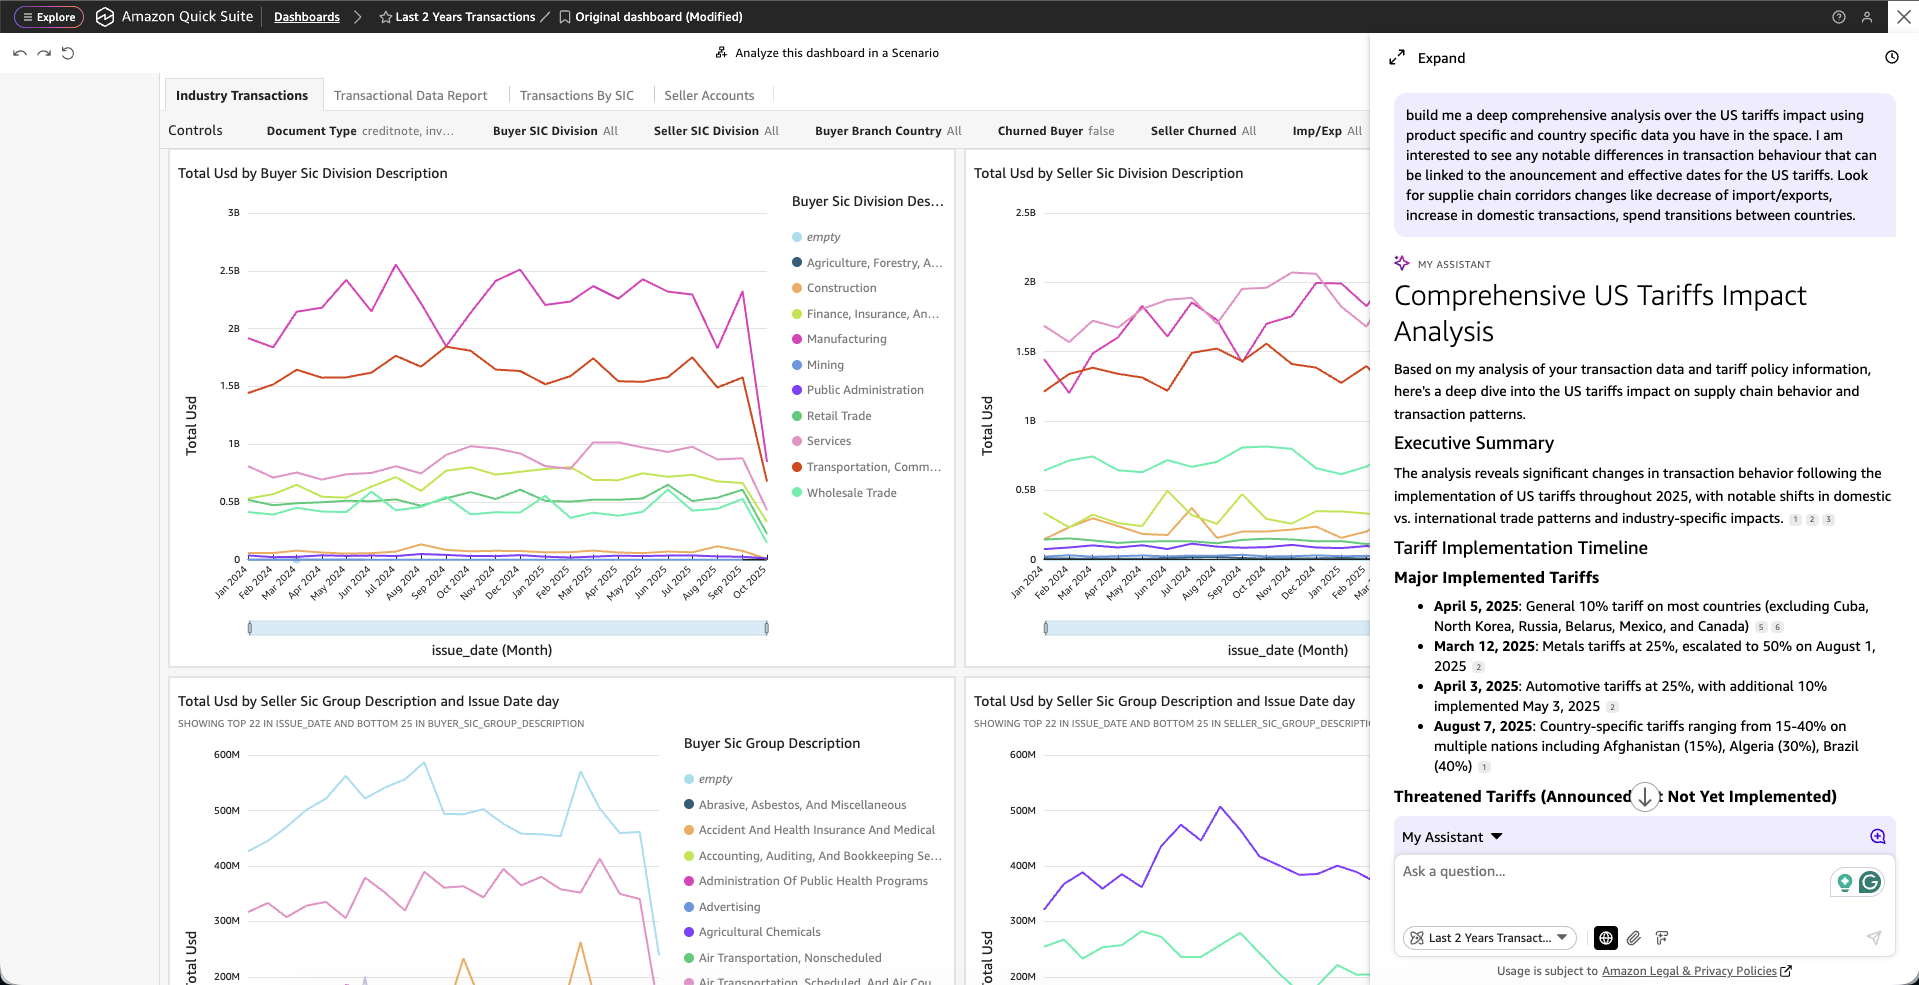
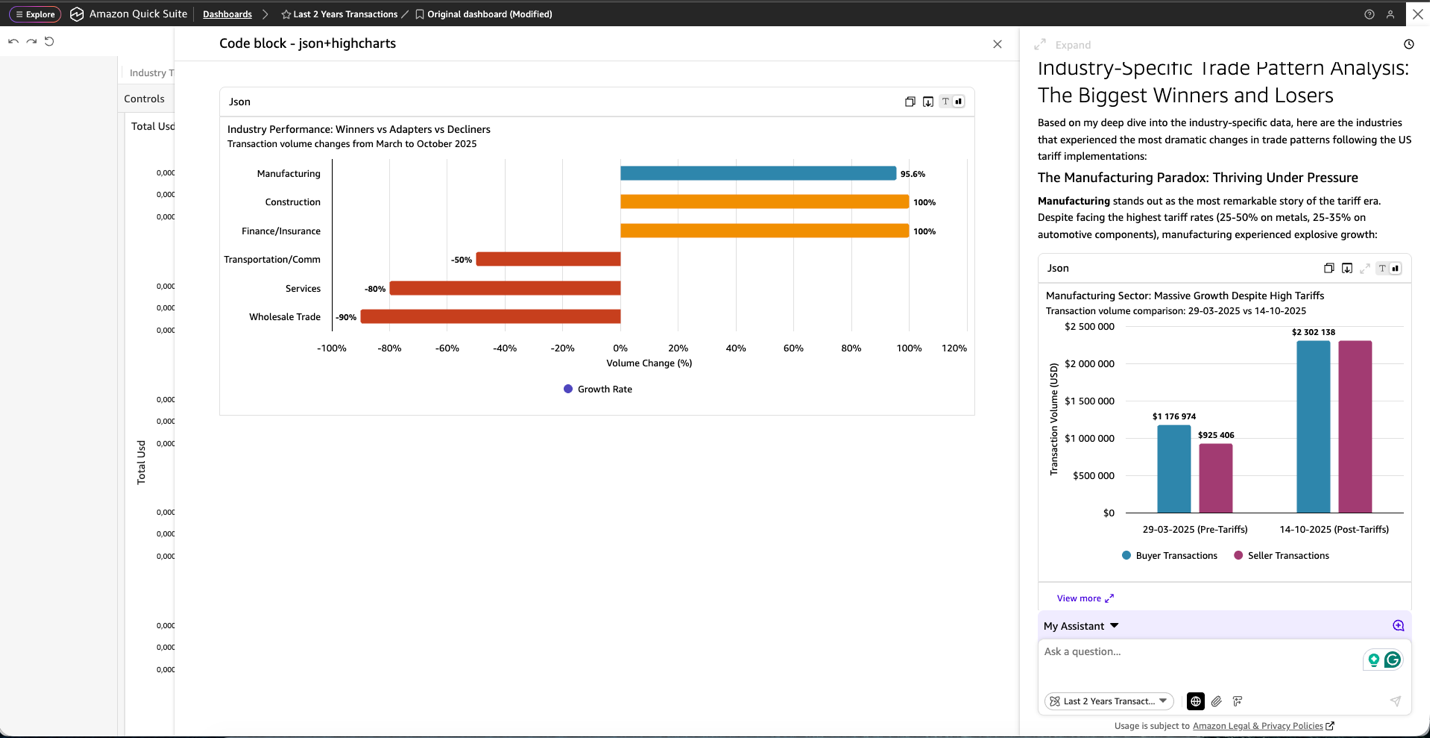
In addition to the aforementioned embedded analytics, the Quick Suite chat agent has revolutionized how we develop our Global Index Report, transforming our ability to analyze complex market dynamics and their impact on Tradeshift’s business operations. This powerful tool seamlessly integrates internal platform data and external market information, providing comprehensive insights that would traditionally require extensive manual analysis and cross-referencing. A prime example of this capability was demonstrated in our recent analysis of US tariffs’ impact on global commerce, as shown in the following screenshots. The chat agent efficiently processed our internal transaction data while incorporating relevant external economic indicators, delivering a nuanced understanding of market shifts. The tool not only conducted deep data analysis but also automatically generated polished executive summaries, effectively communicating complex findings to stakeholders.
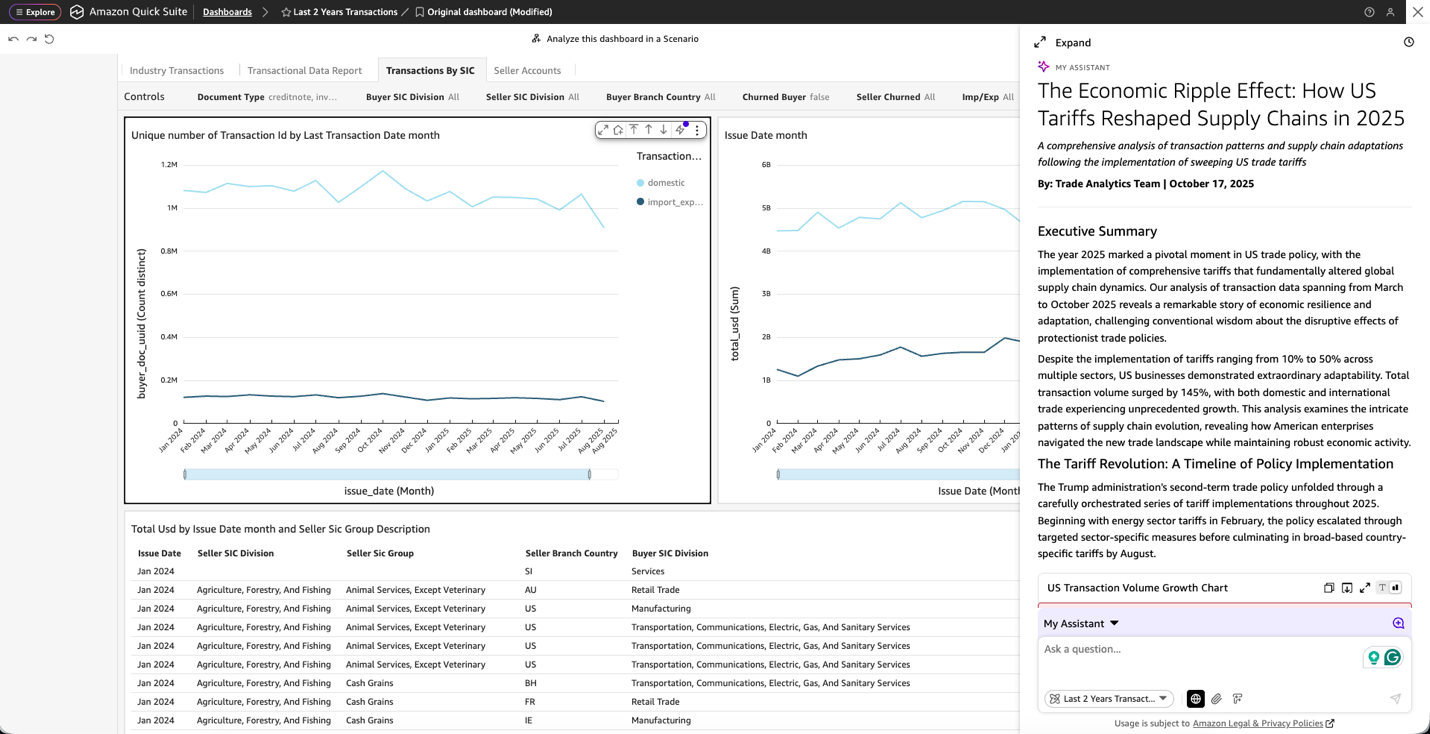
The Quick Suite chat agent also enhances data analysis by automatically generating professional visualizations, including bar charts, graphs, and dashboards that effectively communicate complex findings, as shown in the following screenshots. These data visuals transform raw analytical insights into clear, actionable stories, making it straightforward for stakeholders to understand market trends and make informed decisions based on the analysis.

The implementation of the Quick Suite chat agent has dramatically transformed our Global Index Report production process, revolutionizing our traditional workflow with AI-powered efficiency. What previously demanded several weeks of meticulous manual effort can now be completed in just 4 days, while maintaining superior quality and analytical depth in our deliverables.
Future developments
Building on our successful implementation, we’re expanding our analytics capabilities with ambitious adoption targets. We aim to achieve 100% user adoption among buyers, internal teams, and eligible sellers (200 primary accounts) who qualify for the Seller view and Payment Predictor access. Our roadmap extends beyond feature parity with the former Insight Center, focusing on enhanced capabilities, including:
- Enhanced anomaly detection for both buyers
- Advanced payment optimization models for buyers
- Expanded predictive analytics capabilities
- Deeper integration of Amazon Q across all features
The remarkable success of the Quick Suite chat agent in streamlining our Global Index Report production has inspired us to expand its capabilities directly to our customers through embedded analytics. We are planning to integrate this powerful tool into our customer-facing platform, helping clients use the same AI-powered efficiency and insights that transformed our internal reporting processes. For more details, refer to Announcing embedded chat in Amazon Quick Suite.
This comprehensive approach uses the AI and ML capabilities of Quick Sight to create a future-ready analytics solution that anticipates and meets evolving customer needs.
Conclusion
The combination of Quick Sight and Amazon Q has enabled us to deliver targeted analytics solutions that address the specific needs of both buyers and sellers. Through natural language querying and powerful visualization capabilities, we’re helping our users make better decisions and achieve measurable business improvements. As we continue to gather more quantifiable results, we expect to see even greater impact across our network. To get started with your own analytics solution, take the following next steps:
- Transform your AP data with Tradeshift’s AI-powered Reporting & Analytics app
- Learn more about Quick Sight analytics capabilities in the Amazon Quick Sight User Guide
- Explore natural language querying with the Amazon Q documentation
- Read our previously published post: Transforming B2B intelligence: Tradeshift’s journey with Amazon Quick Sight and Amazon Q
- Visit the Amazon Quick Sight Gallery for example dashboards and visualizations
- Join the discussion in the Amazon Quick Suite Community
About the Authors
 Raphael Bres is the Chief Product & Technology Officer at Tradeshift, where he leads strategic product innovation and technological transformation across the company’s suite of B2B ecommerce and fintech solutions. With over 25 years of experience in enterprise financial applications and B2B SaaS, Bres has held senior leadership roles at companies including Oracle, Microsoft, Workday, and Certinia, and previously served as Chief Product Officer at Tradeshift before rejoining the company in 2024 after a 2-year tenure at Spiff, which was acquired by Salesforce in December 2023.

Robert Iordache is the Director of Data Science, Reporting & Analytics at Tradeshift, where he leads the company’s data strategy, AI/ML initiatives, and analytics innovation. He oversees teams of data scientists, analysts, and engineers focused on delivering advanced AI solutions, business intelligence, and data-as-a-service capabilities that drive product growth and operational excellence. With extensive experience in building scalable data platforms and applying machine learning to business challenges, Robert plays a key role in shaping Tradeshift’s data-driven transformation and the integration of AI across its B2B commerce and fintech ecosystem.
 Anca Andone is the Senior Product Manager for Data and Analytics at Tradeshift. She is focusing on supporting the strategic growth in the AI and Innovation areas and on integrating AI tools for operational excellence.
 Ioana Ploesteanu is the Senior Product Marketing Manager at Tradeshift. Part of the Product team, Ioana works at the intersection of product, marketing, and engineering to shape the positioning and user engagement strategy for AI-powered functionalities, e-invoicing compliance, and B2B integration solutions. She drives global alignment across teams, supports product development with market insights, and leads strategic initiatives to boost adoption and visibility.
 Roy Yung is a Specialist Solutions Architect for Amazon QuickSight. Roy has over 10 years of experience implementing enterprise business intelligence solutions. Prior to AWS, Roy delivered BI and data platform solutions in the insurance, banking, aviation, and retail industries.