AWS Business Intelligence Blog
How Wealth Wizards democratizes financial advice with Amazon QuickSight scenarios
| All your trusted BI capabilities of Amazon QuickSight now come with powerful new AI features that integrate chat agents, deep research, and automation in one seamless experience with Amazon Quick Suite! Learn more » |
This guest post was written by Fiona Murray and Gowthama Narasimha of Wealth Wizards.
Wealth Wizards, part of the Royal London Group, is tackling one of the most pressing challenges in UK personal finance: the advice gap. With only 9% of UK adults receiving regulated financial advice annually and 38% of working-age adults not saving enough for retirement, our mission is to make high-quality financial planning and advice accessible to everyone, not just the wealthy.
Our software as a service (SaaS) platform delivers configurable, user-friendly digital journeys that help individuals make informed decisions about their financial wellbeing. Through our hybrid model, we combine the expertise of regulated financial advisers with innovative technology to create compliant, intuitive guidance and advice experiences. Our solutions are currently available through our partners to over 10 million UK adults, representing more than 20% of the UK adult population.
In this post, we share how Wealth Wizards uses Amazon QuickSight and its scenarios feature to democratize financial advice in the UK, enabling data-driven decision-making across our organization while reducing the burden on our data engineering teams.
Challenges of data analysis
Though our mission is clear, achieving it presented significant data analysis challenges. As our platform evolved and user base grew, we faced increasing demands for one-time, or ad hoc, data analysis. Traditional dashboards and reports weren’t sufficient to answer all the questions our teams had about customer behavior and product performance. Over 12 months, we saw a 50% increase in requests for ad hoc analysis, creating a significant bottleneck for our Data & Insights team.
Before implementing the scenarios capability of Amazon Q in QuickSight, each new exploratory analysis typically required 1–2 hours of runtime, but the actual delivery could take days due to competing priorities and technical dependencies. This delay hindered our ability to respond quickly to emerging insights and evolving customer needs. Although basic self-service options were available, users needed the data engineering team’s help for advanced tasks like statistical analysis. With the scenarios feature in QuickSight, users can avoid this bottleneck and perform complex analyses independently, so data is more accessible to everyone.
Solution overview
We chose QuickSight as our strategic visualization platform, with over 50% of our employees using it daily for key performance indicator (KPI) monitoring and product engagement tracking. The implementation of QuickSight scenarios has transformed how we approach data analysis and decision-making.
The QuickSight scenarios feature has significantly altered how we approach several key business areas. The feature helps our business teams test hypotheses and explore new questions without pre-building dashboards or pipelines. Its intuitive interface has democratized complex data analysis, so our analysts can discover customer behavior patterns and product outcomes without requiring specialized data science expertise. As a lean organization, this efficiency is crucial because our team members need to stay focused on their core responsibilities rather than getting bogged down in dashboard creation and data analysis.
Our solution integrates multiple data sources, including:
- Digital experience data from customer interactions across guidance and advice journeys
- Behavioral analytics from tools like Hotjar and Google Analytics
- Third-party data from services such as Zoopla for property valuations
- Tenant data feeds from partner organizations
- Back-office and Open Finance data for comprehensive customer insights
Scenarios in action
The scenarios feature has transformed how we approach several key business areas:
- What-if and exploratory analysis – We can test hypotheses and investigate questions dynamically, and no longer need pre-configured dashboards or data pipelines.
- Correlation metrics – These metrics make it straightforward for a broader group of analysts to discover connections between data points (like customer actions and product results)—a task that previously required extensive data science expertise.
- Cross-tenant comparisons – We can analyze and compare multiple large datasets from different tenants simultaneously, and are able to uncover meaningful patterns and variations at scale.
- Consumer Duty and outcomes reporting – We can enhance our regulatory compliance by enabling comprehensive analysis of customer behaviors, segments, and vulnerabilities. This way, we can effectively measure and document customer interactions, confidence levels, and financial understanding in alignment with Consumer Duty requirements.
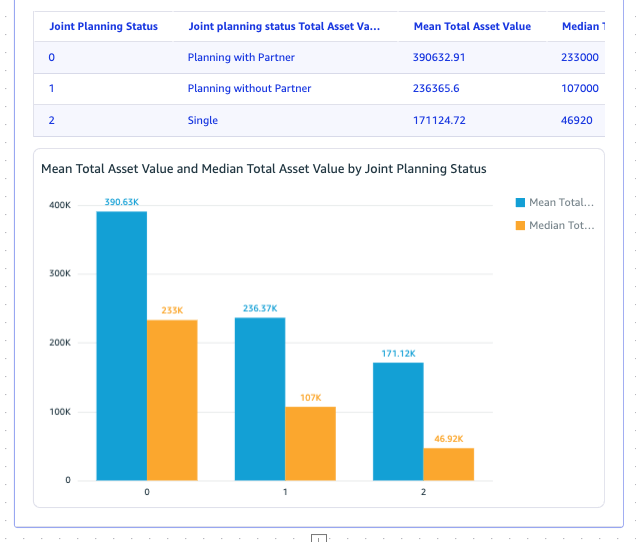
The following example shows how powerful the scenarios feature is: we explored Retirement Planner user data and discovered key demographic insights in just 5 minutes. We asked basic questions such as:
- What is the distribution of users across different age groups?
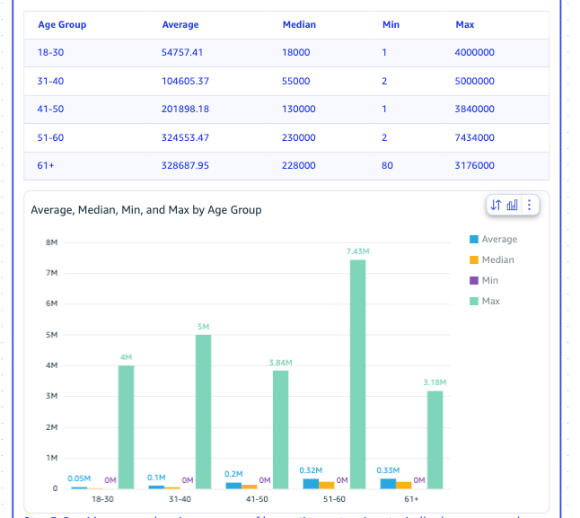
- How does the average pension pot value vary by age group?
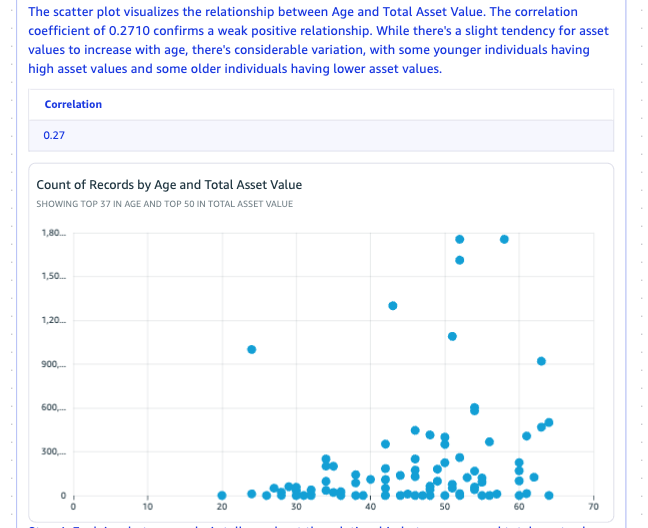
- What is the correlation between age and asset value?
The following screenshots show our results.
 |
 |
 |
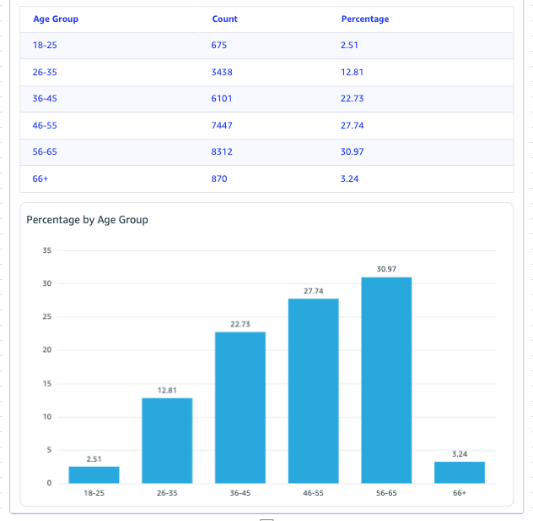 |
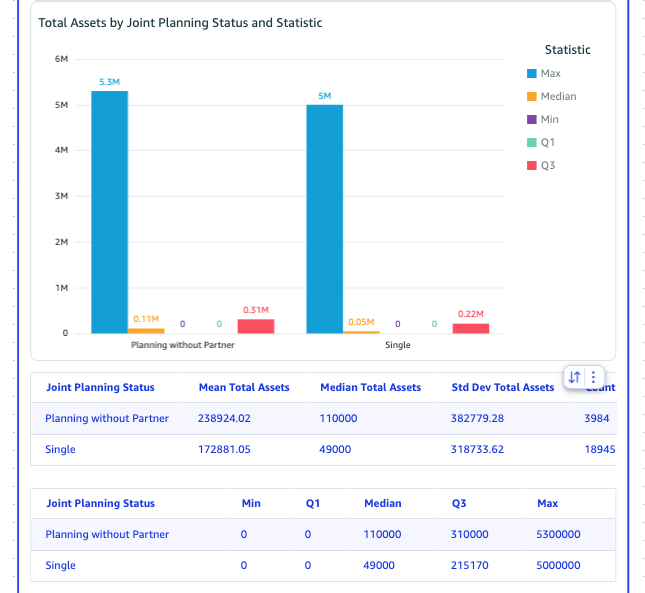
With the scenarios feature, these questions were immediately answered through clear visualizations, helping us spot important trends and summarize key insights effortlessly:
- Total asset comparison by user’s joint planning status
- Statistical correlation between users’ age and their assets
Benefits and results
The implementation of QuickSight scenarios has delivered significant benefits across our organization. Time to insights and complex data analysis has reduced by 40%, so product managers can improve or make changes to the product within the next sprint of go-live. We’ve also achieved a 20% reduction in data engineering time previously spent on ad hoc requests, because product managers and business users can now perform self-service analysis. The pay-per-session pricing model has proven more cost-effective than our previous solution, resulting in a 40% decrease in operational costs.
The QuickSight scenarios feature has also dramatically reduced our time to insight from days to minutes for exploratory analysis. This capability has been especially valuable for our Consumer Duty reporting, helping us assess behavioral themes, segment customer groups, and identify potential vulnerabilities more efficiently. This has led to faster decision-making, reduced manual data processing, and increased confidence in our data-driven insights.
The impact of scenarios in QuickSight has extended beyond operational efficiencies. Teams can now explore, analyze, and test hypotheses directly, fostering a culture of data curiosity across the business. This self-service capability has led to increased data trust, because teams can cross-check results and validate insights independently. Product development decisions are now made faster and with greater confidence, based on real behavioral insights rather than assumptions.
Looking ahead
We’re continuing to expand the use of QuickSight scenarios across our organization, and are looking to double the current adoption by end of 2025. Our focus is on building a culture where data-driven decisions are the norm, not the exception. Through internal training programs, we’re enabling more team members to use these tools effectively, especially in roles where rapid insight generation can have the most significant impact.
The scenarios feature represents a fundamental shift in how we approach data analysis. While traditional QuickSight dashboards serve our monitoring and reporting needs, the scenarios feature enables exploratory, what-if, and correlation analysis. This feature proves especially useful for our product teams, data analysts, and leaders who require rapid insights into intricate customer patterns and market dynamics.
Conclusion
QuickSight has helped us transform from a traditional reporting culture to a truly data-driven organization. By democratizing access to data analysis tools, we’ve improved decision quality, increased data trust across the business, and enhanced our ability to deliver on our mission of making financial advice accessible to all.
By combining visualization capabilities and scenarios in QuickSight, we have enhanced our understanding of customer behaviors, optimized engagement, and improved outcomes—ultimately strengthening financial resilience for millions of UK adults.
To learn more about how you can implement similar solutions, refer to the following resources:
- Solve complex problems with new scenario analysis capability in Amazon Q in QuickSight
- Working with scenarios in Amazon QuickSight
- Scenarios capability of Amazon Q in QuickSight
About the Authors
 Fiona Murray is Head of Insight at Wealth Wizards, where she leads the interpretation of digital journey data and enables the product teams to make informed, data-driven decisions. Her work supports the enhancement of customer outcomes and the acceleration of business performance. Fiona is a passionate advocate for customer-led innovation and believes in the power of data to drive meaningful, measurable change.
 Gowthama Narasimha is the Lead Data Engineer at Wealth Wizards, where he leads the data engineering team and the development of advanced data systems to support innovative financial wellbeing solutions. With expertise in data architecture and cloud technologies, Gowthama drives data-driven decision-making and operational efficiency while mentoring teams to excel in dynamic environments. He’s passionate about leveraging data to make financial advice more accessible.