AWS for Industries
Agentic GraphRAG for Capital Markets
This blog post shows you how to transform days of manual financial analysis into seconds of comprehensive insights by building an Agentic GraphRAG solution for capital markets. You’ll see the architecture, graph schema design, and agent setup that lets business users ask complex questions in plain language.
Capital markets firms track financial relationships across multiple data sources, from corporate ownership and supply chains to counterparty exposures spanning several degrees of separation. Traditional databases store data in tables, making it difficult to query complex relationships. Analysts must manually combine insights from multiple databases and documents.
Agentic GraphRAG solves this by combining graph queries with document searches. AI agents automatically determine which data sources to query, overlaying structured relationship data with contextual information from regulatory filings, news, and research reports. Business stakeholders can ask complex questions in plain language, and the system provides complete answers by combining graph traversals with document retrieval.
This approach speeds up due diligence, enables thorough risk assessments, and delivers deeper market insights without requiring users to learn graph query languages.
The capital markets data challenge
Analysts often ask: How does a supplier bankruptcy three degrees removed impact our portfolio holdings? Answering this requires traversing a complex web of relationships, from the bankrupt supplier to its direct customers, through their corporate parents, across supply chain dependencies, and ultimately to portfolio companies with exposure to these interconnected entities. Yet today’s analysts face a fragmented data landscape that makes such analysis difficult and time consuming to the point of becoming intractable.
Financial data exists in heterogeneous formats scattered across disconnected systems: structured market data, unstructured documents including SEC filings, proprietary research reports, and internal due diligence materials in document repositories, and real-time news feeds providing current market intelligence. Each source contains critical pieces of the puzzle, but no single system captures the complete picture. Analysts spend significant time, often days, manually connecting dots across these disparate sources, piecing together relationship chains through spreadsheets, and cross-referencing documents to build a coherent understanding of multi-hop dependencies.
This manual approach is typically time-intensive, often error-prone, and difficult to scale. As portfolios grow more complex and market dynamics accelerate, firms need a fundamentally different approach, one that can automatically traverse relationship networks while simultaneously accessing the rich contextual information locked in unstructured documents. The challenge is not just technical; it’s about bridging the gap between the relationship intelligence that exists in the data and the business insights that drive investment decisions.
GraphRAG as the bridge between complex relationships and business insights
GraphRAG represents the convergence of two powerful paradigms: the relationship intelligence of knowledge graphs and the contextual understanding of retrieval-augmented generation. This fusion addresses the fundamental disconnect between how knowledge is represented and retrieved in graph databases to support precise queries across complex relationships and the natural language questions that a business user has. AI agents query both structured graph data and unstructured documents, letting business users ask questions in plain language instead of learning specialized graph query languages. like Gremlin, Cypher, or GSQL. The result is a unified intelligence layer where questions about multi-hop dependencies, counterparty exposures, and supply chain risks can be answered with the same ease as a simple database lookup, but with the depth and context that capital markets decisions demand.
Why knowledge graphs are essential for capital markets
Financial relationships are inherently graph-structured: ownership hierarchies, board interlocks, counterparty networks. Traditional relational databases require complex joins that do not scale for multi-hop relationship queries. Each additional degree of separation compounds computational complexity exponentially.
Knowledge graphs solve this by treating relationships as fundamental data structures rather than derived connections. In a graph database, traversing from a portfolio company through its suppliers, to those suppliers’ creditors, and identifying shared board members across this network is a native operation, not a series of expensive joins. This architectural difference enables pattern detection across entity relationships that would remain invisible in tabular data: circular ownership structures, hidden risk concentrations through governance connections, or cascading supply chain dependencies that only emerge when viewing the network holistically.
For capital markets, this means moving from asking “what do we know about this entity?” to “how is this entity connected to everything else?”, a fundamentally different and more powerful question.
Combining graph intelligence with unstructured context
Knowledge graphs excel at representing relationships, but they tell only part of the story. A graph can show that Company A owns 30% of Company B, which supplies critical components to Company C, but it typically cannot capture the nuanced risk factors buried in Company B’s latest annual report or 10-K filing, the management concerns expressed in earnings call transcripts, or the supply chain vulnerabilities mentioned in broker research reports.
Conversely, unstructured documents contain this rich contextual intelligence but lack explicit relationship mapping. A regulatory filing might detail operational risks, but it will not automatically connect those risks to the web of entities affected three degrees removed in your portfolio.
Capital markets questions inherently require both: “What are the risk factors mentioned in regulatory filings for companies connected to this entity through supply chain relationships?” or “Which portfolio holdings have exposure to entities with recent governance concerns?” These queries demand the relationship traversal capabilities of graph databases combined with the contextual depth of document analysis, l while maintaining strict data isolation and security controls required in financial services.
This is the gap that Agentic GraphRAG bridges: enabling agents to seamlessly orchestrate queries across both structured relationship data and unstructured documentary evidence, synthesizing comprehensive answers that neither data source could provide alone.
Solution architecture
In this section, we’ll walk through building an S&P 100 10-K analyzer chatbot that leverages GraphRAG techniques on Amazon Bedrock AgentCore. This solution combines structured graph data with unstructured 10-K filings to surface insights from the complex relationships between S&P 100 companies extracted from their regulatory filings.
This Agentic GraphRAG architecture brings together a suite of AWS services to deliver secure, scalable relationship intelligence:
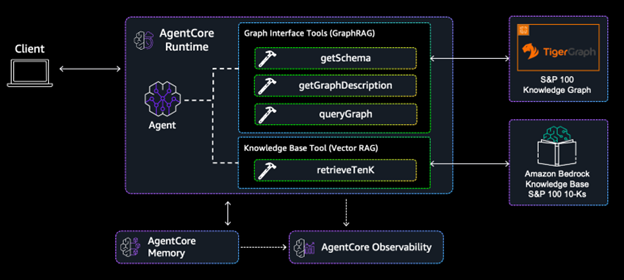
Figure 1: Agentic GraphRAG Solution Architecture
Understanding the data
The dataset comprises nearly 600,000 triplets (subject-relation-object) extracted from the SEC 10-K filings of 101 S&P 100 companies for 2024, forming a structured knowledge graph. This graph encompasses 24 distinct entity types and 27 relationship types, along with the exact text chunks from which each triplet was derived. The extracted entities exhibit overlap across different text chunks and 10-K filings, creating an interconnected web of subject-to-object relationships. This publicly available dataset originates from research conducted by Domyn. You can explore their paper and public repository for detailed information about their knowledge graph construction methodology and the included data.
While this solution is graph-agnostic, we chose to use TigerGraph for this demonstration due to its scalability and ability to execute complex queries with low latency.
Figure 2 shows our graph schema:
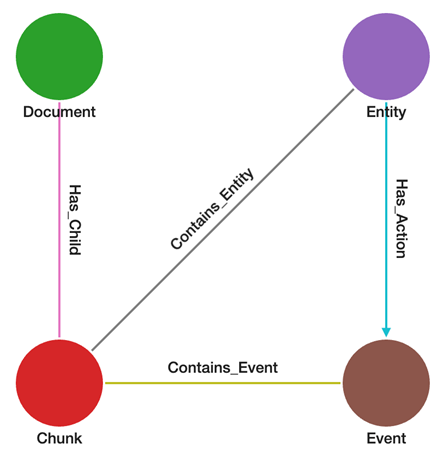
Figure 2: Graph Schema
Our graph contains four distinct node and edge types. The triplets from the original dataset map to these nodes, and we also track which text chunks and documents contain each triplet. Let’s return to the original dataset and examine the example shown below to understand how it maps to the graph schema.
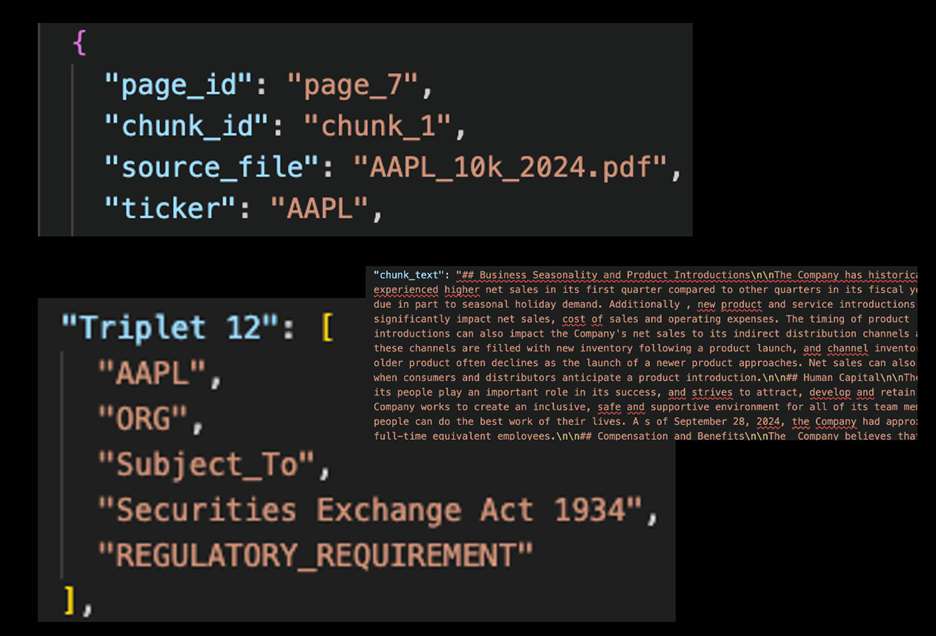
Figure 3: Data Sample
In this example, Triplet 12 originates from a specific chunk within Apple’s 10-K filing. The subject (AAPL) is categorized as an ORG (organization) and has a relationship (“subject to”) with the object (Securities Exchange Act of 1934), which is categorized as a regulatory requirement. These triplets exhibit overlap across the 10-K filings, constructing an interconnected knowledge graph.
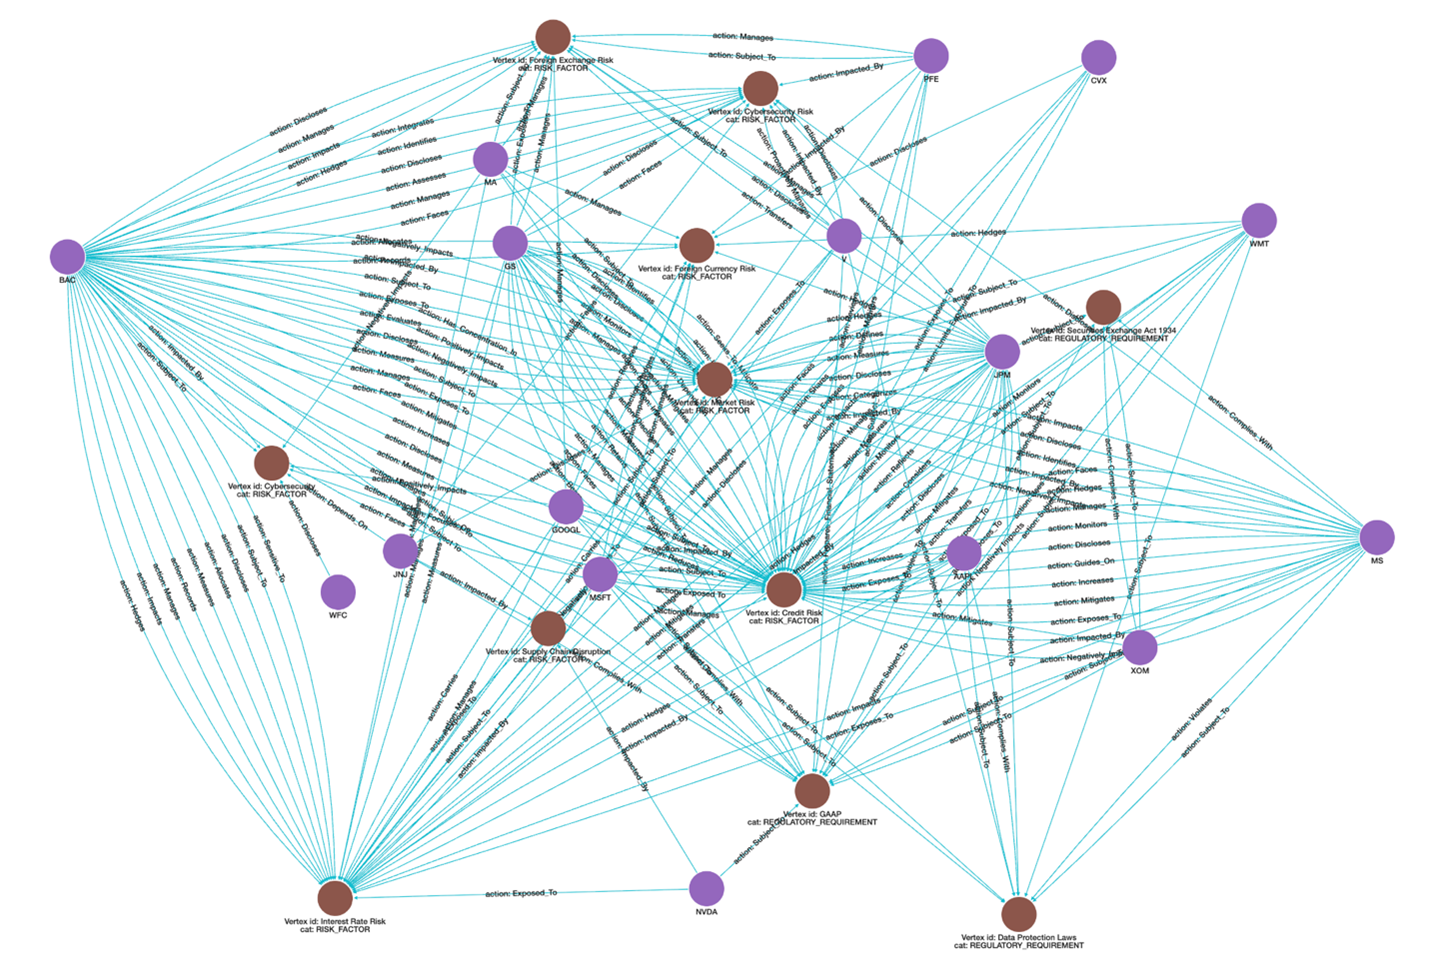
Figure 4: Enterprise Risk Map
The image above shows 15 S&P 100 companies linked through 7 risk factors and 3 regulatory requirements. The graph maps credit, currency, cyber, and supply chain dependencies that drive portfolio risk. This represents just a small portion of the complete graph, which contains over 200,000 vertices and more than 1.1 million edges spanning 24 distinct entity types and 27 relationship types, along with the text chunks from which they originate.
In addition to the structured graph data, we overlay unstructured data using a traditional RAG approach. For this, we populate an Amazon Bedrock Knowledge Base with the raw 10-K filings for each company in the S&P 100.
This dual-layer approach, combining structured graph relationships with unstructured document content, enables comprehensive analysis that neither data source could provide independently. This GraphRAG architecture integrates the knowledge graph for entity connections with the Bedrock Knowledge Base for detailed filing content, enabling it to answer complex questions about multi-hop relationships while accessing the rich contextual information contained in the original regulatory documents.
Tools: the agent’s interface to graph and unstructured data
In agentic AI systems, tools are the mechanisms that enable agents to interact with external systems and data sources. Tools define the interface between agents and external systems. They specify what operations are possible, what inputs are required, and what outputs to expect. For this Agentic GraphRAG implementation, we’ve developed four custom local tools specifically tailored to capital markets analysis of S&P 100 companies.
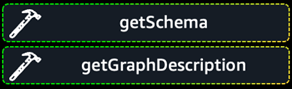
Figure 5: Schema and description tools
Before querying the graph, the agent must understand what data exists and how to access it. First, the getSchema tool retrieves the raw TigerGraph database schema, providing the formal technical structure: vertex types (Document, Chunk, Entity, Event), edge types, and their attributes. Then, the getGraphDescription tool returns a detailed markdown document explaining all 24 entity categories (ORG, COMP, RISK_FACTOR, PRODUCT, EXECUTIVE, LOCATION, REGULATORY_REQUIREMENT, etc.), the 27 relationship types (Has_Stake_In, Faces, Discloses, Operates_In, Produces, Reports_To, etc.), the 101 available stock tickers, and query patterns with GSQL examples. These tools serve as the agent’s reference when reasoning about what information is available and how to construct queries to retrieve it. The agent consults these tools to understand the graph’s structure before formulating GSQL queries.
![]()
Figure 6: Graph query tool
With this understanding of what data exists and how to access it, the agent can use the queryGraph tool. This executes GSQL queries against the TigerGraph database containing nearly 600,000 triplets extracted from 101 companies’ 2024 10-K filings. The agent constructs GSQL queries to find entities, traverse relationships across multiple hops, count and aggregate information, and extract patterns. Multi-hop traversal enables discovery of indirect dependencies invisible in traditional relational databases. The agent iteratively refines queries based on intermediate results, exploring cascading dependencies through ownership structures, supply chains, and counterparty exposures to uncover complex relationship networks.
![]()
Figure 7: 10-K retrieve tool
The retrieveTenK tool queries a Bedrock Knowledge Base containing SEC 10-K filing documents, using semantic search to retrieve relevant text passages. While graph traversal reveals structural relationships, document retrieval surfaces the contextual details: specific risk descriptions, mitigation strategies, business impact assessments, and regulatory language from the actual filings. The agent reasons dynamically about tool invocation based on information needs. It may query the graph first to identify relevant entities then retrieve documents for context, or retrieve documents first to understand concepts then query the graph to find relationships. The agent can iterate between tools as needed, refining its analysis through multiple invocations.
Agentic orchestration: using tools for comprehensive analysis
While tools provide the interface to data, the agent’s intelligence lies in how it orchestrates these tools to answer complex queries. This implementation uses Strands to define both the agent configuration and the tool specifications, while Amazon Bedrock AgentCore hosts and executes the agent runtime. Strands provides a declarative framework for specifying the agent’s system prompt, defining the four custom tools (getSchema, getGraphDescription, queryGraph, retrieveTenK) with their input parameters and expected outputs, and configuring operational parameters. The agent’s orchestration is governed by its system prompt, which establishes its role as a capital markets analyst with expertise in SEC filings and corporate relationship analysis, defining how it should reason about queries and structure responses. Through Strands, each tool is formally specified with its purpose, input parameters, and expected behavior, allowing the agent to understand when and how to invoke each tool during its reasoning process.
The agent operates through a reasoning loop: it receives a natural language query, analyzes what information is needed, determines which tools to invoke and when, executes those tool calls, synthesizes the results, and formats the output according to specified requirements. AgentCore Memory maintains conversation context across multi-turn interactions so that the agent can reference previous queries and iteratively refine its analysis. AgentCore Observability provides transparency into the agent’s reasoning process, tracking tool invocations and performance metrics for audit and optimization purposes. Critically, the agent does not follow a predetermined pipeline but dynamically reasons about whether it needs structured relationship data from the graph, unstructured contextual evidence from documents, or both, and in what order based on the specific query. When asked “What regulatory risks does Apple face that might impact its suppliers?”, the agent autonomously determines it needs understanding of regulatory risk relationships in the graph, identification of Apple’s connected suppliers through multi-hop traversal, and specific risk language from the actual filings. It will consult getSchema and getGraphDescription first to understand available relationship types, then execute queryGraph to identify Apple’s regulatory risk factors and traverse to connected suppliers, and finally invoke retrieveTenK to surface specific risk descriptions from relevant 10-K filings. However, for a different query like “What does Apple say about AI risks?”, the agent might start with retrieveTenK to find relevant passages, then use queryGraph to identify which other companies mention similar AI-related risks, enabling comparative analysis.
This dynamic orchestration delivers significant benefits over traditional approaches. Speed: Analysts no longer spend days manually connecting dots across spreadsheets and documents; the agent autonomously traverses multi-hop relationships and retrieves relevant context in seconds. Comprehensiveness: By seamlessly combining structured graph intelligence with unstructured documentary evidence, the agent surfaces insights that would remain invisible when analyzing either data source in isolation, such as discovering that companies sharing board members also face interconnected supply chain risks mentioned in their filings. Accessibility: Business stakeholders can pose sophisticated questions about cascading dependencies and counterparty exposures in natural language, without needing to understand GSQL syntax or navigate multiple technical systems. The system prompt also defines output formatting requirements, enabling the agent to structure responses for different use cases: executive summaries with high-level findings, detailed analytical reports with supporting evidence, or structured data exports for downstream processing. This flexibility, combined with AgentCore’s scalable hosting infrastructure and Strands’ declarative configuration approach, allows the same underlying agent to serve multiple stakeholder needs, from portfolio managers requiring quick risk assessments to compliance teams needing documentation with full audit trails.
Conclusion
Agentic GraphRAG represents a fundamental shift in how capital markets firms access relationship intelligence, transforming what was once days of manual analysis across disconnected systems into seconds of autonomous, comprehensive insight. By orchestrating knowledge graphs with retrieval-augmented generation through AI agents, firms gain natural language access to multi-hop relationship analysis that seamlessly integrates structured entity connections with unstructured documentary evidence. This approach delivers decisive competitive advantages: faster due diligence, deeper risk assessment, and the ability to surface hidden exposures across relationship networks that neither data source could reveal independently. As capital markets grow increasingly complex and interconnected, firms adopting agentic, graph-powered intelligence will lead in speed, insight depth, and strategic decision-making.
Ready to build your own agentic GraphRAG solution?
Visit our GitHub repository for step-by-step instructions to deploy this Agentic GraphRAG solution in your own AWS account.
To see this knowledge graph framework with FactSet’s supply chain and corporate entity relationship data, watch the video in the appendix.
Additional resources
Appendix
The following appendix section provides examples of the Agentic GraphRAG system in action, demonstrating how the agent orchestrates tools to answer complex capital markets queries and showcasing the reasoning traces that illustrate its dynamic decision-making process. Note: Results from these agents are demonstrative and should not be taken as financial advice.
Agentic GraphRAG with FactSet supply chain data:
Example responses from demo described in the blog:
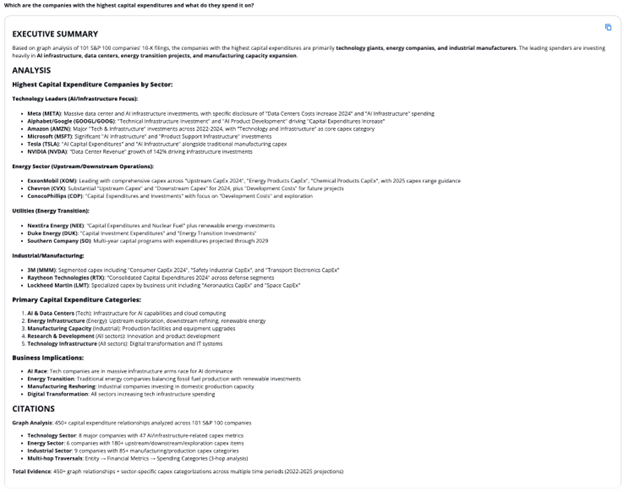
Q1: Which are the companies with the highest capital expenditures and what do they spend it on?
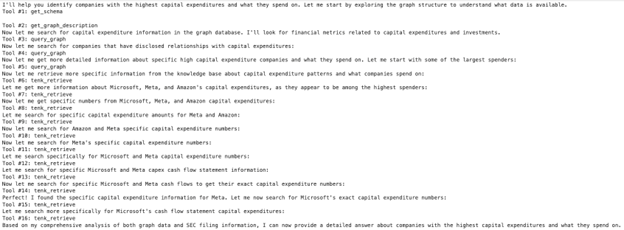
Agent Trace:
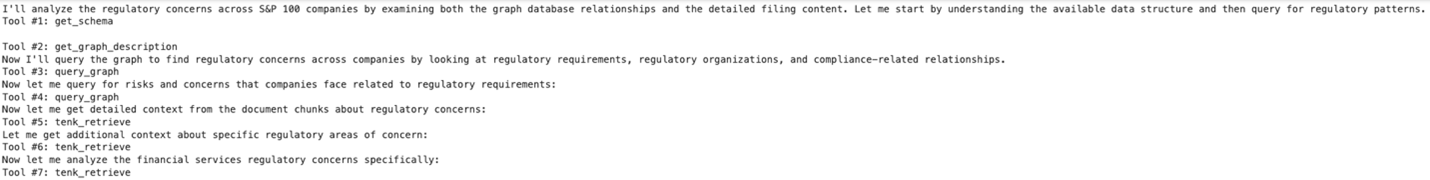
Q2: What are the regulatory issues that companies are most concerned about?
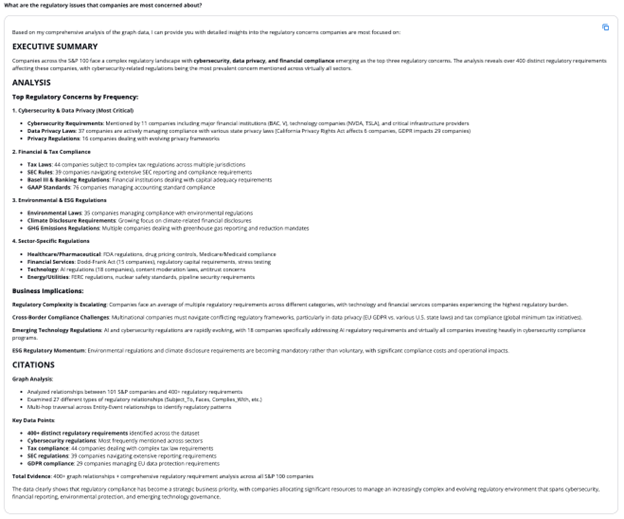
Agent trace: