AWS Cloud Operations Blog
Amazon CloudWatch RUM now supports mobile application monitoring
Today, we’re excited to announce Amazon CloudWatch RUM for mobile, extending AWS’s Real User Monitoring (RUM) capabilities to iOS and Android applications. This expansion brings the same monitoring tools previously available only for web applications to mobile developers as well.
As mobile devices become increasingly central to our daily lives, ensuring optimal performance and user experience in mobile apps is more critical than ever. However, monitoring mobile apps present unique challenges due to the variety of devices, operating systems, application versions, network conditions, and user interactions involved. Mobile app developers face a persistent challenge: “app works perfectly in testing, but real users experience performance issues”. While synthetic testing and traditional monitoring methods do provide insights into real-world performance, they lack the data required for understanding the end-user experience. That’s where CloudWatch RUM Mobile comes in, allowing you to collect metrics that provide deep insights into how your mobile app performs in the hands of actual users.
Amazon CloudWatch RUM for Mobile
Amazon CloudWatch RUM for Mobile helps you gather crucial performance data and user behaviour metrics directly from the end user mobile apps, as they’re being used. By integrating a lightweight SDK into your Android or iOS app, you can capture a wealth of information about app performance, user interactions, and potential issues affecting the user experience.
To get started you just need to create an “app monitor” in CloudWatch RUM console, integrate the SDK into your app, and deploy. The SDK runs in the background as users navigate through your app, sending valuable data to RUM for consolidation and analysis. This tool can be used standalone or in conjunction with other AWS services such as Amazon CloudWatch Application Signals and AWS X-Ray to provide a comprehensive view of your application’s performance across web and mobile platforms.
Key benefits that transform the development process
CloudWatch RUM Mobile empowers development teams to move from reactive debugging to proactive optimization. You collect real-time performance metrics from actual users and identify performance issues before they impact user satisfaction. The system monitors screen load times, tracks app crashes, ANRs (Application Not Responding) for Android or App hangs in iOS with full context, and visualizes all this data through comprehensive dashboards.
The transformation is immediate: instead of waiting for user complaints or trying to recreate bugs, you have clear, actionable insights into what your users experience every time they interact with your app.
Getting Started: Your path to enhanced mobile monitoring
In this blog, you will learn how to integrate Amazon CloudWatch RUM into your Android and iOS mobile apps. To begin using CloudWatch RUM for Mobile, follow these detailed steps to set-up and implement monitoring for your Android or iOS app.
Setting up an app monitor for Android
To get started, first an “app monitor” needs to be created. To do this open the AWS CloudWatch console and then navigate to Application Signals and select RUM. Next click “Add app monitor”
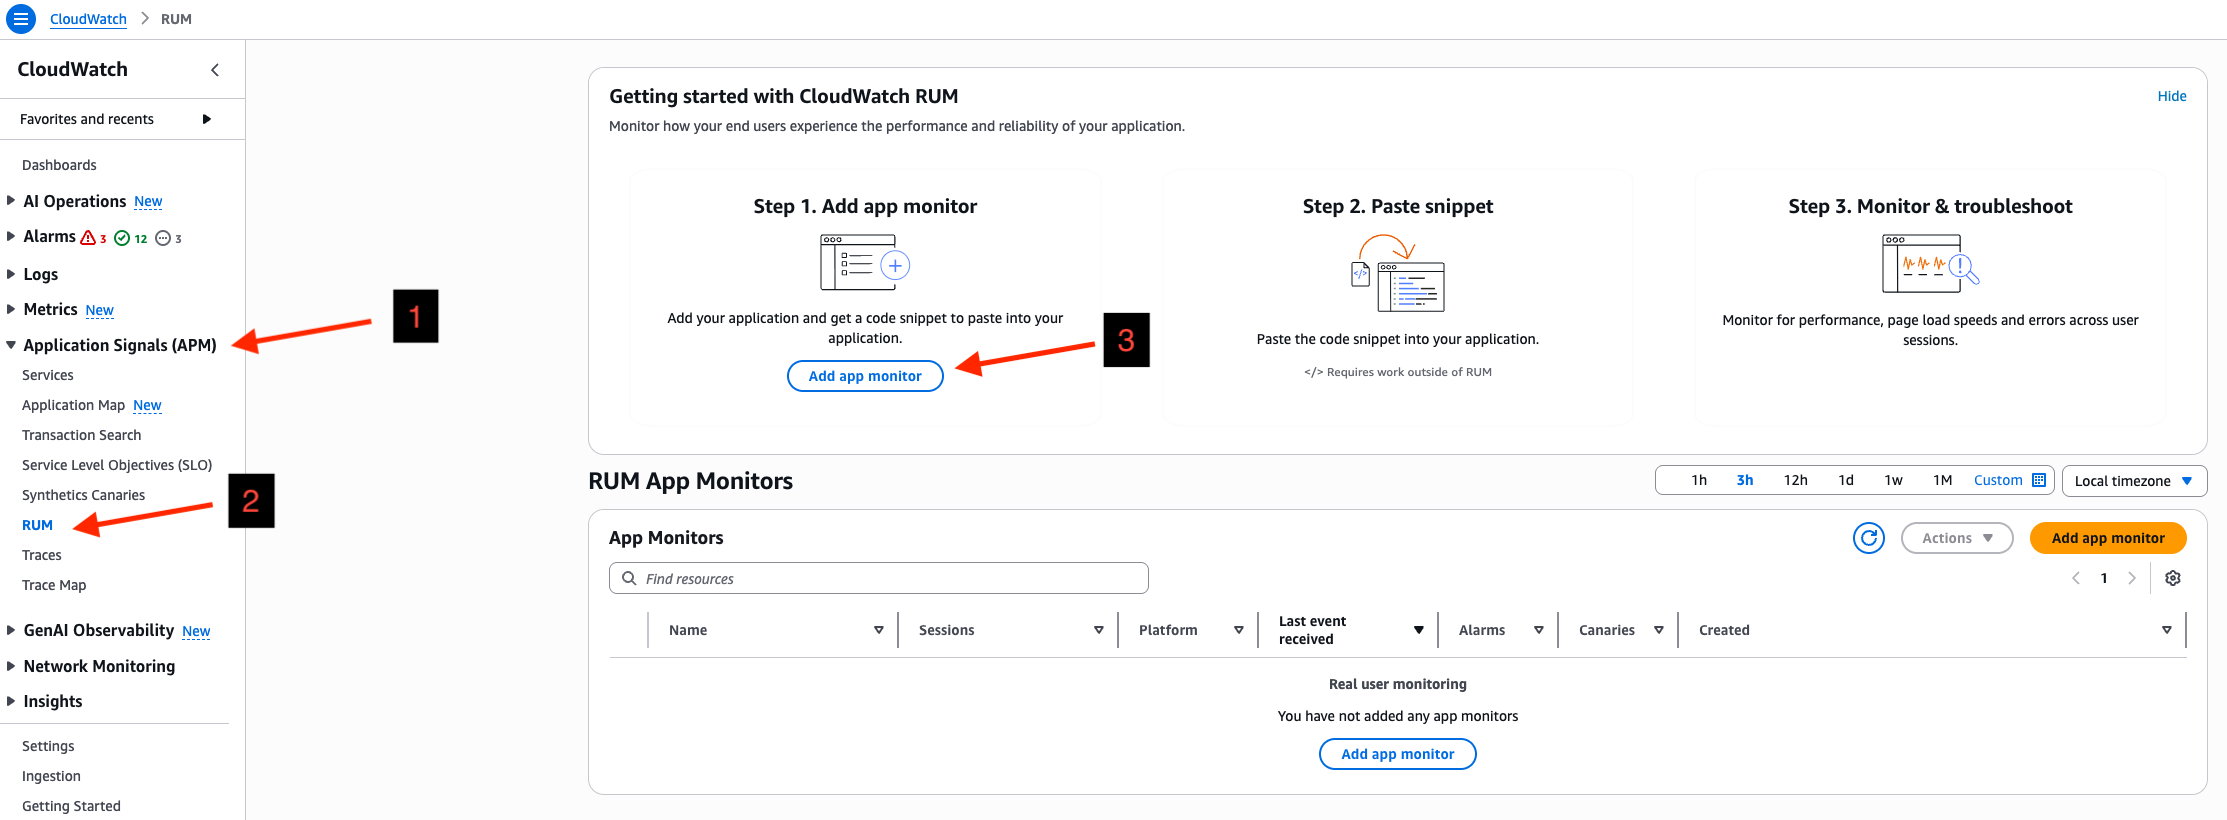
Figure 1: Create app monitor via AWS CloudWatch console
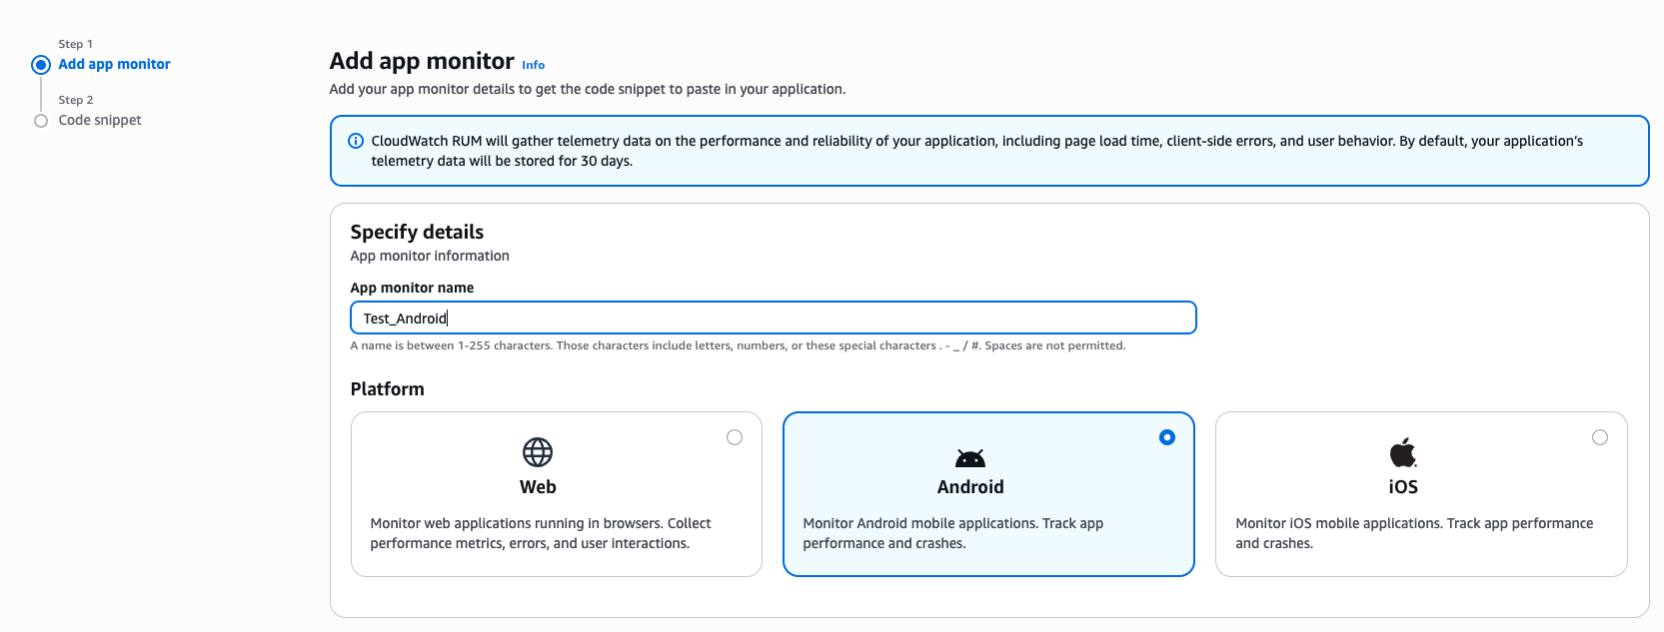
Figure 2: Create app monitor – Options for Android and iOS
There are few “optional” fields which can be enabled based on your requirements –
- If you want the RUM telemetry to be available in Amazon CloudWatch Logs, the check the “Data Storage” option
- If you want to use Resource Based Policies to control access, you can check “Attach a public Resource Based Policy”
- If you want Spans to be available in X-Ray, check “Active tracing” option
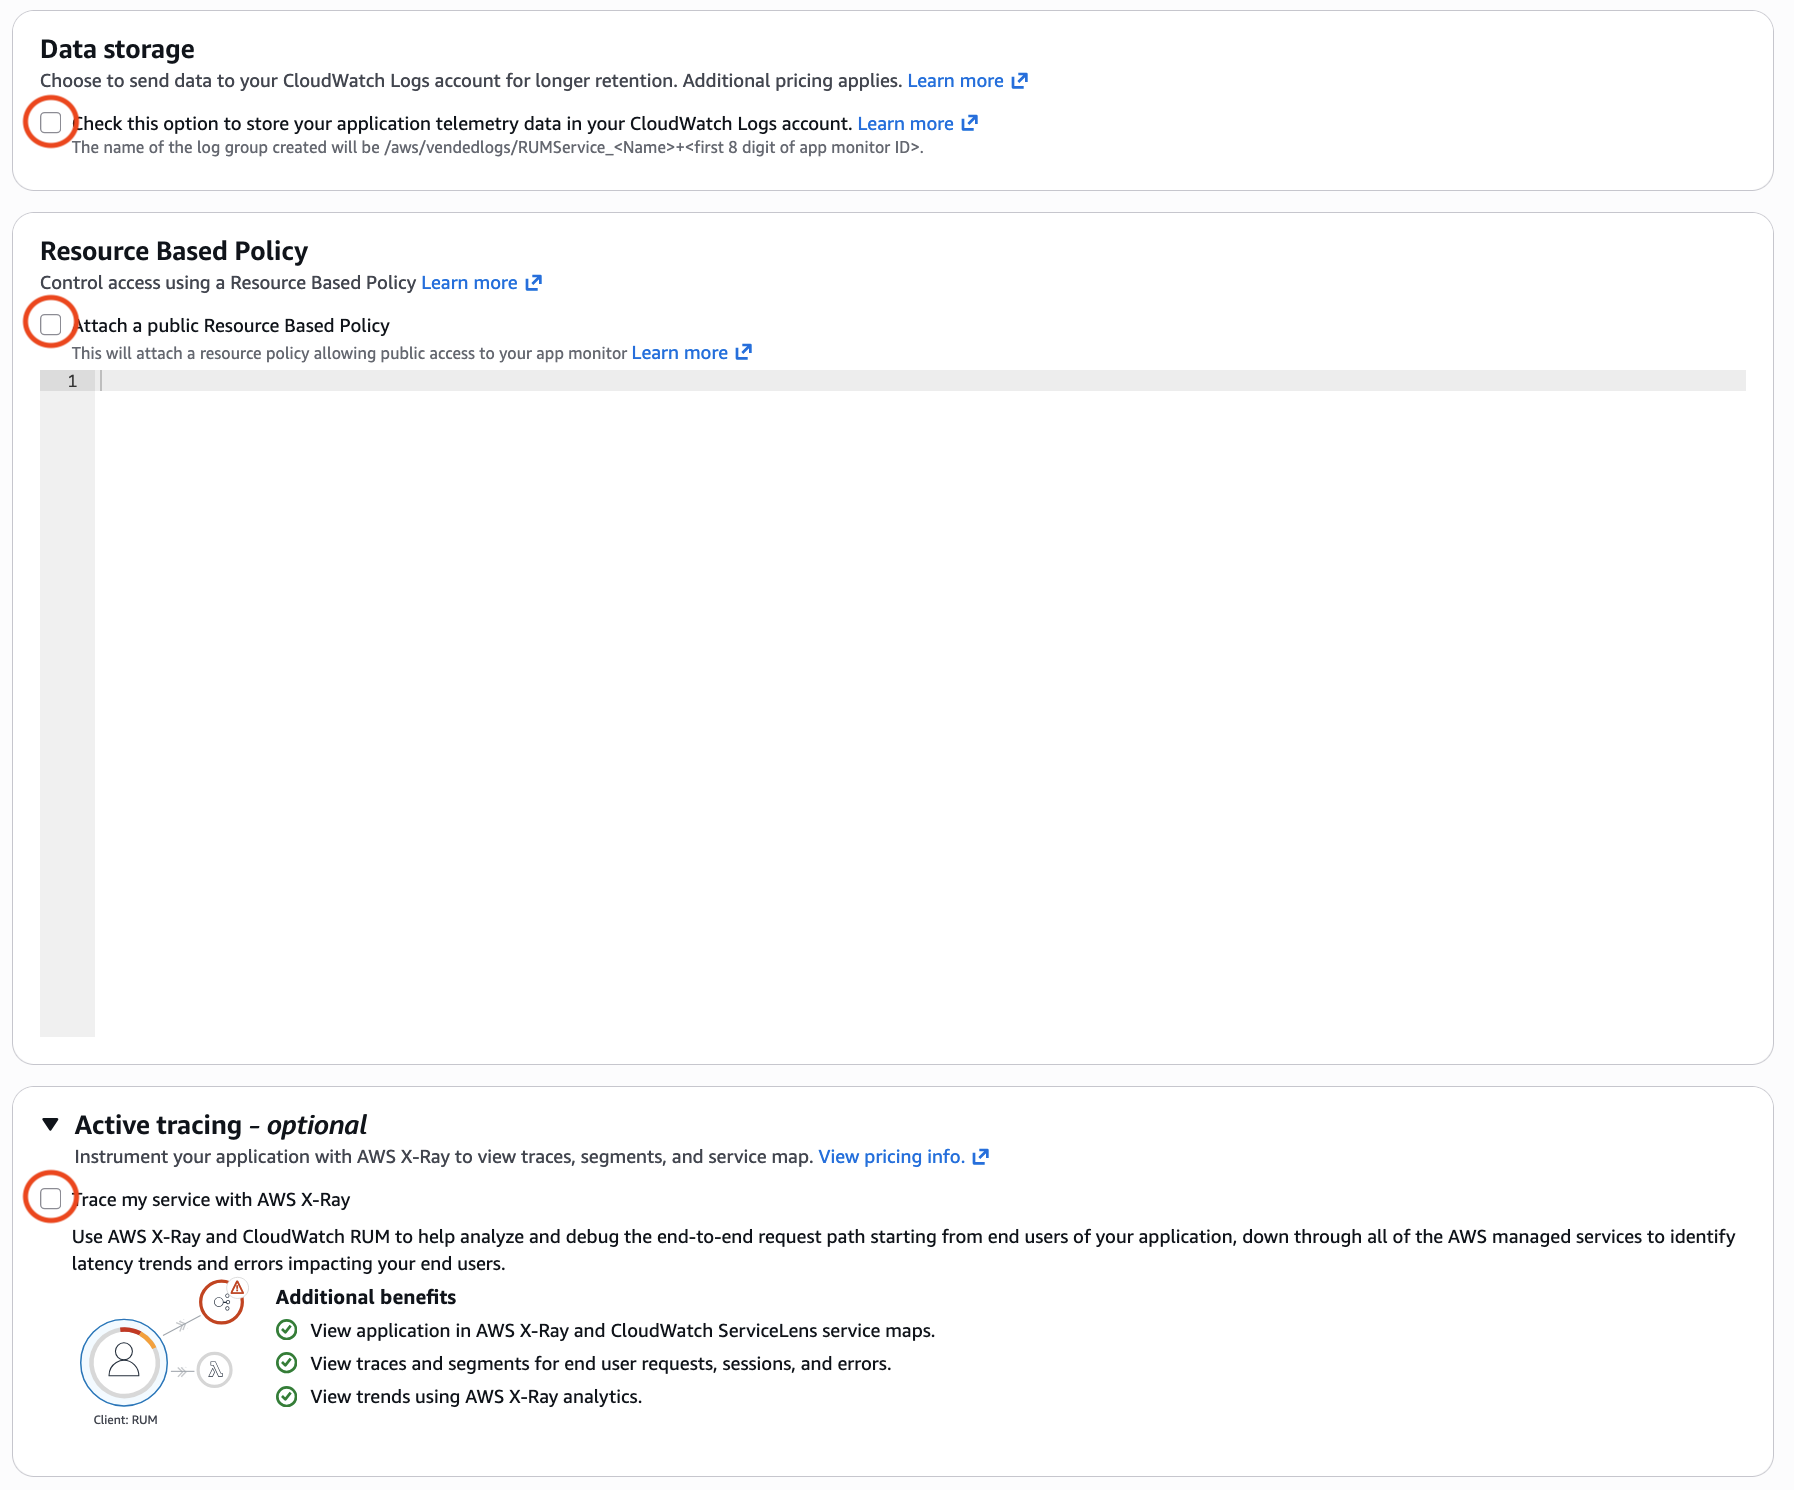
Figure 3: Create app monitor – Optional fields
Finish by clicking on Add app monitor.
The console then provides you with a Code snippet, which needs to be added to your android application in order to start collecting data. The code is provided for “manual instrumentation” as well as “zero-code instrumentation”.
Let’s save the snippets, which you will use in the “Instrumenting your Android app” section, later in this blog.
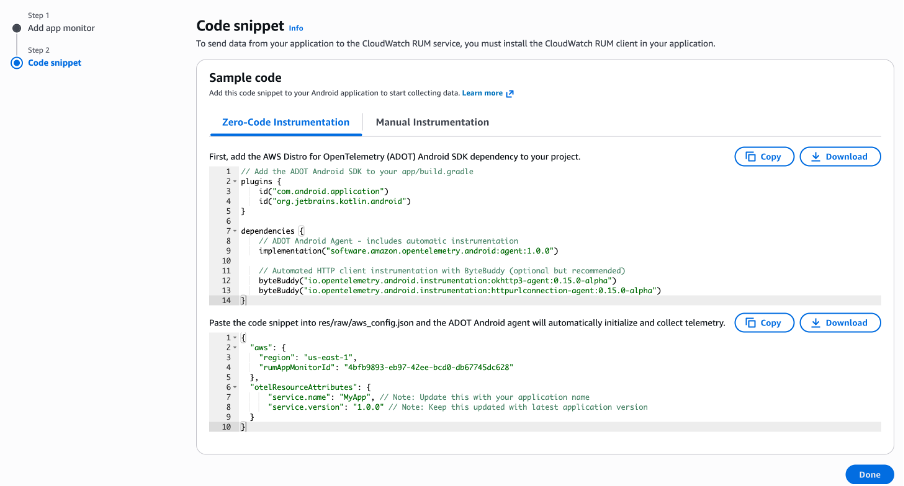
Figure 4: Create app monitor – Code snippet for Manual and Zero-code instrumentation
Instrumenting your Android app: Choose the implementation path
Now that the app monitor is created, let’s instrument your mobile app to start sending telemetry data to the app monitor. Like you noticed above, there are 2 options available to instrument or configure the mobile app: zero-code instrumentation and Manual instrumentation.
First, keep the code snippets from “Setting Up app monitor” section handy—you’ll need them to complete this section. The code is also available at https://github.com/aws-observability/aws-otel-android. Now let’s review each of these options.
Option 1: Zero-code instrumentation (Agent)
For this, first you need to add some dependencies into our application’s "app/build.gradle" file. Here is an Kotlin DSL example:
Next, for the zero-code configuration you need to create a file called "aws_config.json" under the "res/raw" directory of our application, with the below code snippet (Make sure to replace the values for each parameter).
That’s it! This is the minimum you need to initialize the Android agent and start collecting telemetry into the CloudWatch RUM app monitor.
Option 2: Manual instrumentation
To configure; the client programmatically; you will be using the lightweight “core” module, instead of the “agent” module used in Option 1. For this let’s add the below SDK into your application’s "app/build.gradle" file.
Next, you need to initialize the AWS Distro for OpenTelemetry(ADOT) Android agent in your application.
Lastly, if you don’t already have an Application class, you will need to register this new “MyApplication” in the android manifest.
After this, you should be able to run your application and start receiving telemetry into the app monitor.
Setting up app monitor for iOS
The process for creating an app monitor for an iOS application is the same as demonstrated above for an Android application. Once the app monitor for iOS is created let’s see how to instrument the application to start sending telemetry data. The code for iOS is also available at https://github.com/aws-observability/aws-otel-swift.
Option 1: Zero-code instrumentation (Agent)
As in the “app monitor” for Android, you can get the “code snippet” for instrumenting an iOS app in the final page of the “app monitor” creation. Based on those instructions, you add the Swift SDK dependency into your application’s "Package.swift" file.
The SDK will automatically initialize when the “AwsOpenTelemetryAgent” module is imported into the app. It will look for a file named "aws_config.json" in the root directory of the app bundle (Make sure to replace the values for each parameter).
Option 2: Manual instrumentation
To configure the client programmatically, add the below dependencies into the project’s "Package.swift" file
Next, initialize the ADOT Swift agent in the application.
Visualizing your app’s performance: Where data becomes insight
Once CloudWatch RUM for Mobile begins collecting data, CloudWatch RUM transforms into your mobile performance command center, providing multiple specialized views that turn raw performance data into actionable insights
From the list of RUM app monitors displayed, select the app monitor you created in the above section. This will give you the dashboard with various tabs like Performance, Errors, Sessions, Metrics and Configuration; with filtering capabilities by screens, app version, OS version, device, country, Region, and locality.
Performance tab: Deep dive into speed and responsiveness
The Performance tab in the CloudWatch RUM console provides insights into the performance of your mobile app. This detailed view breaks down screen load times by Screen names, OS versions, App versions, Devices, and Countries. Patterns that were previously invisible become clear—your app performs differently in certain countries due to network infrastructure variations, or specific device models struggle with particular features. Clicking a screen load time datapoint in the chart will open the diagnostic panel on the right that provides further insights relevant to the datapoint e.g., most recent correlated sessions, as well as links to the Sessions tab to troubleshoot one or other similar sessions.
The App Launch time view provides detailed analysis of application startup performance, breaking down launch times by App launch type (Cold/Warm), OS versions, App versions, Devices, and Countries. This granular view helps identify performance bottlenecks—such as specific OS versions experiencing slower cold starts or certain device models struggling with initialization, enabling targeted optimization efforts for the most impactful user segments.
The Locations tab offers geographic insights into application performance, displaying metrics across Countries, Regions, and Localities to reveal location-based performance patterns. This view helps identify regional infrastructure challenges, network latency issues, or geographic areas where users experience degraded performance.
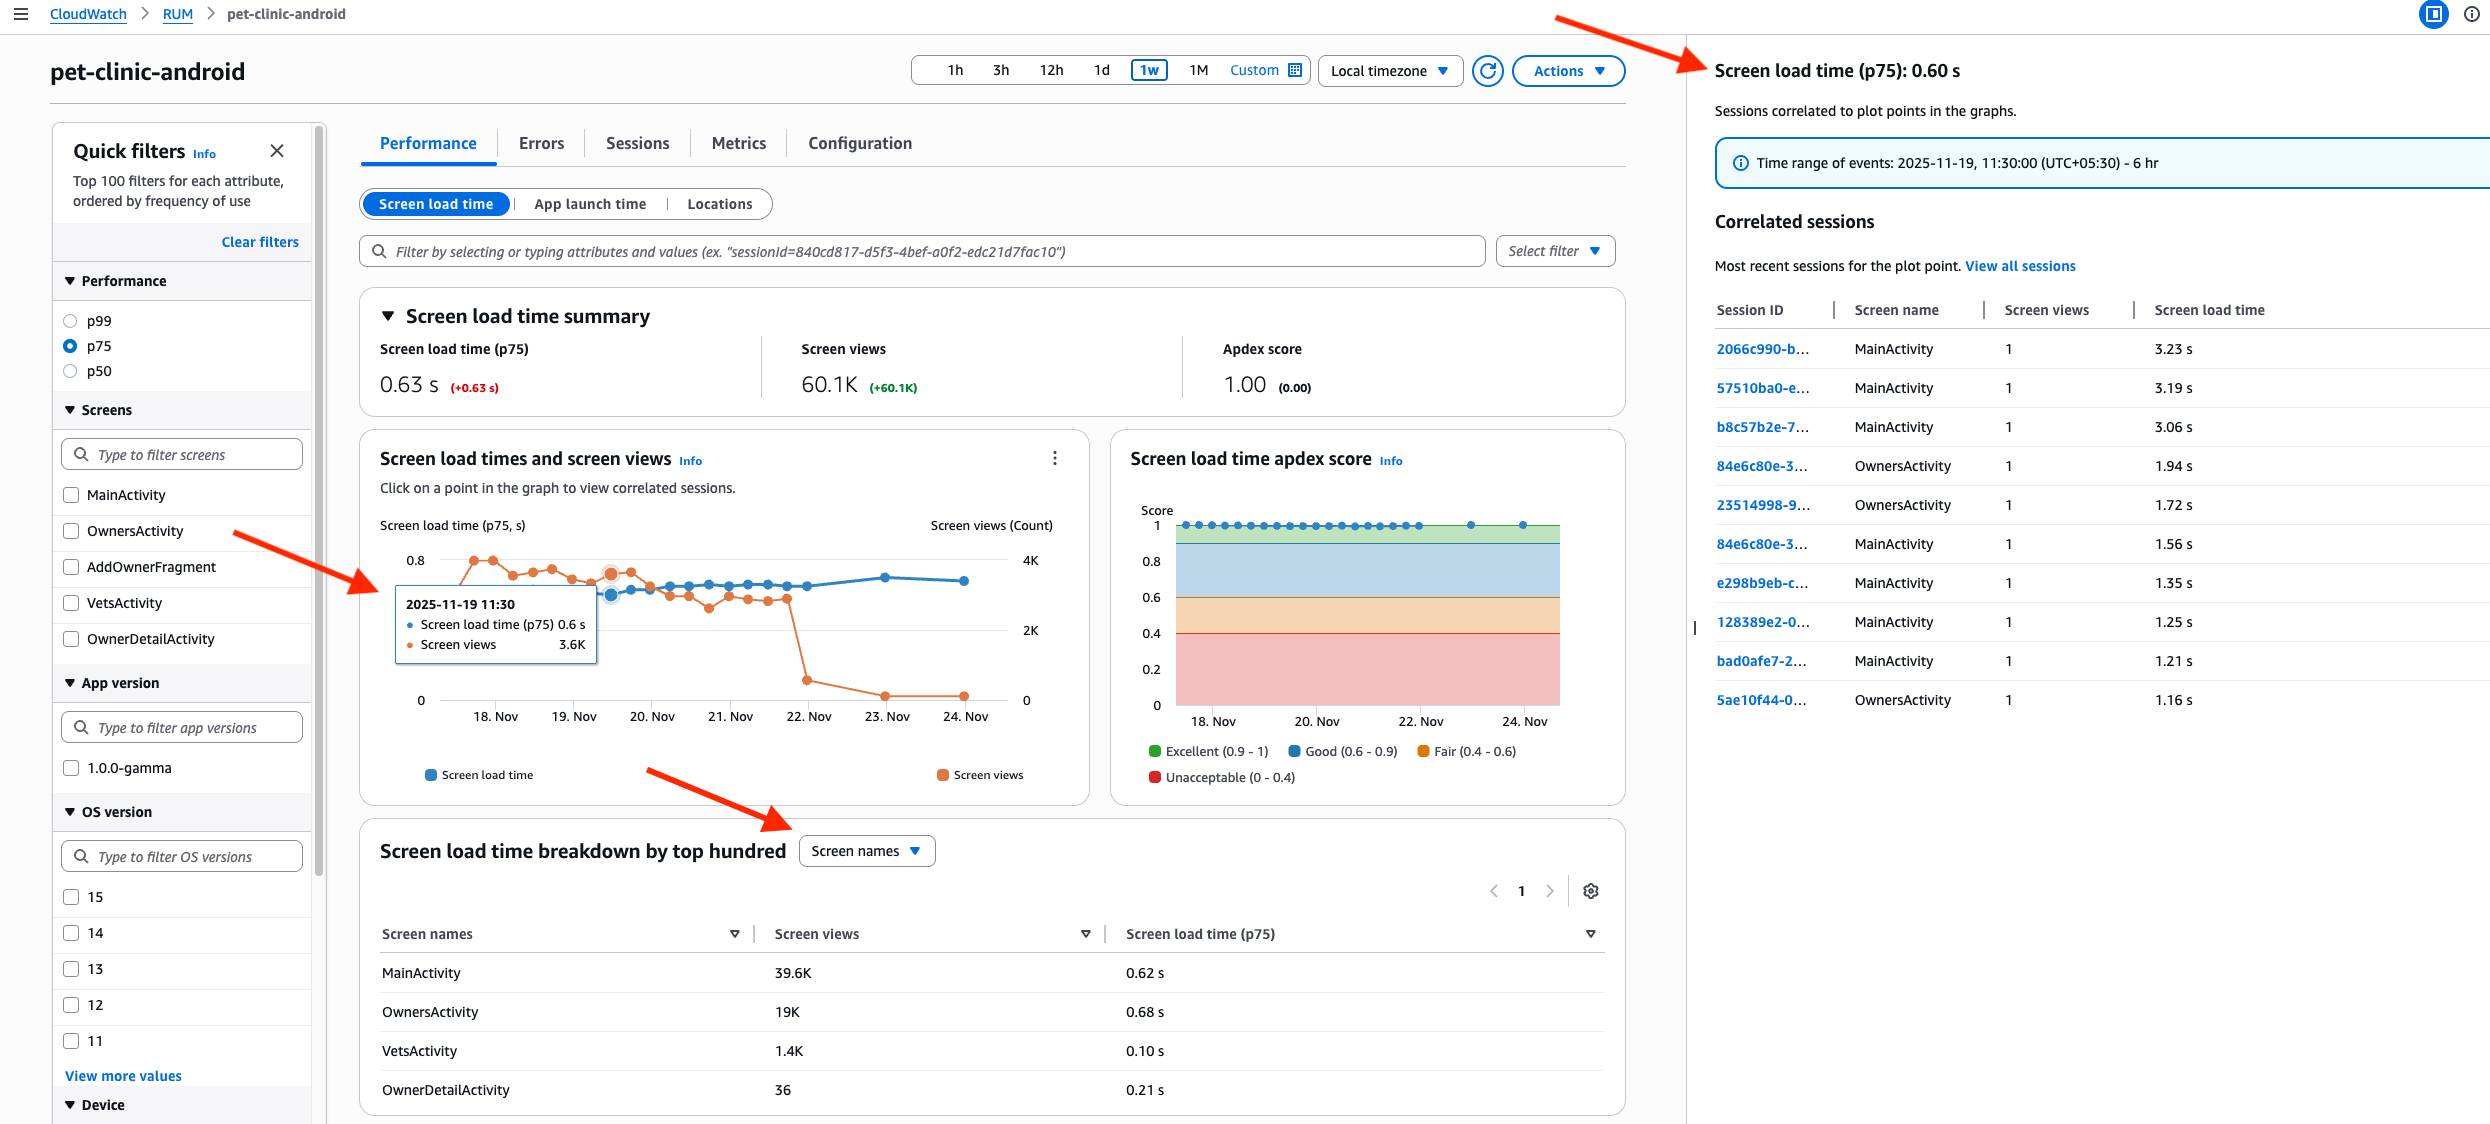
Figure 5: AWS CloudWatch RUM – Performance tab
Errors tab: your debugging companion
The Errors tab transforms error tracking into systematic problem-solving. It breaks down application issues in three categories: Network Errors, Crashes, and ANRs/App hangs. The Network Errors tab has a line chart for HTTP requests displays HTTP performance metrics, showing failure rates (HTTP errors, HTTP faults, and network failures) on the left Y-axis and HTTP latency on the right Y-axis. This time-series data points that allow users to click and view correlated spans and sessions for troubleshooting in a diagnostic panel. The bottom table lists the 100 most common network routes.
Similarly, the Crashes and ANRs/App hangs tab shows a line series for the count of each error. The bottom table displays the most common top crash message/ANR stack trace. Clicking on the error message will pop-up the entire stack trace for quick reference.
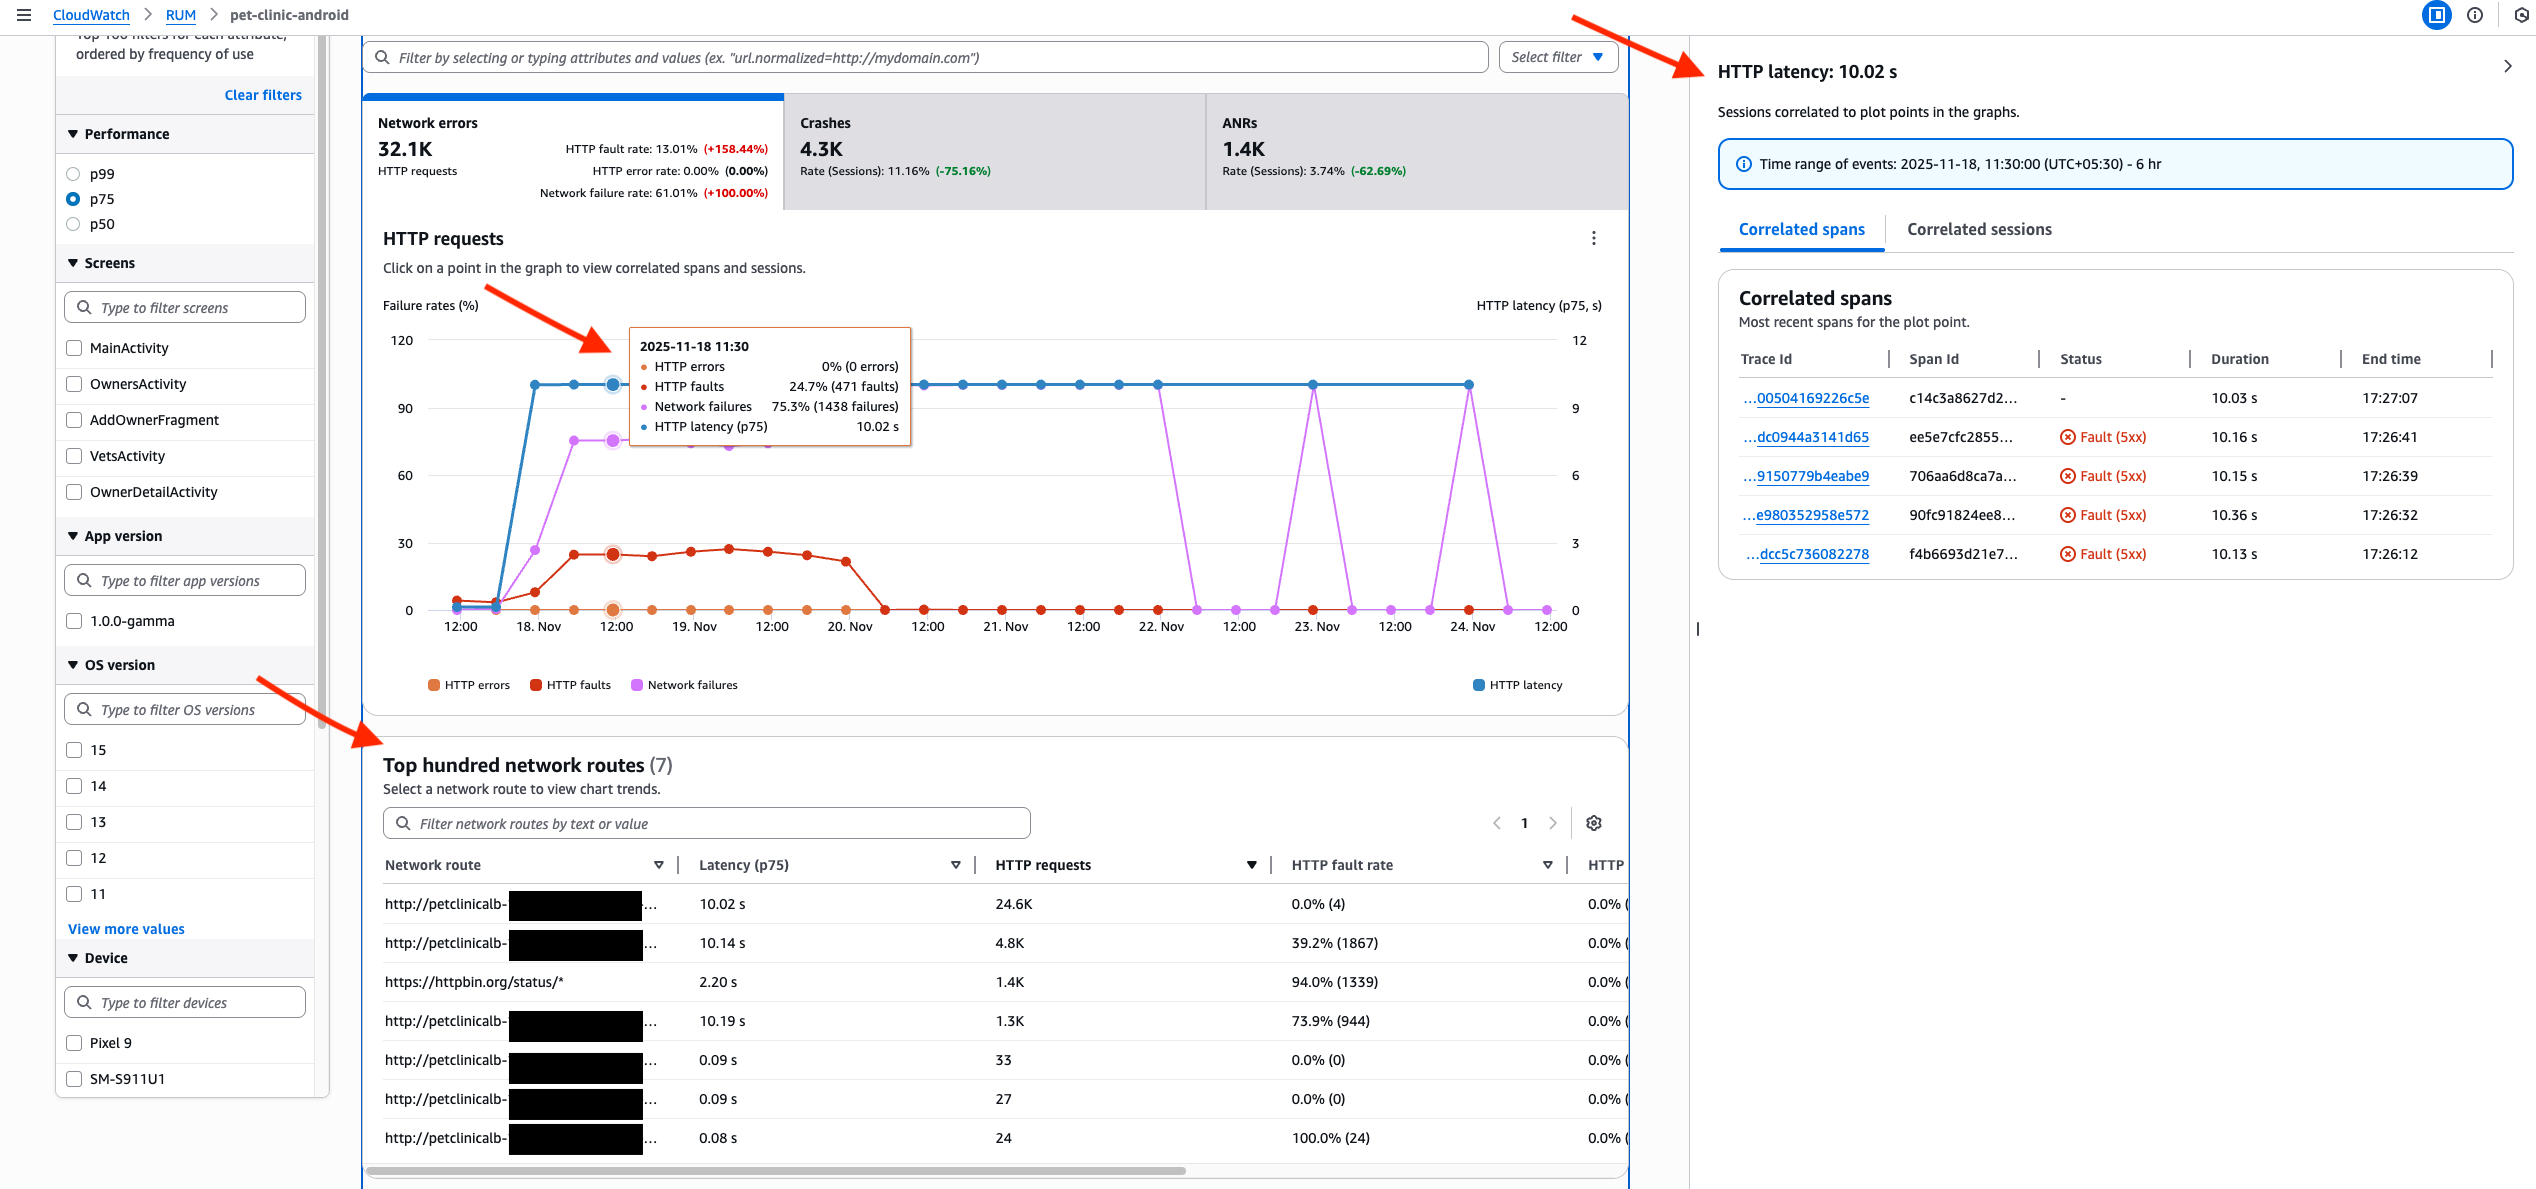
Figure 6: AWS CloudWatch RUM – Errors tab
Sessions tab: Following the user journey
Next, the Sessions tab allows you to follow individual user journeys through your app using detailed waterfall visualizations. These visualizations show exactly where time is spent during user interactions and where users experience friction or delays. This user-centric view helps you optimize not just technical performance, but the overall user experience.
It has a table that lists all sessions, sorted in a descending chronological order. At the bottom is a waterfall that visualizes all telemetry for the selected session. Each row in the waterfall can be selected to open the diagnostic panel. If the row is for an HTTP request, there will be a traceId deep-linked to traces console. If it is an HTTP request that received an exception, crash or ANR/App hang, the diagnostic panel also has an Exception tab that displays the stack trace. The “View” button in the waterfall is also a quick way to navigate directly to the exception in one-click.
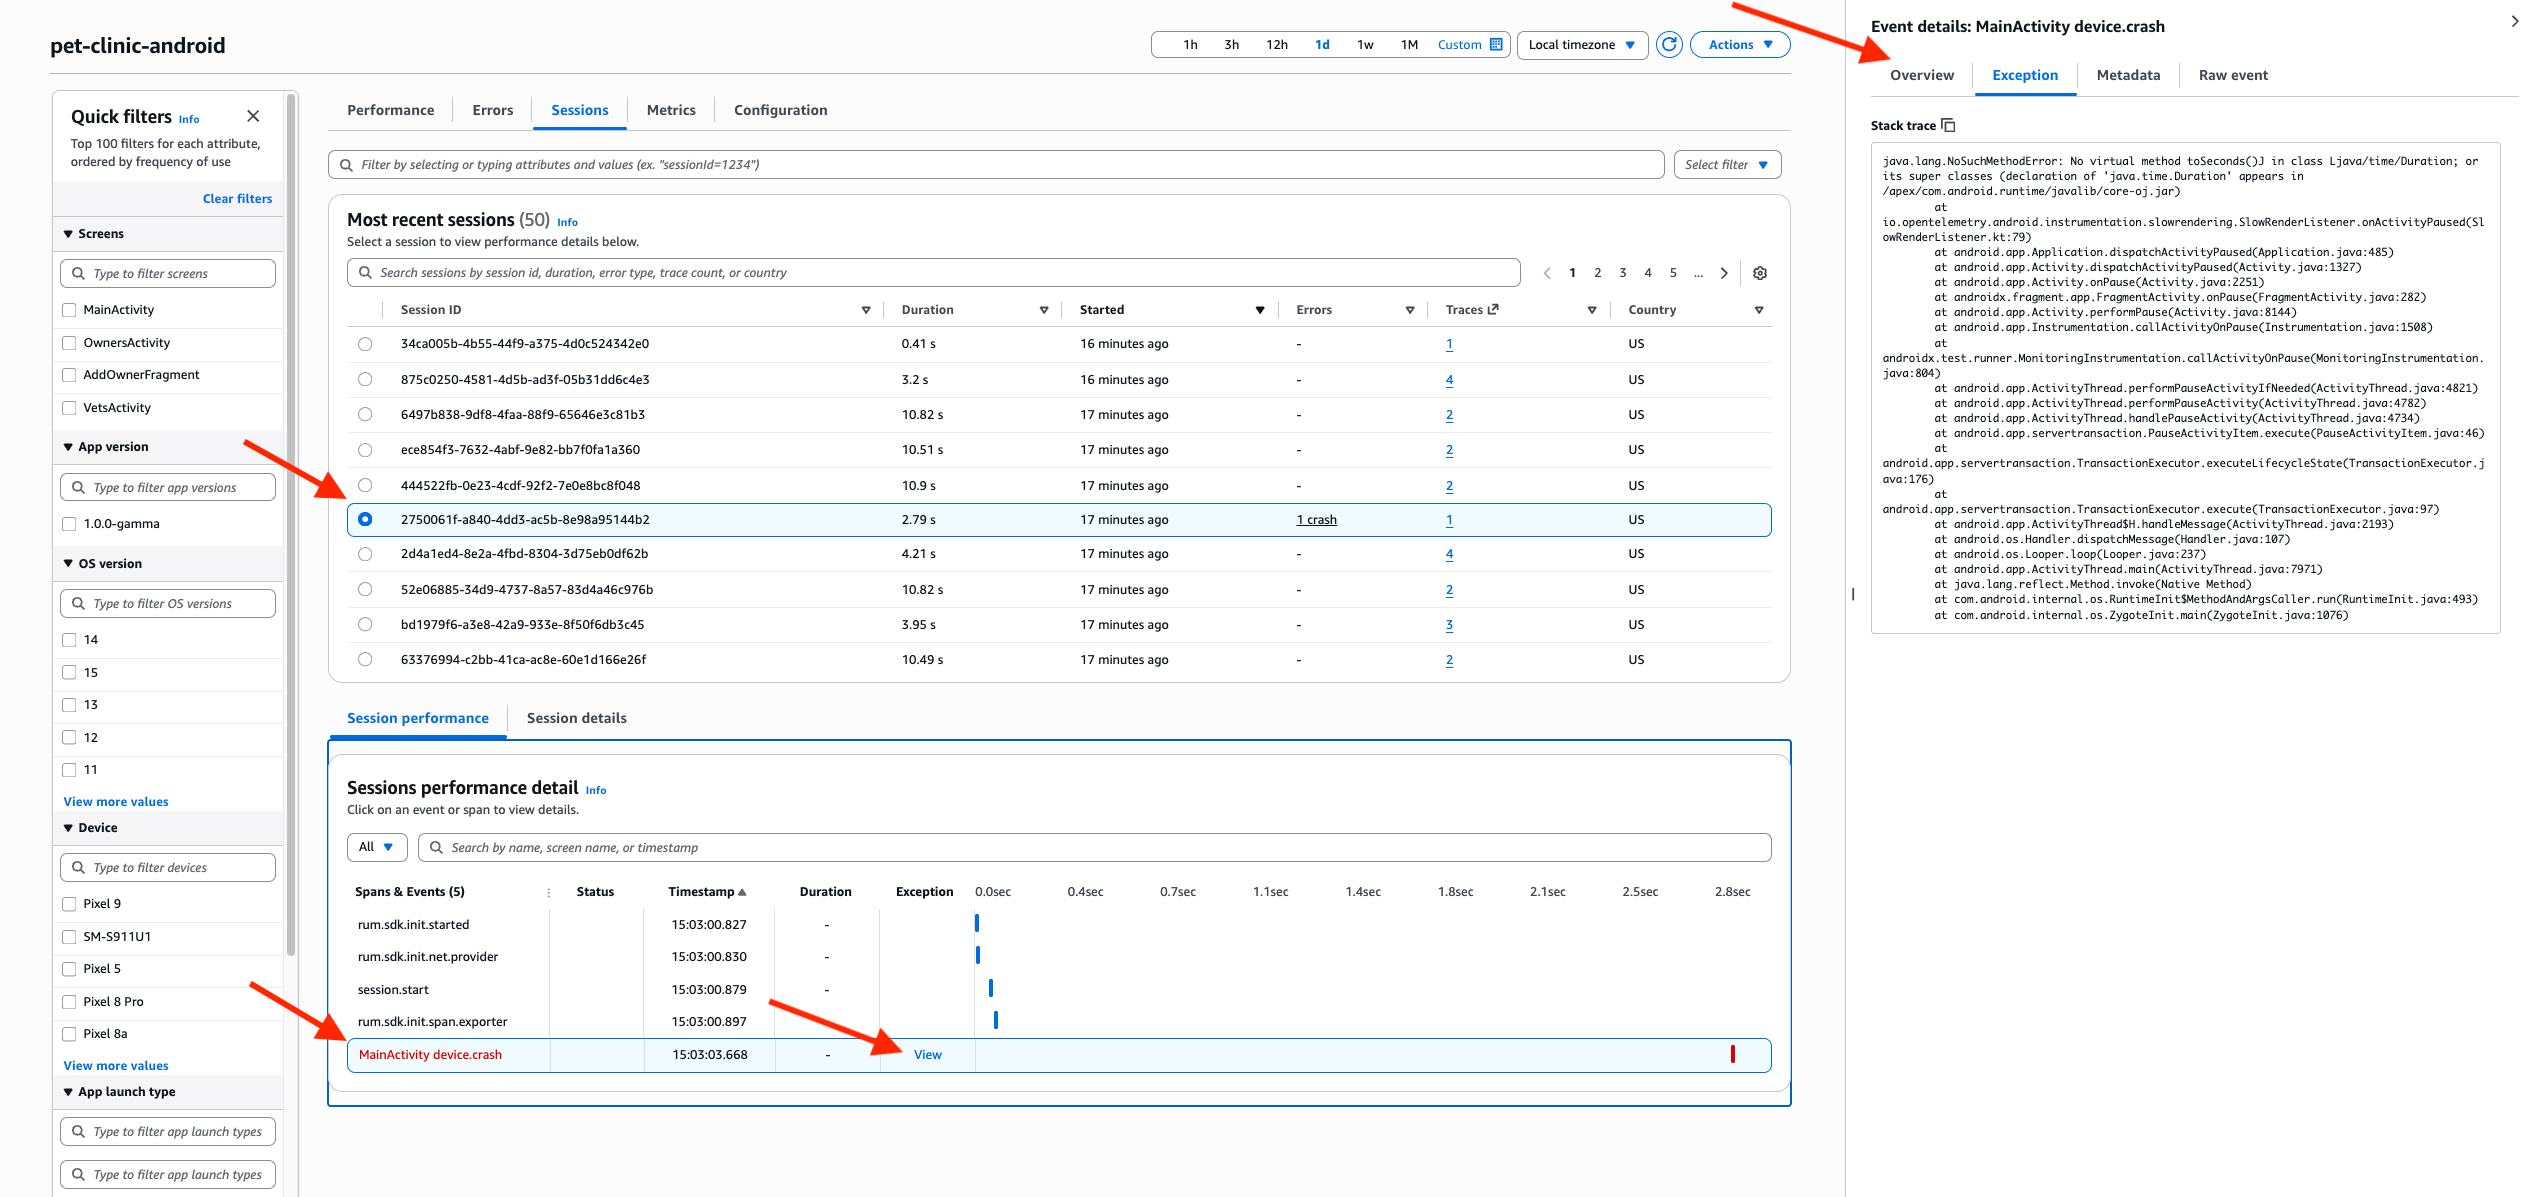
Figure 7: AWS CloudWatch RUM – Sessions tab – ARN
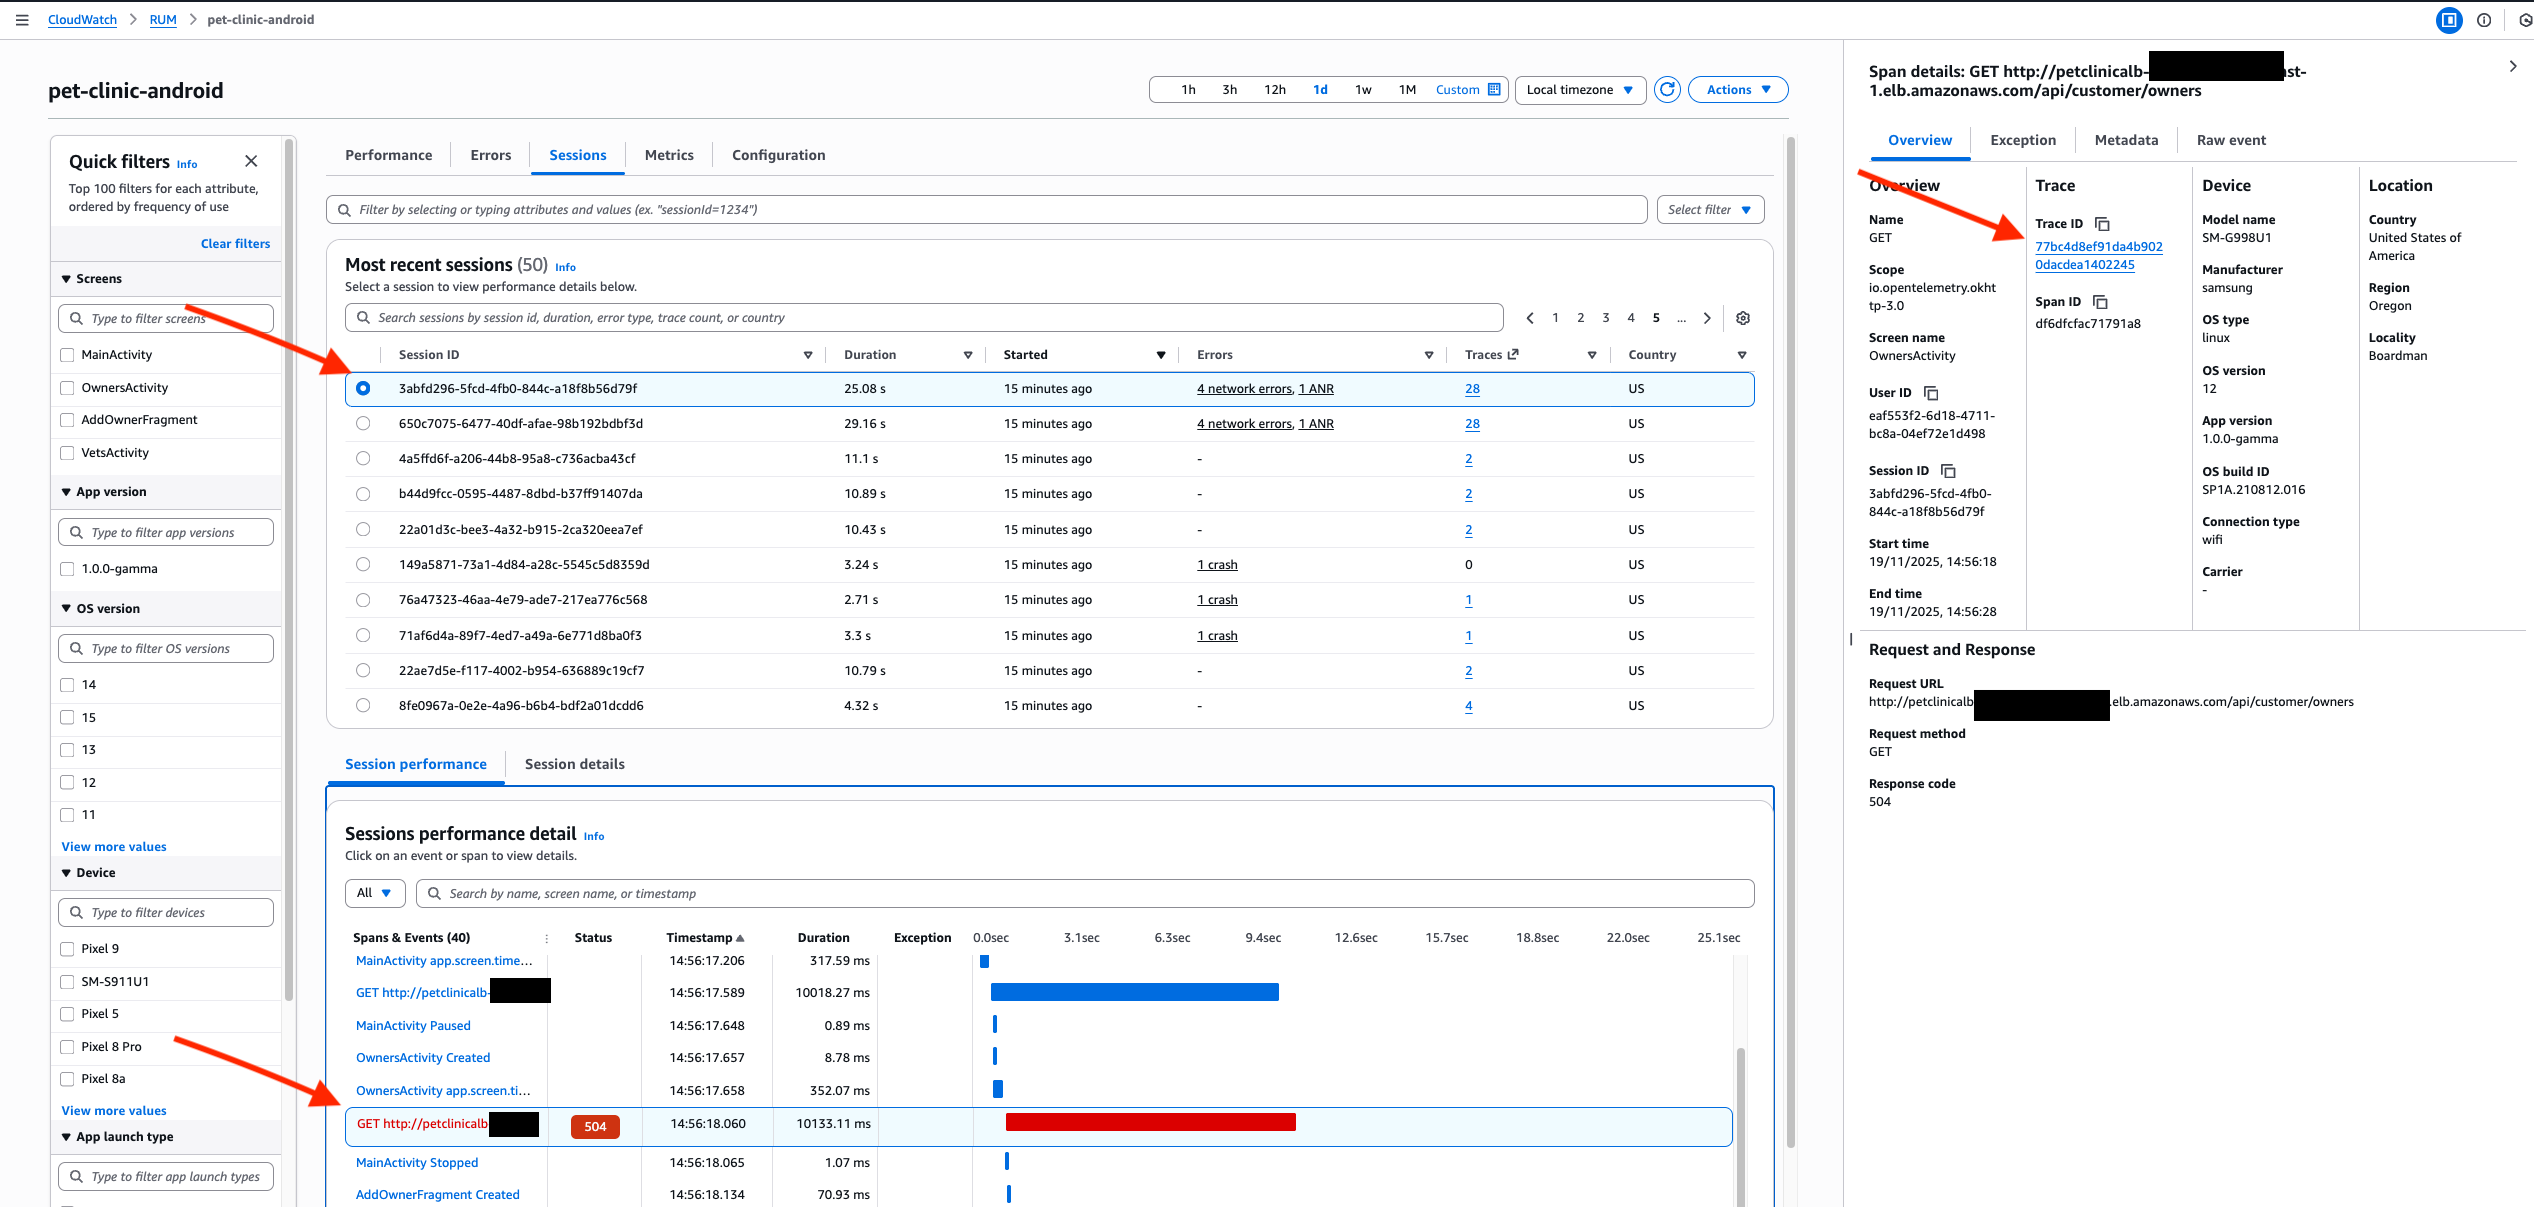
Figure 8: AWS CloudWatch RUM – Sessions tab – HTTP traceId
Metrics tab: Monitoring application health
The Metrics tab provides a comprehensive dashboard that helps to visualize real-time data about the application’s performance about Latency, Errors, Volume and Extended metrics.
This tab also has an option at the top right called “Add to dashboard”, which enables you to export this data into any other CloudWatch dashboard.
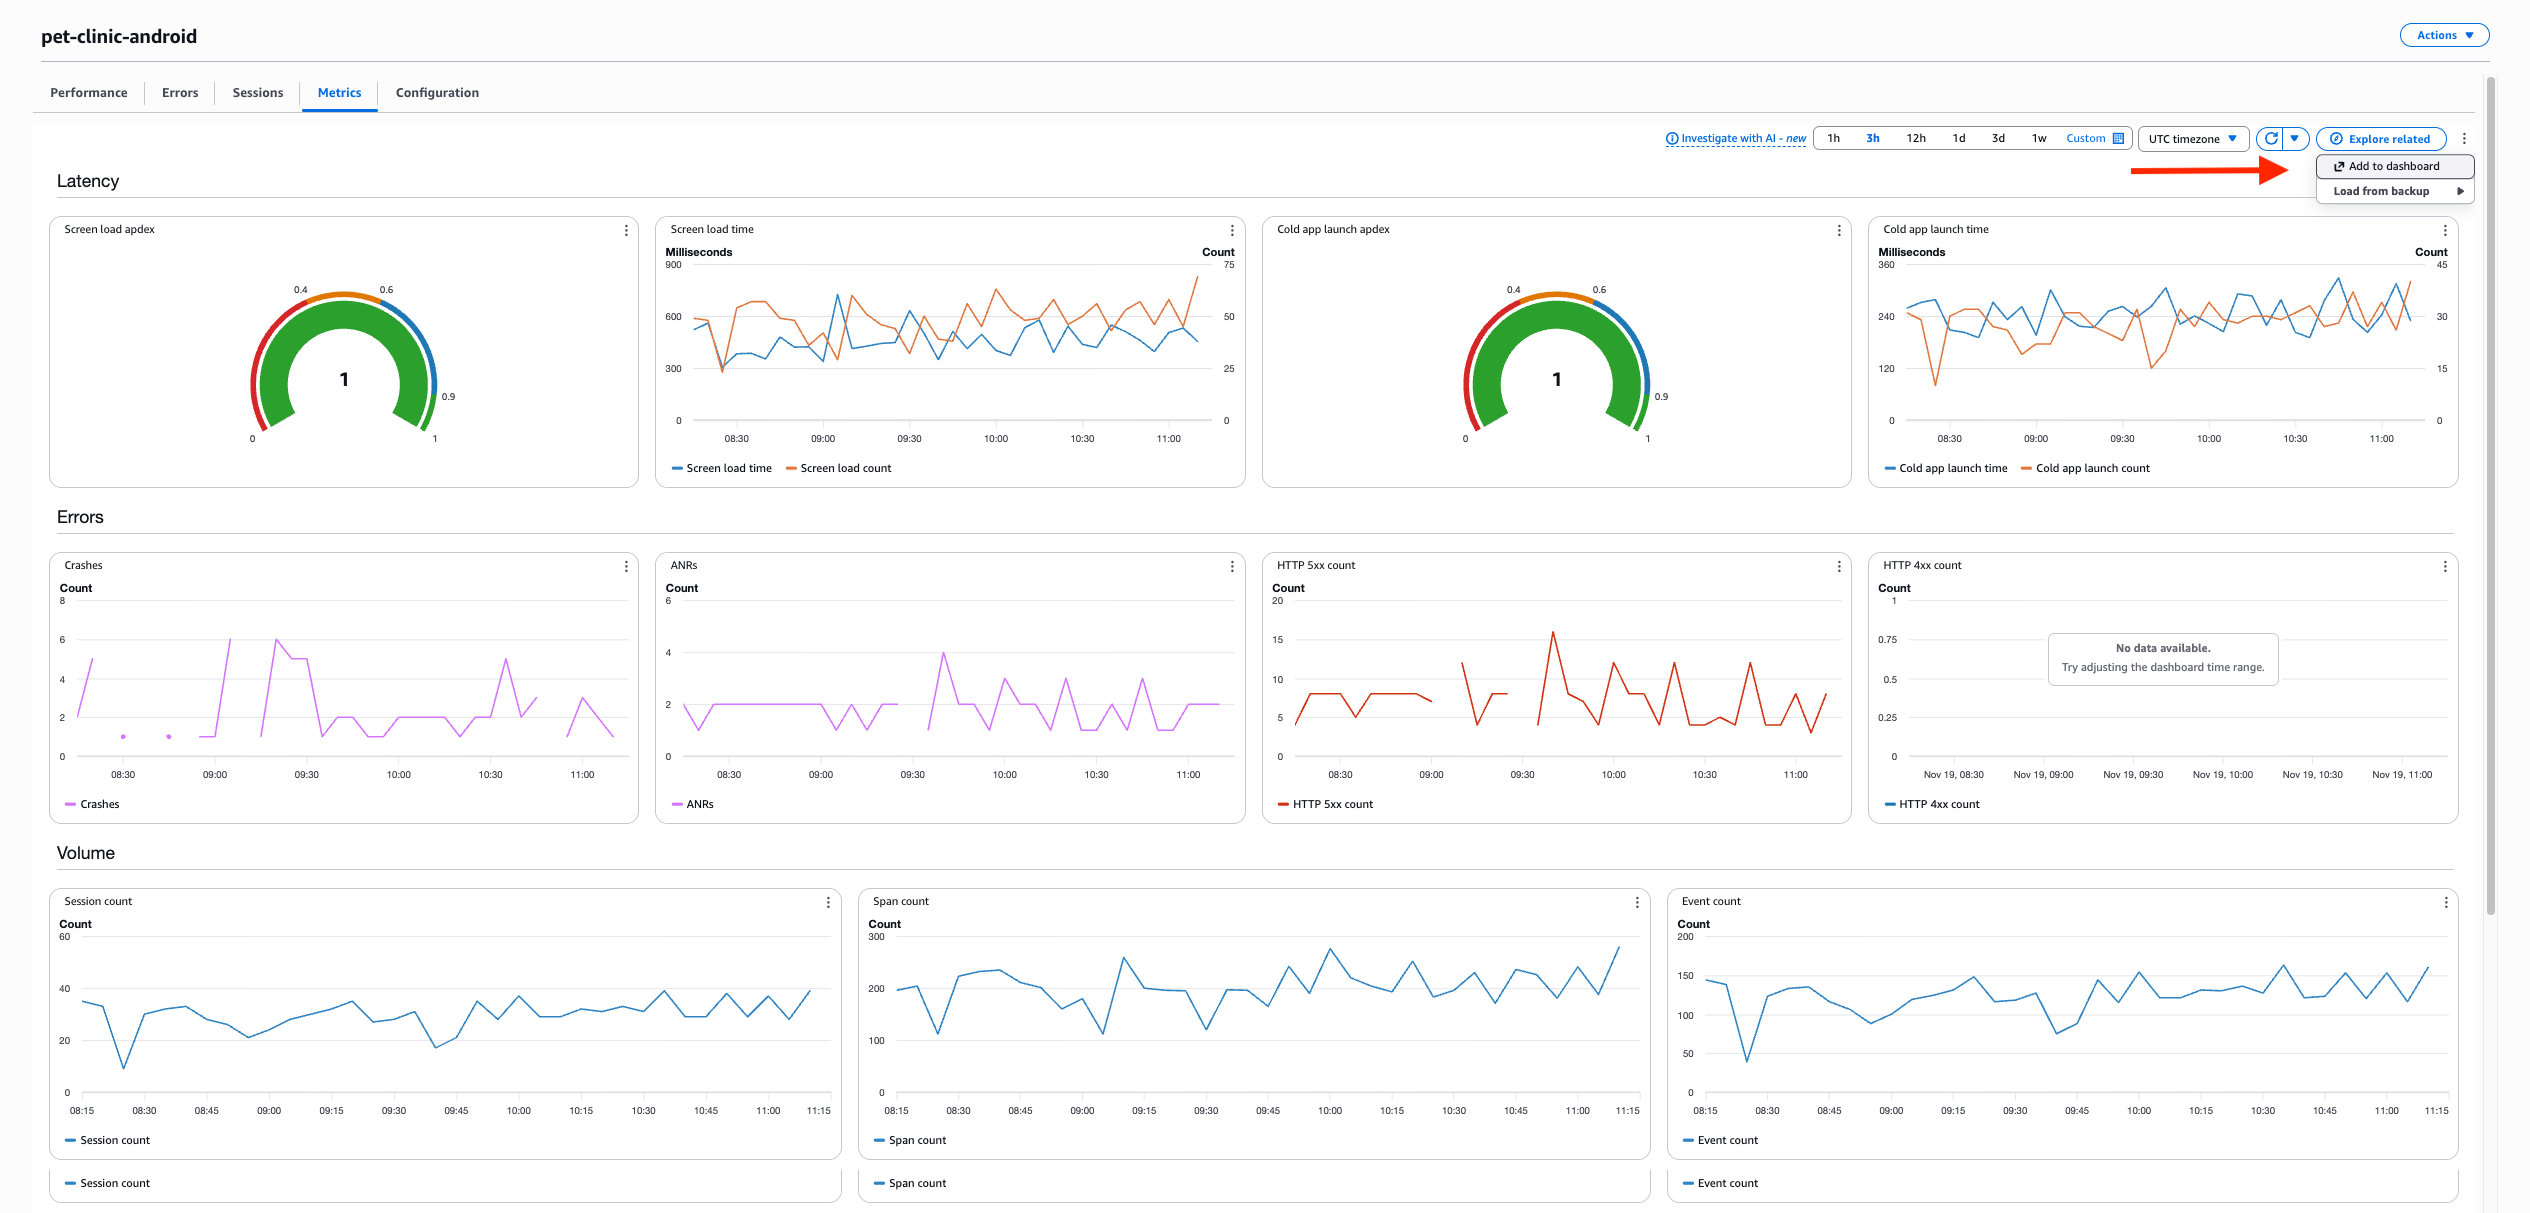
Figure 9: AWS CloudWatch RUM – Metrics tab
Configuration tab: Ongoing management
Finally, the Configuration tab provides easy access to your app monitor settings and instrumentation code snippets, ensuring that ongoing management and updates remain straightforward as your monitoring needs evolve.
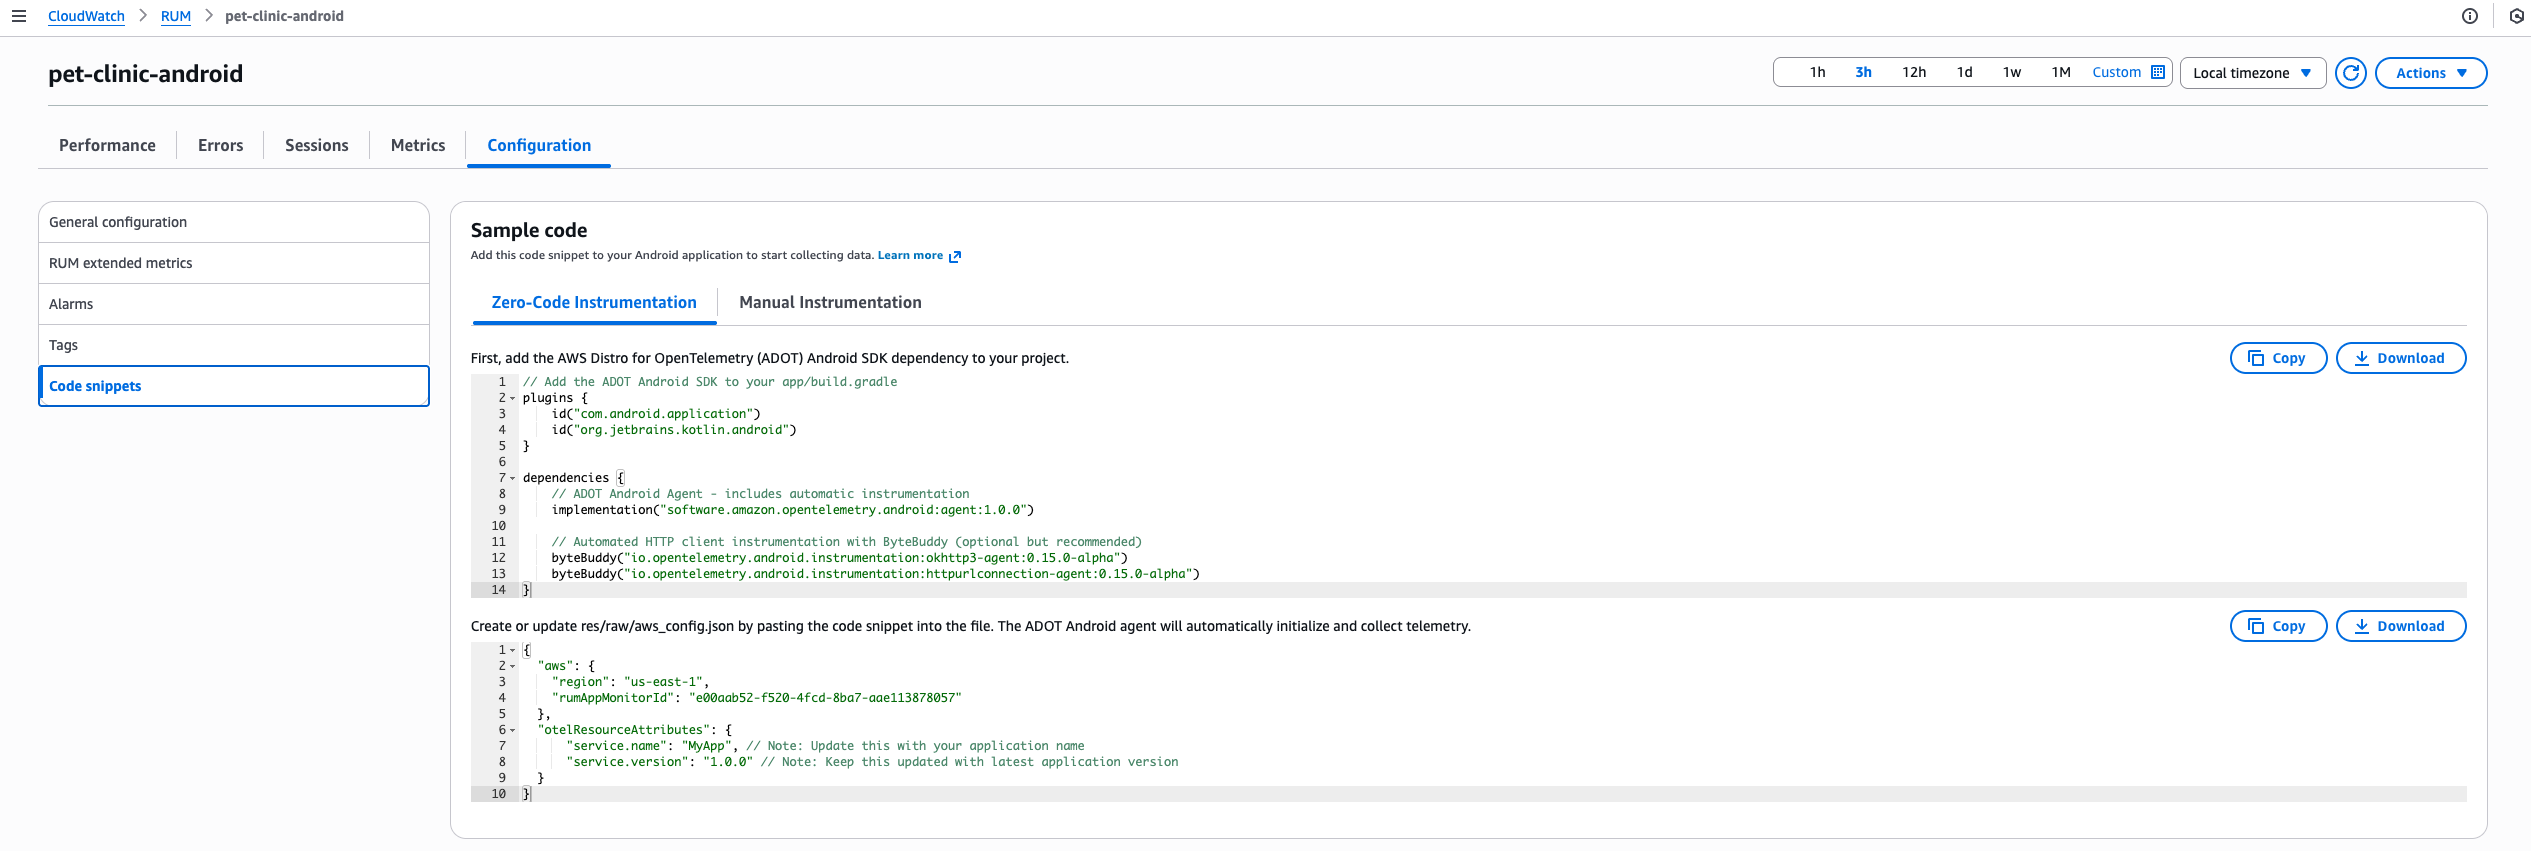
Figure 10: AWS CloudWatch RUM – Configuration tab
Conclusion
Amazon CloudWatch RUM for Mobile transforms mobile application observability from reactive troubleshooting to proactive optimization, delivering business impact through performance monitoring. Teams can identify and resolve critical issues; such as localization bugs causing regional crashes or third-party SDKs degrading cold start performance. The seamless integration with CloudWatch Application Signals enables end-to-end tracing from mobile user experience through backend dependencies.
This feature is available across all Commercial regions where CloudWatch RUM operates. The implementation allows teams to collect performance data while maintaining existing development workflows, changing how organizations approach mobile app development with metrics from user sessions traced through the application stack.
To learn more about this new feature visit the documentation. Also have a look at getting started for Android and iOS. Finally pricing details can be found at pricing.