AWS Cloud Operations Blog
Using Amazon CloudWatch Synthetics to find broken links on your website
Most businesses and professionals build and maintain websites to bring visibility and credibility to their work. These websites often act as a medium for messaging. They shape the online perception of the business. When links on a website are broken, users get frustrated. If they cannot access the information they need, they might take their business elsewhere. Having a healthy functioning website is essential, especially when your website serves as a platform for information and business.
Links on your website might be broken for the following reasons:
- A website is no longer available.
- A webpage was moved without the creation of a redirect.
- The URL structure of a website was changed.
- The content that’s linked to, like images, videos, and PDFs, has been deleted or moved.
These broken links often return 4xx or 5xx status codes.
Since its launch in 2019, Amazon CloudWatch Synthetics has provided a mechanism for developers to detect if their endpoints and REST API operations show any sustained or intermittent availability drops, latencies, broken links, or unauthorized content changes. With CloudWatch Synthetics canaries, developers get real-time notifications about problems and logs that point to the reason for failure. This significantly reduces the time to debug issues and customer downtime.
With the release of a new runtime version, syn-nodejs-2.0, CloudWatch Synthetics has upgraded the broken link checker blueprint to address the problem of broken links. You can use CloudWatch Synthetics to crawl your website, detect broken links, and find the reason for failure. CloudWatch Synthetics creates a detailed JSON report in an Amazon Simple Storage Service (Amazon S3) bucket, which makes fixing the broken links a quick and hassle-free process.
In this blog post, I show how CloudWatch Synthetics makes the detection of broken links simple and reliable.
Overview
Instead of manually clicking through the links on your site, you can use the to enter the number of links to be checked and the starting URL. The script that monitors your endpoints, known as a canary, then crawls the website for broken links. If the canary fails, the logs provide information about the broken links. The Synthetics console includes screenshots of every source and destination URL that was checked.
By default, screenshots are taken at the start and end of every link checked. Screenshots are annotated and can be configured with the following options:
- Capture source page screenshot
- Capture destination page screenshot on success
- Capture destination page screenshot on failure
For every canary run, the script starts at the source URL and collects all the links on the source page. It tries to reach all of them until the link limit is reached. If the limit is not reached, the script continues to do the same for all the child links on the starting. The script continues to reach all the child links either until there are no more child links or the link limit has reached. After the script runs, CloudWatch Synthetics generates a broken link checker report named BrokenLinkCheckerReport.json and stores it in an Amazon S3 bucket specified during canary creation, with the following information about every link checked:
- Source URL
- Destination URL
- Anchor text on the source URL
- Status code returned by the destination URL
- Description of the error, if any
- Screenshots taken based on screenshot configuration setting
This report provides a detailed view of the health of the links in your website so that you can immediately take action to fix them. The canary displays a failed status for any broken links in your endpoint. The Amazon CloudWatch console groups the screenshots by the link checked. The source URL screenshots are annotated to highlight the anchor text. You can also view just the broken links by toggling show broken links. HTTP Archive (HAR) and log files are also generated to capture details about every link visited and response received.
Example
Let’s look at an example that uses the broken link checker to monitor a website. In Figure 1, the initial source URL, https://www.myWebsite.com, is used to create the Synthetics canary. Maximum number of links which would be followed is set to 10. The Take screenshots check box is selected. The script grabs links to https://www.myWebsite.com/about, https://www.myWebsite.com/contact, and https://www.myWebsite.com/info from the source page.
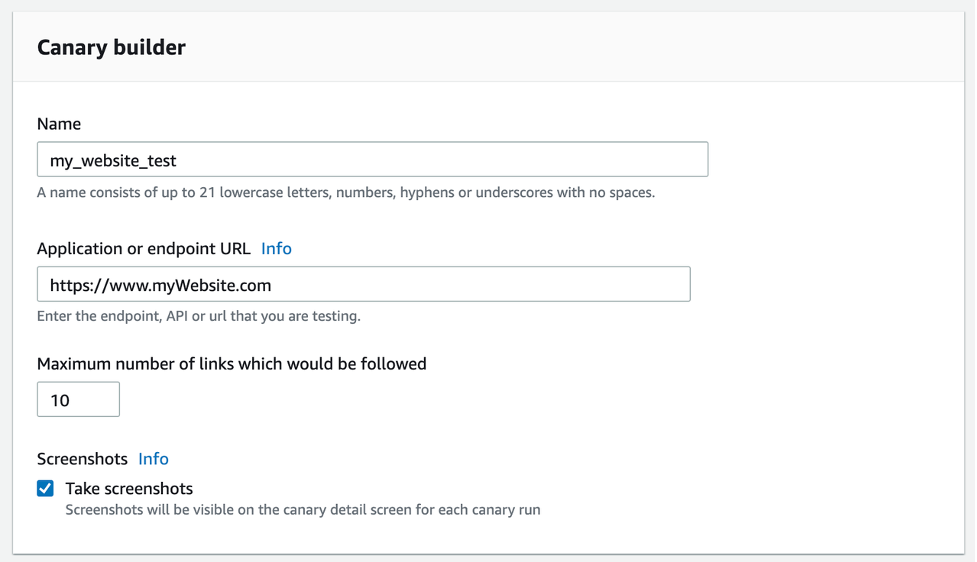
Figure 1: Canary builder page in the Amazon CloudWatch console
The canary tries to load these links and captures the response for these pages. The total number of links checked at this point is four (the source link and the three child links), so the canary grabs URLs from the successfully loaded child pages until the link limit is reached. In Figure 2, you find that there are four links displayed under Links checked. The third link in the list failed with a status code of 404.
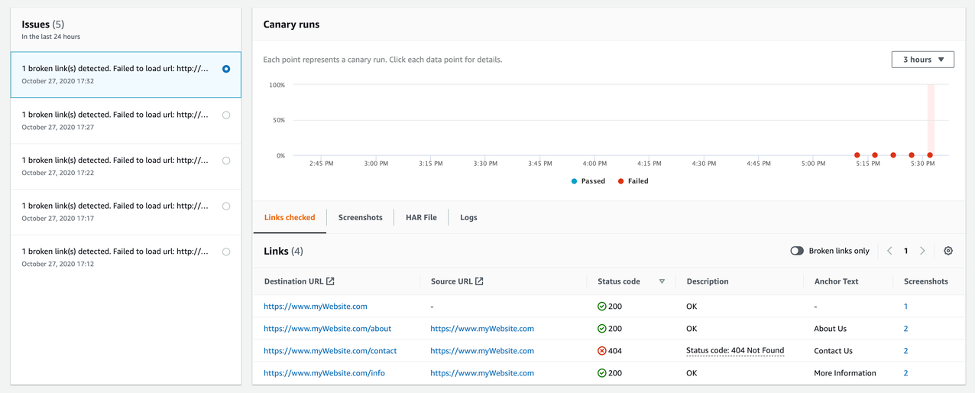
Figure 2: Canary runs page of the Amazon CloudWatch console
If you look at the annotated screenshots for the third link, you can see where the anchor text is on the page.
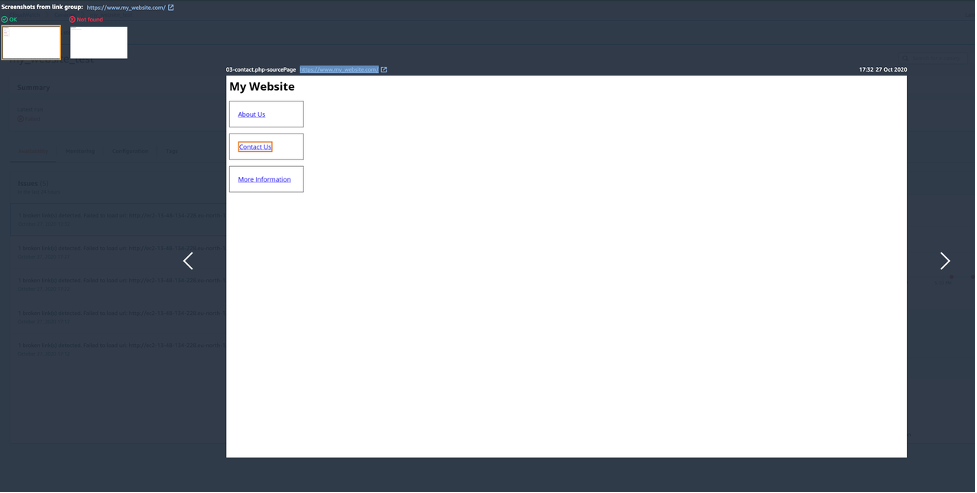
Figure 3: Contact Us link
You can also see the response returned after the link checker tried to navigate to the page.
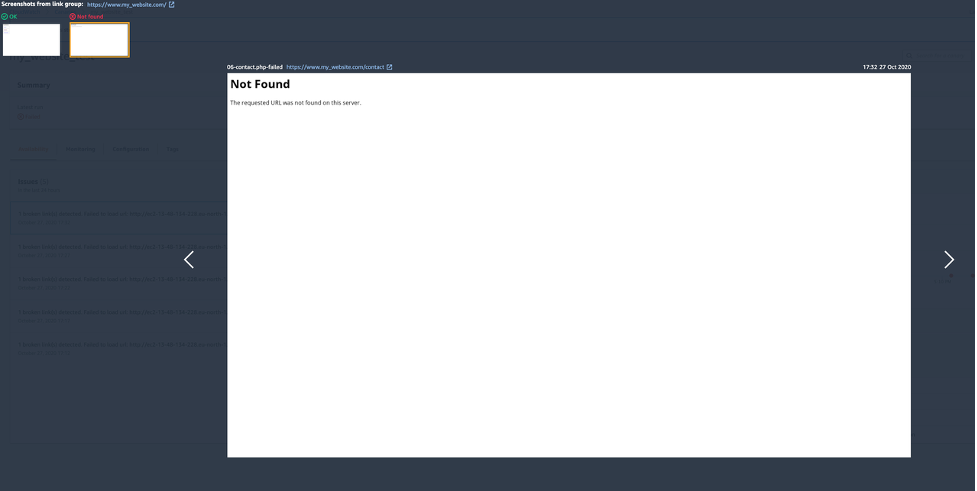
Figure 4: Contact Us link not found on the server
The following BrokenLinkCheckerReport.json is created and stored in an S3 bucket along with screenshot
	{
	  "links": {
	    "https://www.myWebsite.com": {
	      "linkNum": 1,
	      "url": "https://www.myWebsite.com",
	      "text": "",
	      "parentUrl": "",
	      "status": {
	        "statusCode": 200,
	        "statusText": "OK"
	      },
	      "failureReason": "",
	      "screenshots": [
	        {
	          "fileName": "01-source.php-succeeded.png",
	          "pageUrl": "https://www.myWebsite.com/",
	          "error": null
	        }
	      ]
	    },

	    "https://www.myWebsite.com/about": {
	      "linkNum": 2,
	      "url": "https://www.myWebsite.com/about",
	      "text": "About Us",
	      "parentUrl": "https://www.myWebsite.com",
	      "status": {
	        "statusCode": 200,
	        "statusText": "OK"
	      },
	      "failureReason": "",
	      "screenshots": [
	        {
	          "fileName": "02-about.php-sourcePage.png",
	          "pageUrl": "https://www.my_website.com",
	          "error": null
	        },
	        {
	          "fileName": "05-about.php-succeeded.png",
	          "pageUrl": "https://www.myWebsite.com/about",
	          "error": null
	        }
	      ]
	    },
	    "https://www.myWebsite.com/contact": {
	      "linkNum": 3,
	      "url": "https://www.myWebsite.com/contact",
	      "text": "Contact Us",
	      "parentUrl": "https://www.myWebsite.com",
	      "status": {
	        "statusCode": 404,
	        "statusText": "Not Found"
	      },
	      "failureReason": "Status code: 404 Not Found",
	      "screenshots": [
	        {
	          "fileName": "03-contact.php-sourcePage.png",
	          "pageUrl": "https://www.myWebsite.com/about",
	          "error": null
	        },
	        {
	          "fileName": "06-contact.php-failed.png",
	          "pageUrl": "https://www.myWebsite.com/contactUs",
	          "error": null
	        }
	      ]
	    },
	    "https://www.myWebsite.com/info": {
	      "linkNum": 3,
	      "url": "https://www.myWebsite.com/info",
	      "text": "More Information",
	      "parentUrl": "https://www.myWebsite.com",
	      "status": {
	        "statusCode": 200,
	        "statusText": "OK"
	      },
	      "failureReason": "",
	      "screenshots": [
	        {
	          "fileName": "04-info.php-sourcePage.png",
	          "pageUrl": "https://www.myWebsite.com",
	          "error": null
	        },
	        {
	          "fileName": "07-info.php-succeeded.png",
	          "pageUrl": "https://www.myWebsite.com/info",
	          "error": null
	        }
	      ]
	    }
	  },
	  "brokenLinks": [
	    "https://www.my_website.com/contactUs"
	  ],
	  "totalLinksChecked": 4,
	  "totalBrokenLinks": 1
	}
From the canary details page and the report, you can see that four links were checked and one link returned a 404 error. The screenshots also show the anchor text that directs to this broken link. Now all you have to do is fix the Contact Us URL and your website will have no broken links!
Metrics emitted by CloudWatch Synthetics to CloudWatch provide a time series view of canary performance. In the syn-nodejs-2.0 runtime, Synthetics added three new metrics for broken links. 2xx response codes indicate a healthy website. 4xx and 5xx response codes indicate a poorly maintained website, which can lower SEO ranking.
The following metrics are emitted by CloudWatch Synthetics:
- SuccessPercent: The percentage of the runs of this canary that succeed with no failures.
- Duration: The duration, in milliseconds, of the canary run.
- 2xx: The number of network requests performed by the canary that returned OK responses, with response codes between 200 and 299. New in syn-nodejs-2.0.
- 4xx: The number of network requests performed by the canary that returned Error responses, with response codes between 400 and 499. New syn-nodejs-2.0.
- 5xx: The number of network requests performed by the canary that returned Error responses, with response codes between 500 and 599. New in syn-nodejs-2.0.
- Failed: The number of failed requests. This metric is emitted only on a canary failure.
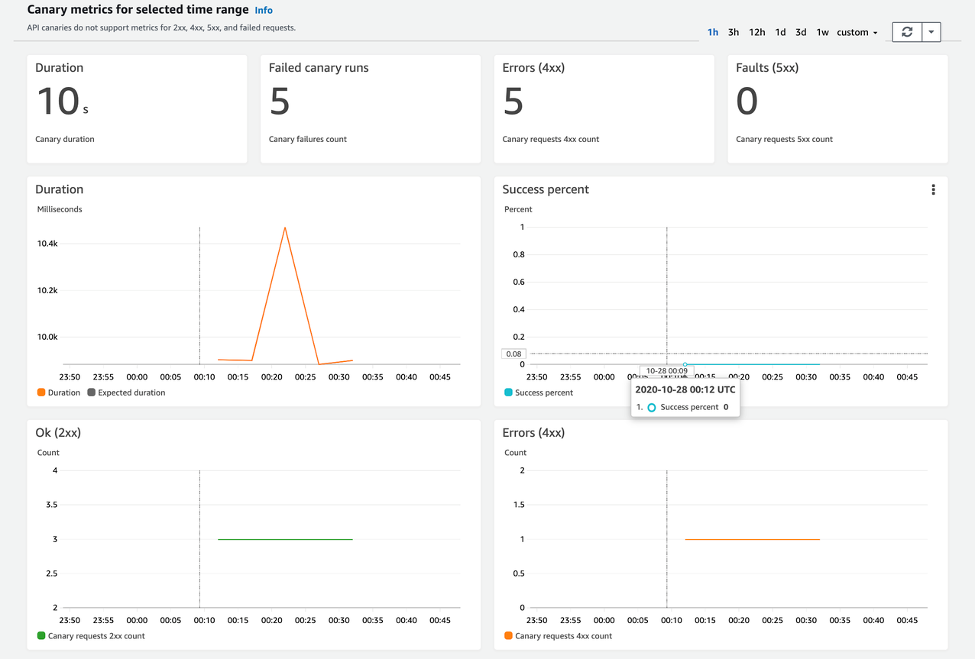
Figure 5: Canary metrics in the Amazon CloudWatch console
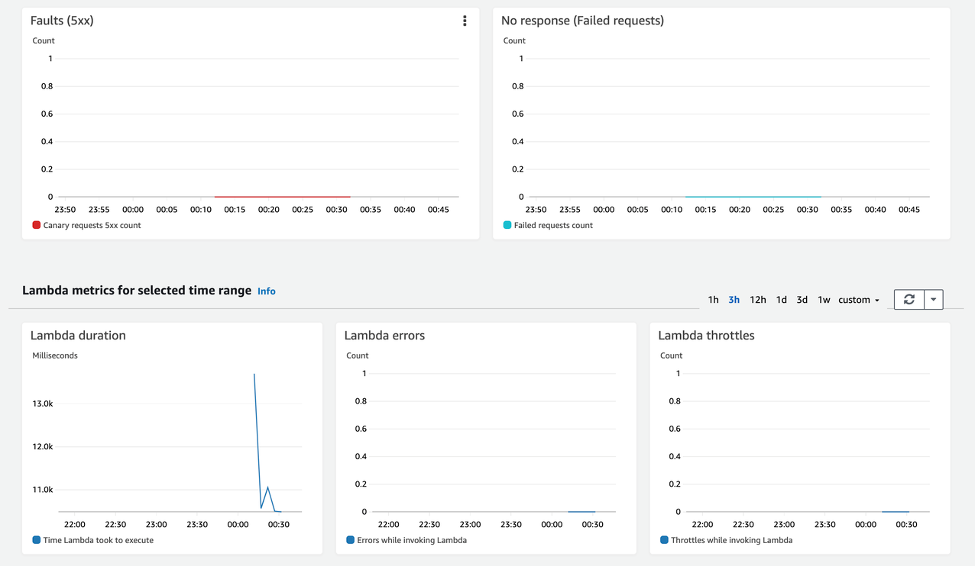
Figure 6: Lambda metrics for selected time range in the Amazon CloudWatch console
Broken links in a website can undermine the credibility of your content. They annoy users and make them reluctant to stay on or return to your site. They can also negatively impact your SEO rankings because search engines use broken links as a measure of a website’s quality. Even worse are links to a website that causes harm through malware or phishing. To avoid these pitfalls, be sure to check all the links on your website.
Cleaning up
To avoid any unwanted costs, remember to clean up the following resources that may be created during this exercise
- The Synthetics canary and associated resources.
- The static S3 endpoint.
- The Public-Private VPC, subnets and security groups.
Conclusion
In this post, I showed how the new Amazon CloudWatch Synthetics blueprint for checking broken links in syn-nodejs-2.0 can be used to create a canary and crawl your website in minutes. The new BrokenLinkCheckerReport.json report and an intuitive UI makes detecting and fixing dead links an effortless process. You can also create a broken link checker canary in a VPC to crawl internal websites and find broken links. For more information, see the Monitor your private internal endpoints 24×7 using CloudWatch Synthetics blog post.
For more information about CloudWatch Synthetics, see Using synthetic monitoring in the Amazon CloudWatch user guide.
About the Author

Anjali Shankar is an engineer with the CloudWatch Synthetics team at AWS. She designs and builds products that provide customers with deeper visibility into end-to-end performance of their websites. She is passionate about performance arts and enjoys learning new dance forms.