AWS Cloud Operations Blog
Introducing OpenTelemetry & PromQL support in Amazon CloudWatch
If you run Kubernetes or microservices workloads on AWS, your metrics likely carry dozens of labels: namespace, pod, container, node, deployment, replica set, and custom business dimensions. To get a complete picture of your environment, you may be splitting your metrics pipeline: Amazon CloudWatch for AWS metrics, and a separate Prometheus-compatible backend for high-cardinality (many unique label combinations) container and application metrics. Some teams go further. They use Prometheus CloudWatch exporters to pull AWS resource metrics into their Prometheus backend through GetMetricData API calls. This adds operational overhead and cost but lets them query everything in one place.
Amazon CloudWatch now natively ingests OpenTelemetry metrics and supports querying them with Prometheus Query Language (PromQL). This preview capability introduces a high-cardinality metrics store that supports up to 150 labels per metric, so you can send rich, label-dense metrics directly to CloudWatch without conversion or truncation. Combined with automatic AWS vended metric enrichment, CloudWatch becomes a single destination for infrastructure, container, and application metrics, all queryable with PromQL.
In this post, you will learn how to:
- Enable OpenTelemetry metrics ingestion and automatic AWS resource enrichment in your account
- Deploy Amazon CloudWatch Container Insights on an Amazon Elastic Kubernetes Service (Amazon EKS) cluster
- Query infrastructure and AWS resource metrics using PromQL in Amazon CloudWatch and Amazon Managed Grafana
- Create custom application metrics in Amazon CloudWatch using the OpenTelemetry SDK and see them automatically enriched with AWS context
What OpenTelemetry support means for Amazon CloudWatch
The OpenTelemetry Protocol (OTLP) is the standard wire protocol for the OpenTelemetry (OTel) project. It defines how telemetry data, including metrics, traces, and logs, is encoded and transported between components. With this preview, CloudWatch exposes a regional OTLP endpoint that OpenTelemetry-compatible collectors or SDKs can send metrics to.
CloudWatch receives the metrics and stores them in a new high-cardinality metrics store, retaining OpenTelemetry metric types, including counters, histograms, gauges, and up-down counters, without conversion. With this launch, CloudWatch completes its support for OpenTelemetry across all three pillars of observability. CloudWatch already accepts traces and logs through its OTLP endpoints, adding native OTLP metrics ingestion means you can now send all your telemetry to CloudWatch using open standards, through a single protocol. Three capabilities make this significant:
Extended label and cardinality support. OTLP-ingested metrics support up to 150 labels, compared to the 30-dimension limit of CloudWatch custom metrics. This removes a key constraint for Kubernetes, microservice, and OpenTelemetry workloads that rely on high-cardinality labels for filtering and aggregation. Visit the quotas page to stay up to date as these limits continue to evolve.
PromQL query support. You can query metrics ingested through OTLP using PromQL. If you already use Prometheus, you can use the same query language directly in CloudWatch and Amazon Managed Grafana, no new syntax to learn.
Automatic AWS resource enrichment. This capability fundamentally changes how you query and filter metrics across your AWS infrastructure. CloudWatch enriches every ingested metric with AWS resource context: account ID, Region, cluster Amazon Resource Name (ARN), and resource tags from AWS Resource Explorer. This enrichment happens automatically, without additional instrumentation. You can filter and group metrics by AWS account, Region, environment tag, or application name, whether they come from Container Insights, a custom application, or an AWS service. No exporters, no custom labels, no additional API calls.
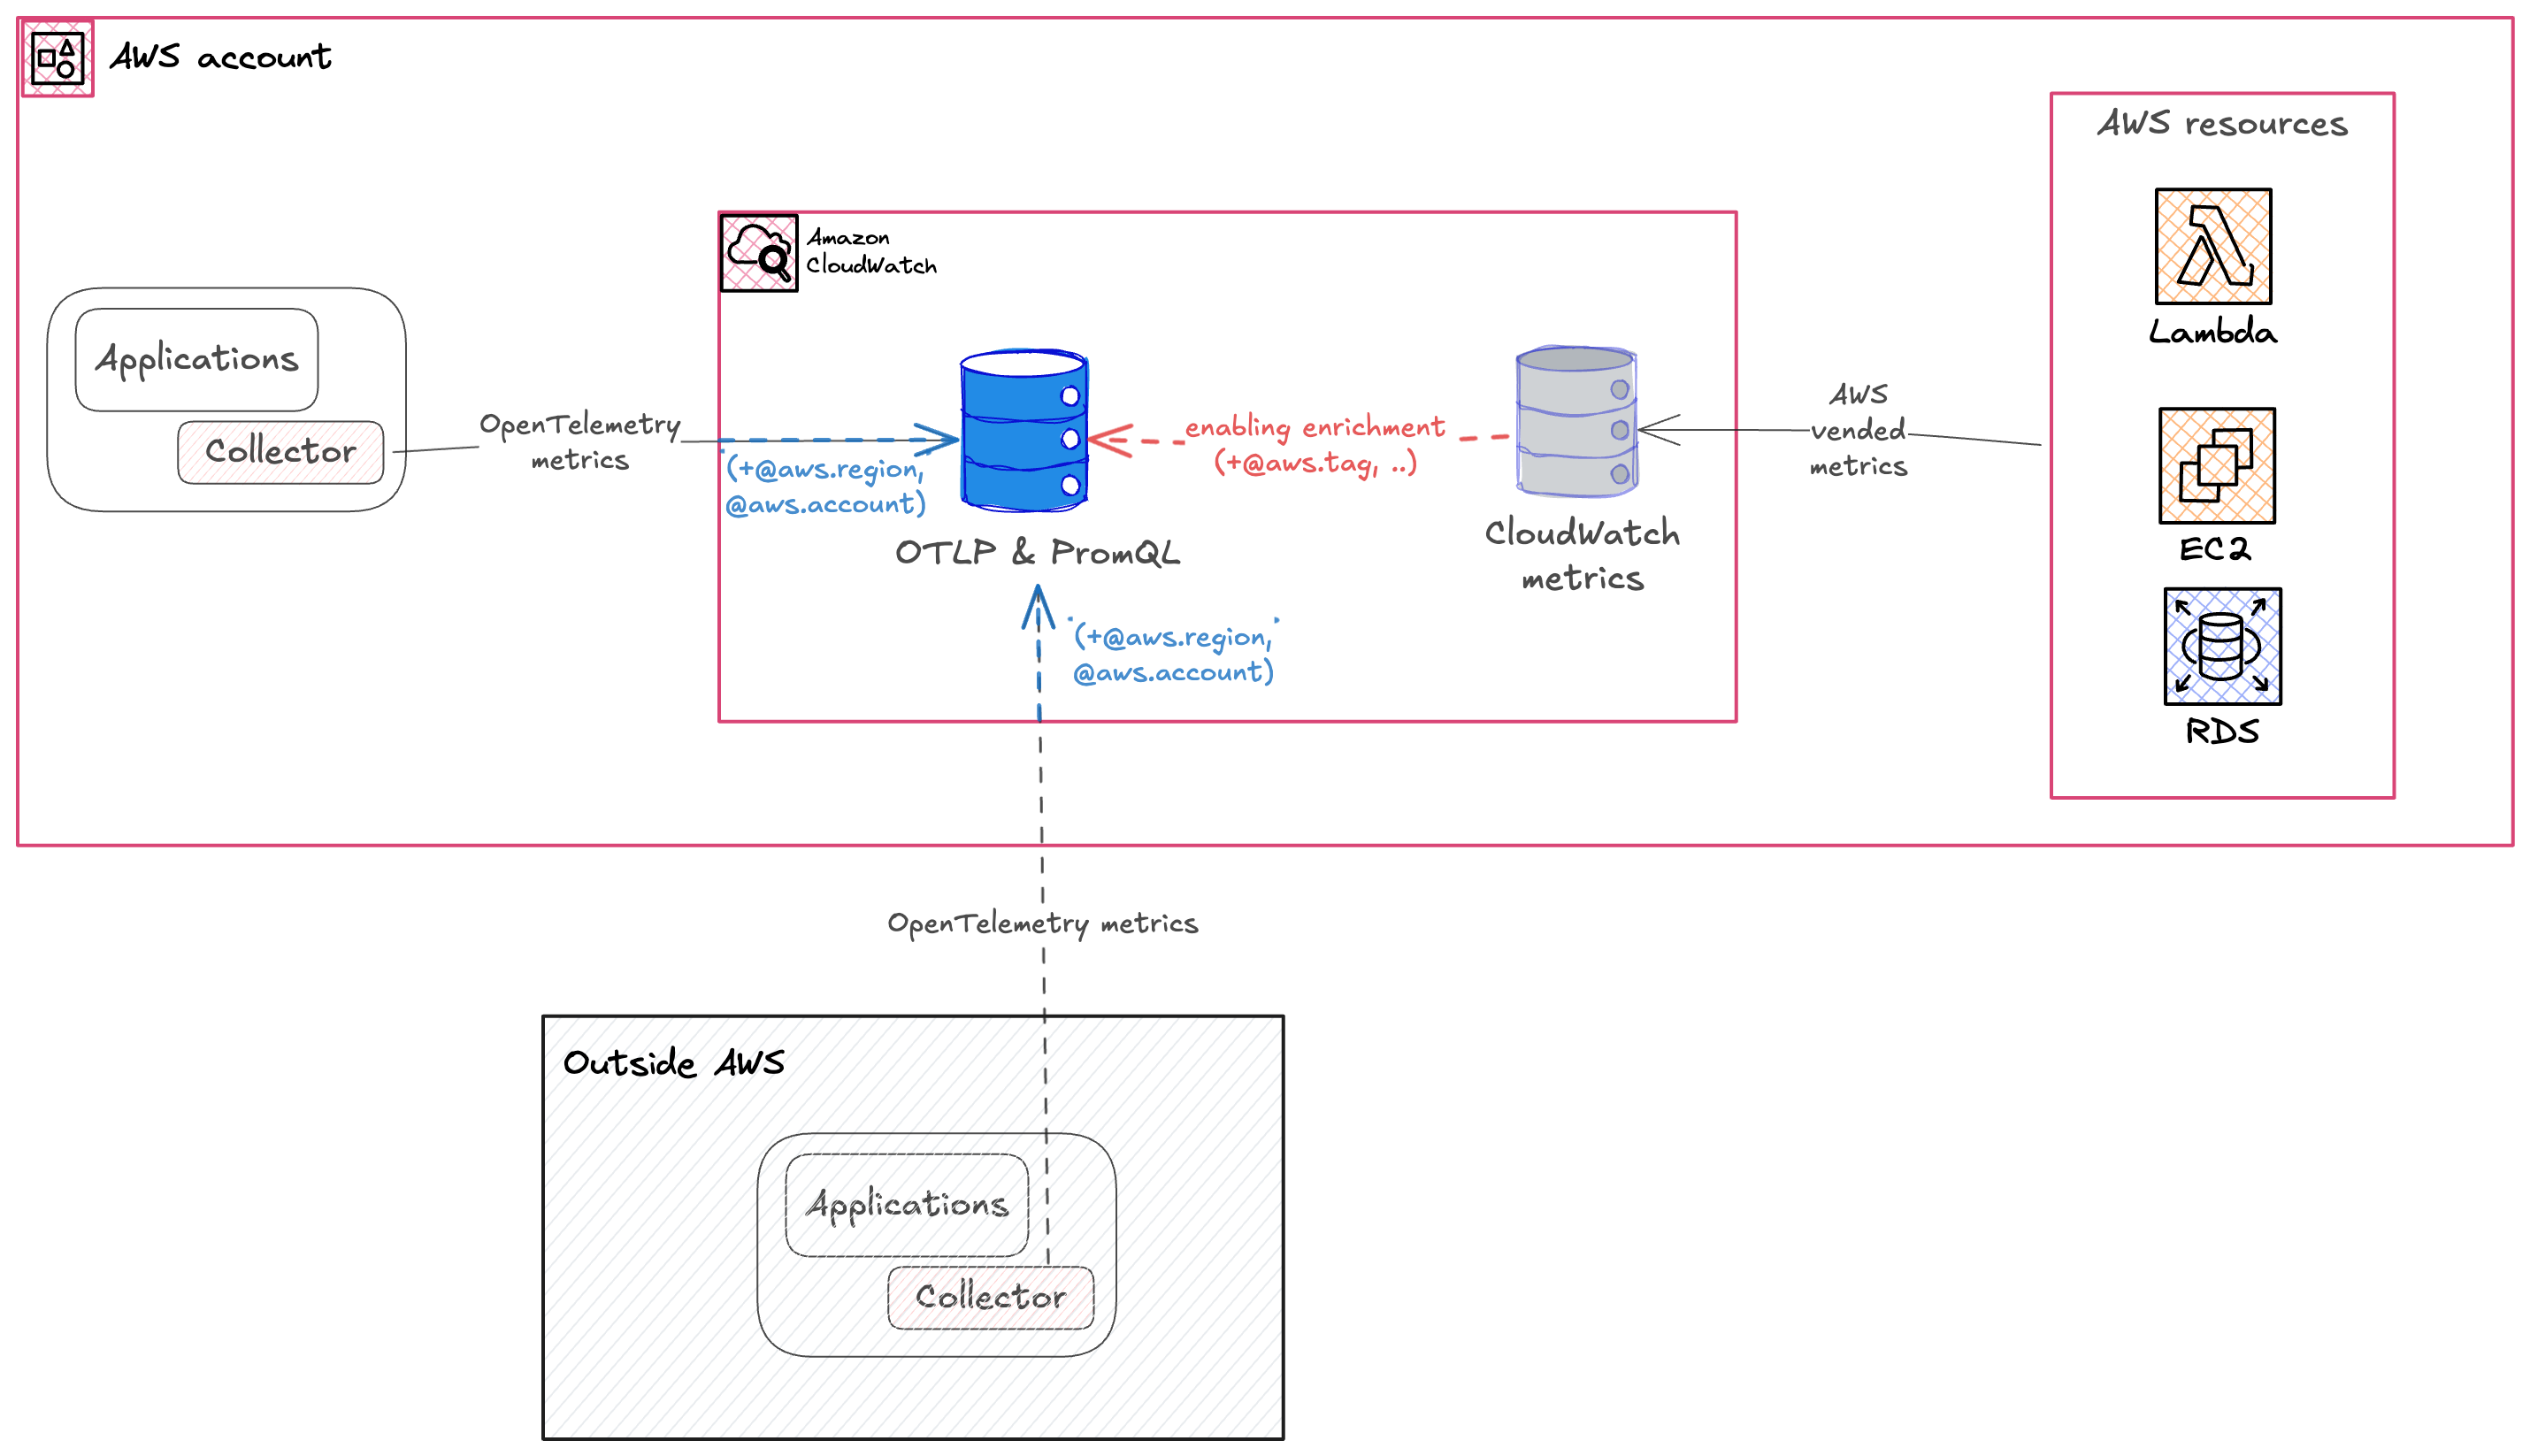
Figure 1: OpenTelemetry metrics ingestion and enrichment architecture in Amazon CloudWatch.
Enable OTLP ingestion and AWS resource enrichment
Before you can ingest and query OTLP metrics, enable two account-level settings. The first enables resource tags propagation from your AWS resources to your telemetry, the same tags you see in AWS Resource Explorer. The second enables OTLP ingestion for CloudWatch.
You can enable both enrichment settings from the Amazon CloudWatch console or using the AWS CLI.
Using the console
To enable enrichment in the CloudWatch console, follow these steps:
- Open the Amazon CloudWatch console.
- In the navigation pane, choose Settings.
- Enable resource tags on telemetry.
- Enable OTel enrichment for AWS metrics.
After you enable both settings, your account is ready to receive OTLP metrics at the regional endpoint.
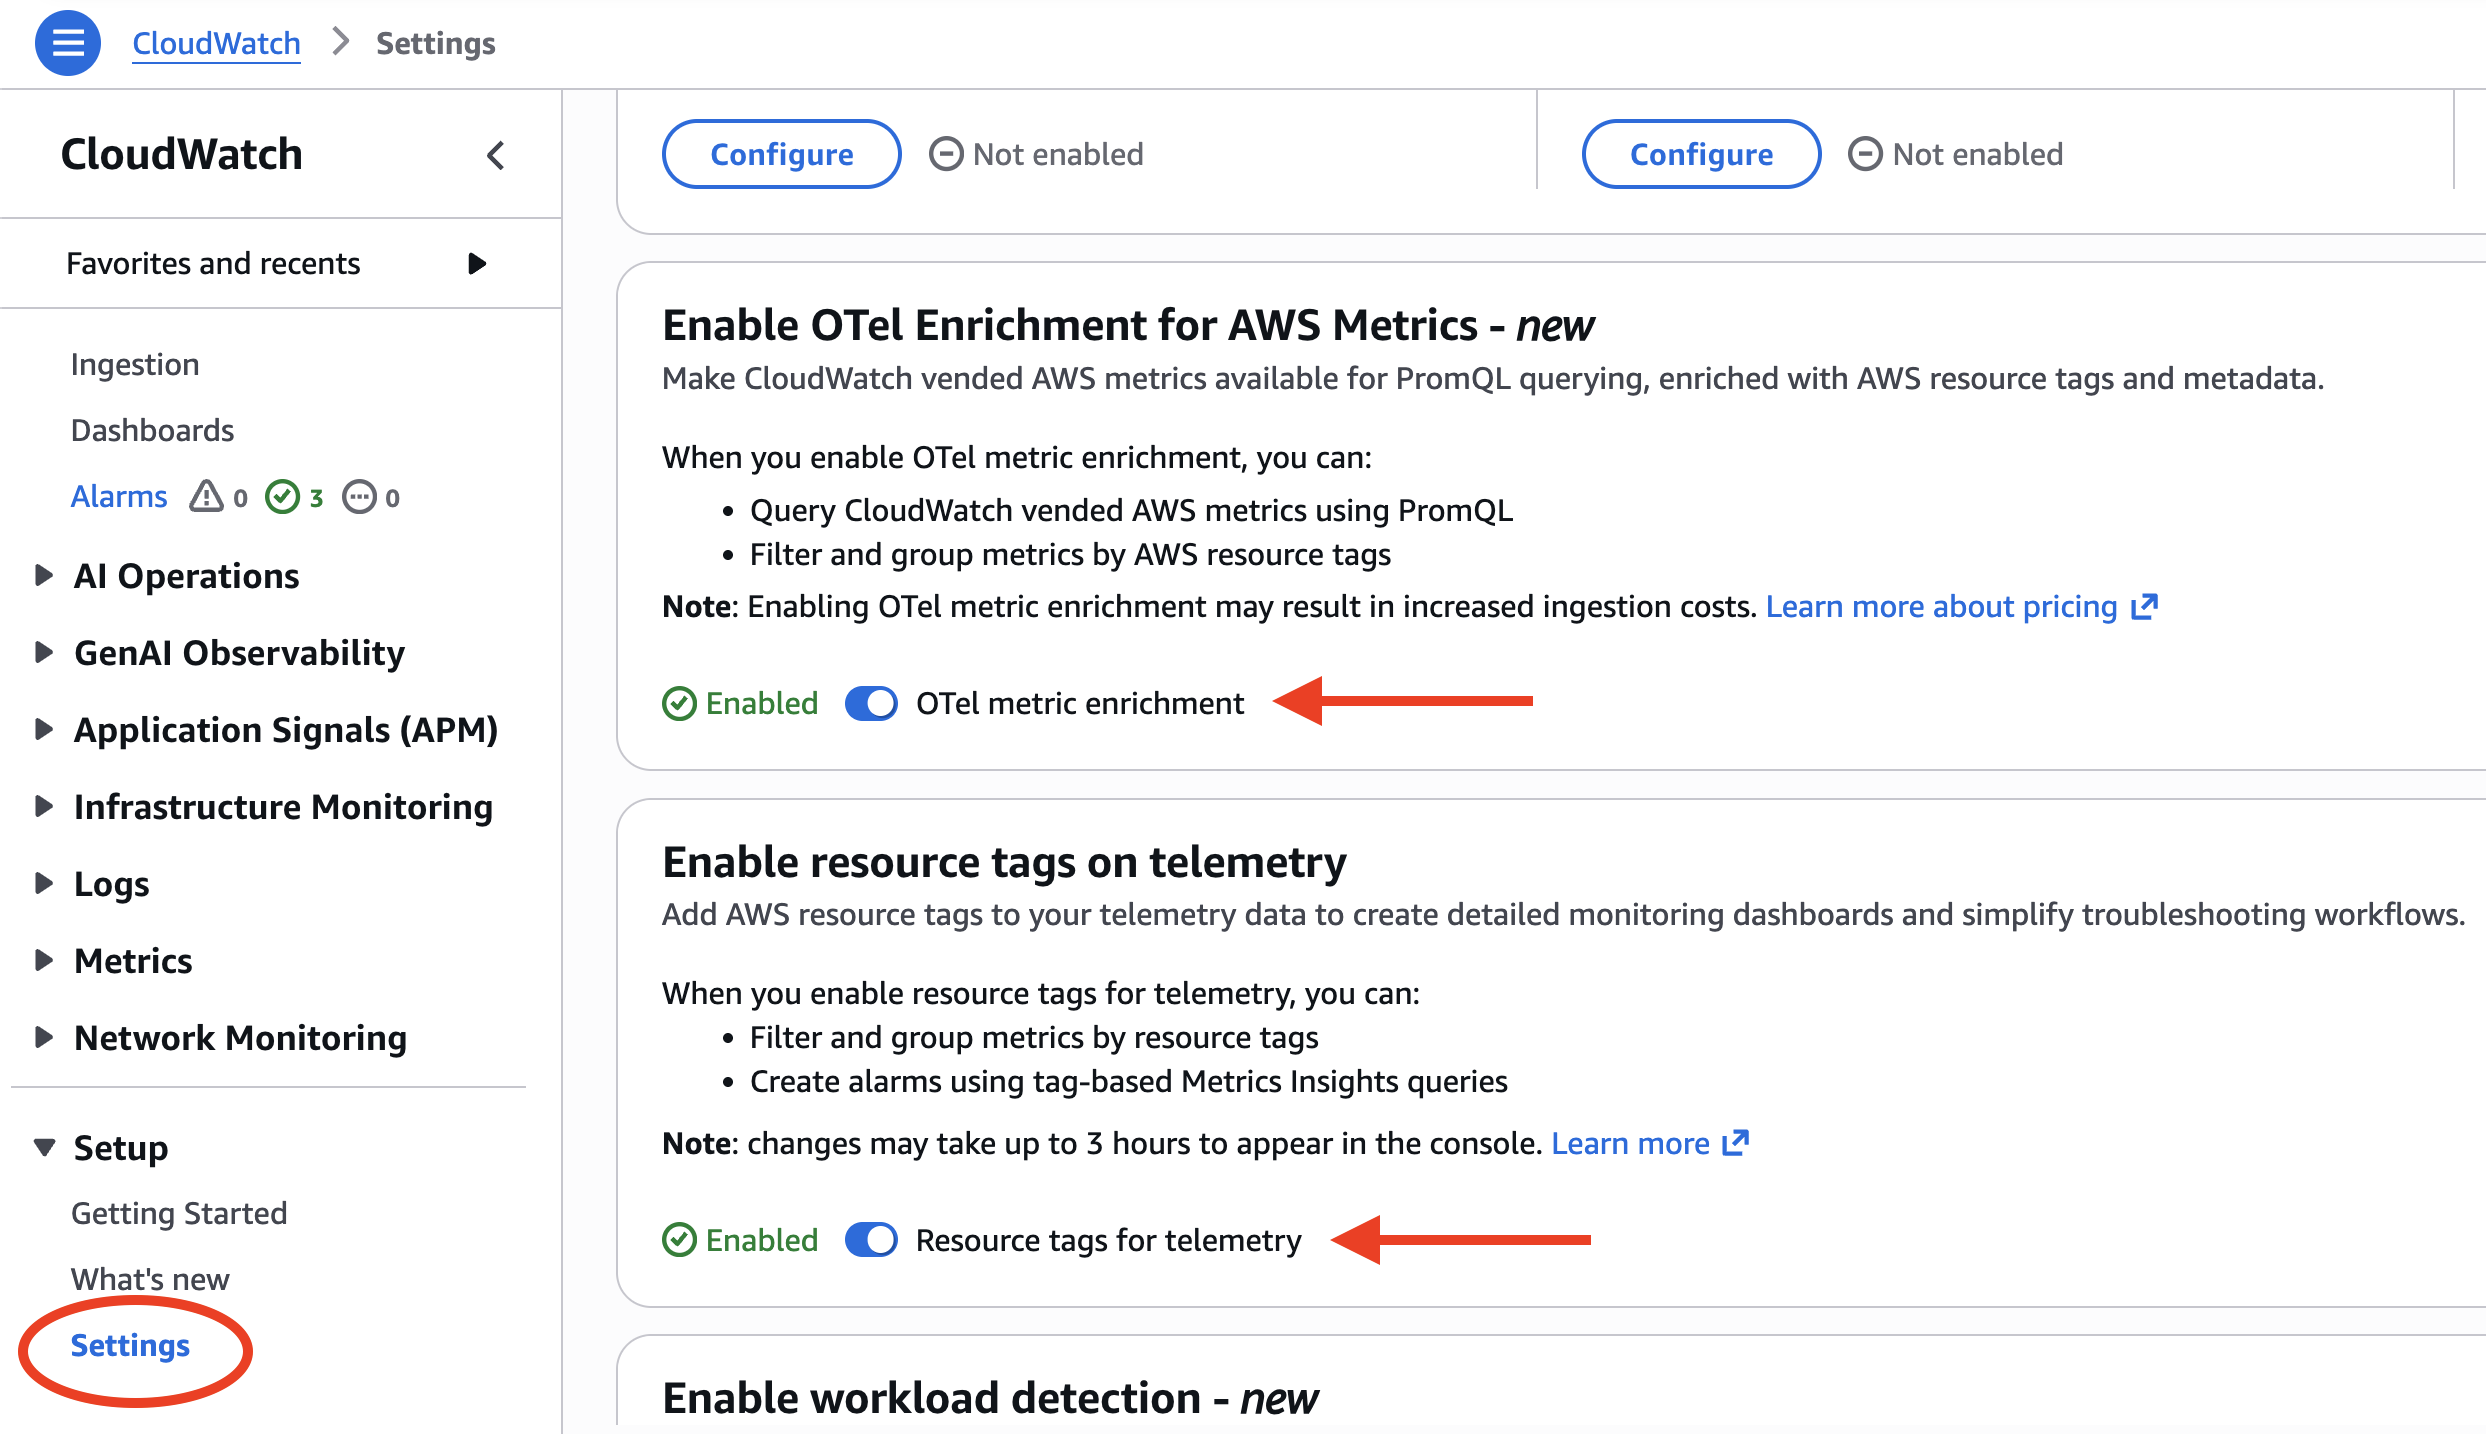
Figure 2: Enabling OTel enrichment and resource tags in the CloudWatch console settings
Using the AWS CLI
Alternatively, use the AWS CLI to enable both enrichment layers. Run the following commands:
# Enable resource tags on telemetry
aws observabilityadmin start-telemetry-enrichment
# Enable OTel enrichment for CloudWatch
aws cloudwatch start-o-tel-enrichment
To verify that both enrichment settings are active, run the following command:
aws cloudwatch describe-o-tel-enrichment-status
With enrichment enabled, every metric ingested through the OTLP endpoint is automatically tagged with AWS resource context. The following table shows the attributes that CloudWatch adds:
| Attribute | Description | Example |
|---|---|---|
| @aws.account | AWS account ID | 123456789012 |
| @aws.region | AWS Region | us-west-2 |
| cloud.resource_id | Full EKS cluster ARN | arn:aws:eks:us-west-2:123456789012:cluster/prod |
| k8s.cluster.name | EKS cluster name | production-cluster |
| k8s.namespace.name | Kubernetes namespace | karpenter |
| k8s.container.name | Container name | controller |
| @instrumentation.name | Instrumentation source | cloudwatch-otel-ci |
| Resource tags | Tags from AWS Resource Explorer (@aws.tag.Application, @aws.tag.CostCenter, @resource.ec2.tag.ManagedBy, …) | env=production |
These attributes are added by CloudWatch with no manual instrumentation required. This is what makes it possible to query across AWS accounts, Regions, and resource tags without building custom pipelines or running exporters.
Amazon CloudWatch Container Insights with OpenTelemetry metrics
To see OpenTelemetry with CloudWatch in action, let’s start with Container Insights. Amazon CloudWatch Container Insights for Amazon EKS now supports Prometheus and OpenTelemetry metrics. This standardizes container metrics with OpenTelemetry attributes and makes them queryable with PromQL. You can enable Container Insights using the Amazon EKS add-on through the console or the AWS CLI.
Container Insights dashboards
After Container Insights is deployed, CloudWatch automatically creates dashboards showing cluster-level metrics including CPU utilization, memory usage, and pod counts. To view these dashboards, open the CloudWatch console, choose Container Insights from the navigation pane, and select your cluster from the dropdown. You can switch between cluster, namespace, and pod-level views to drill into specific workloads.
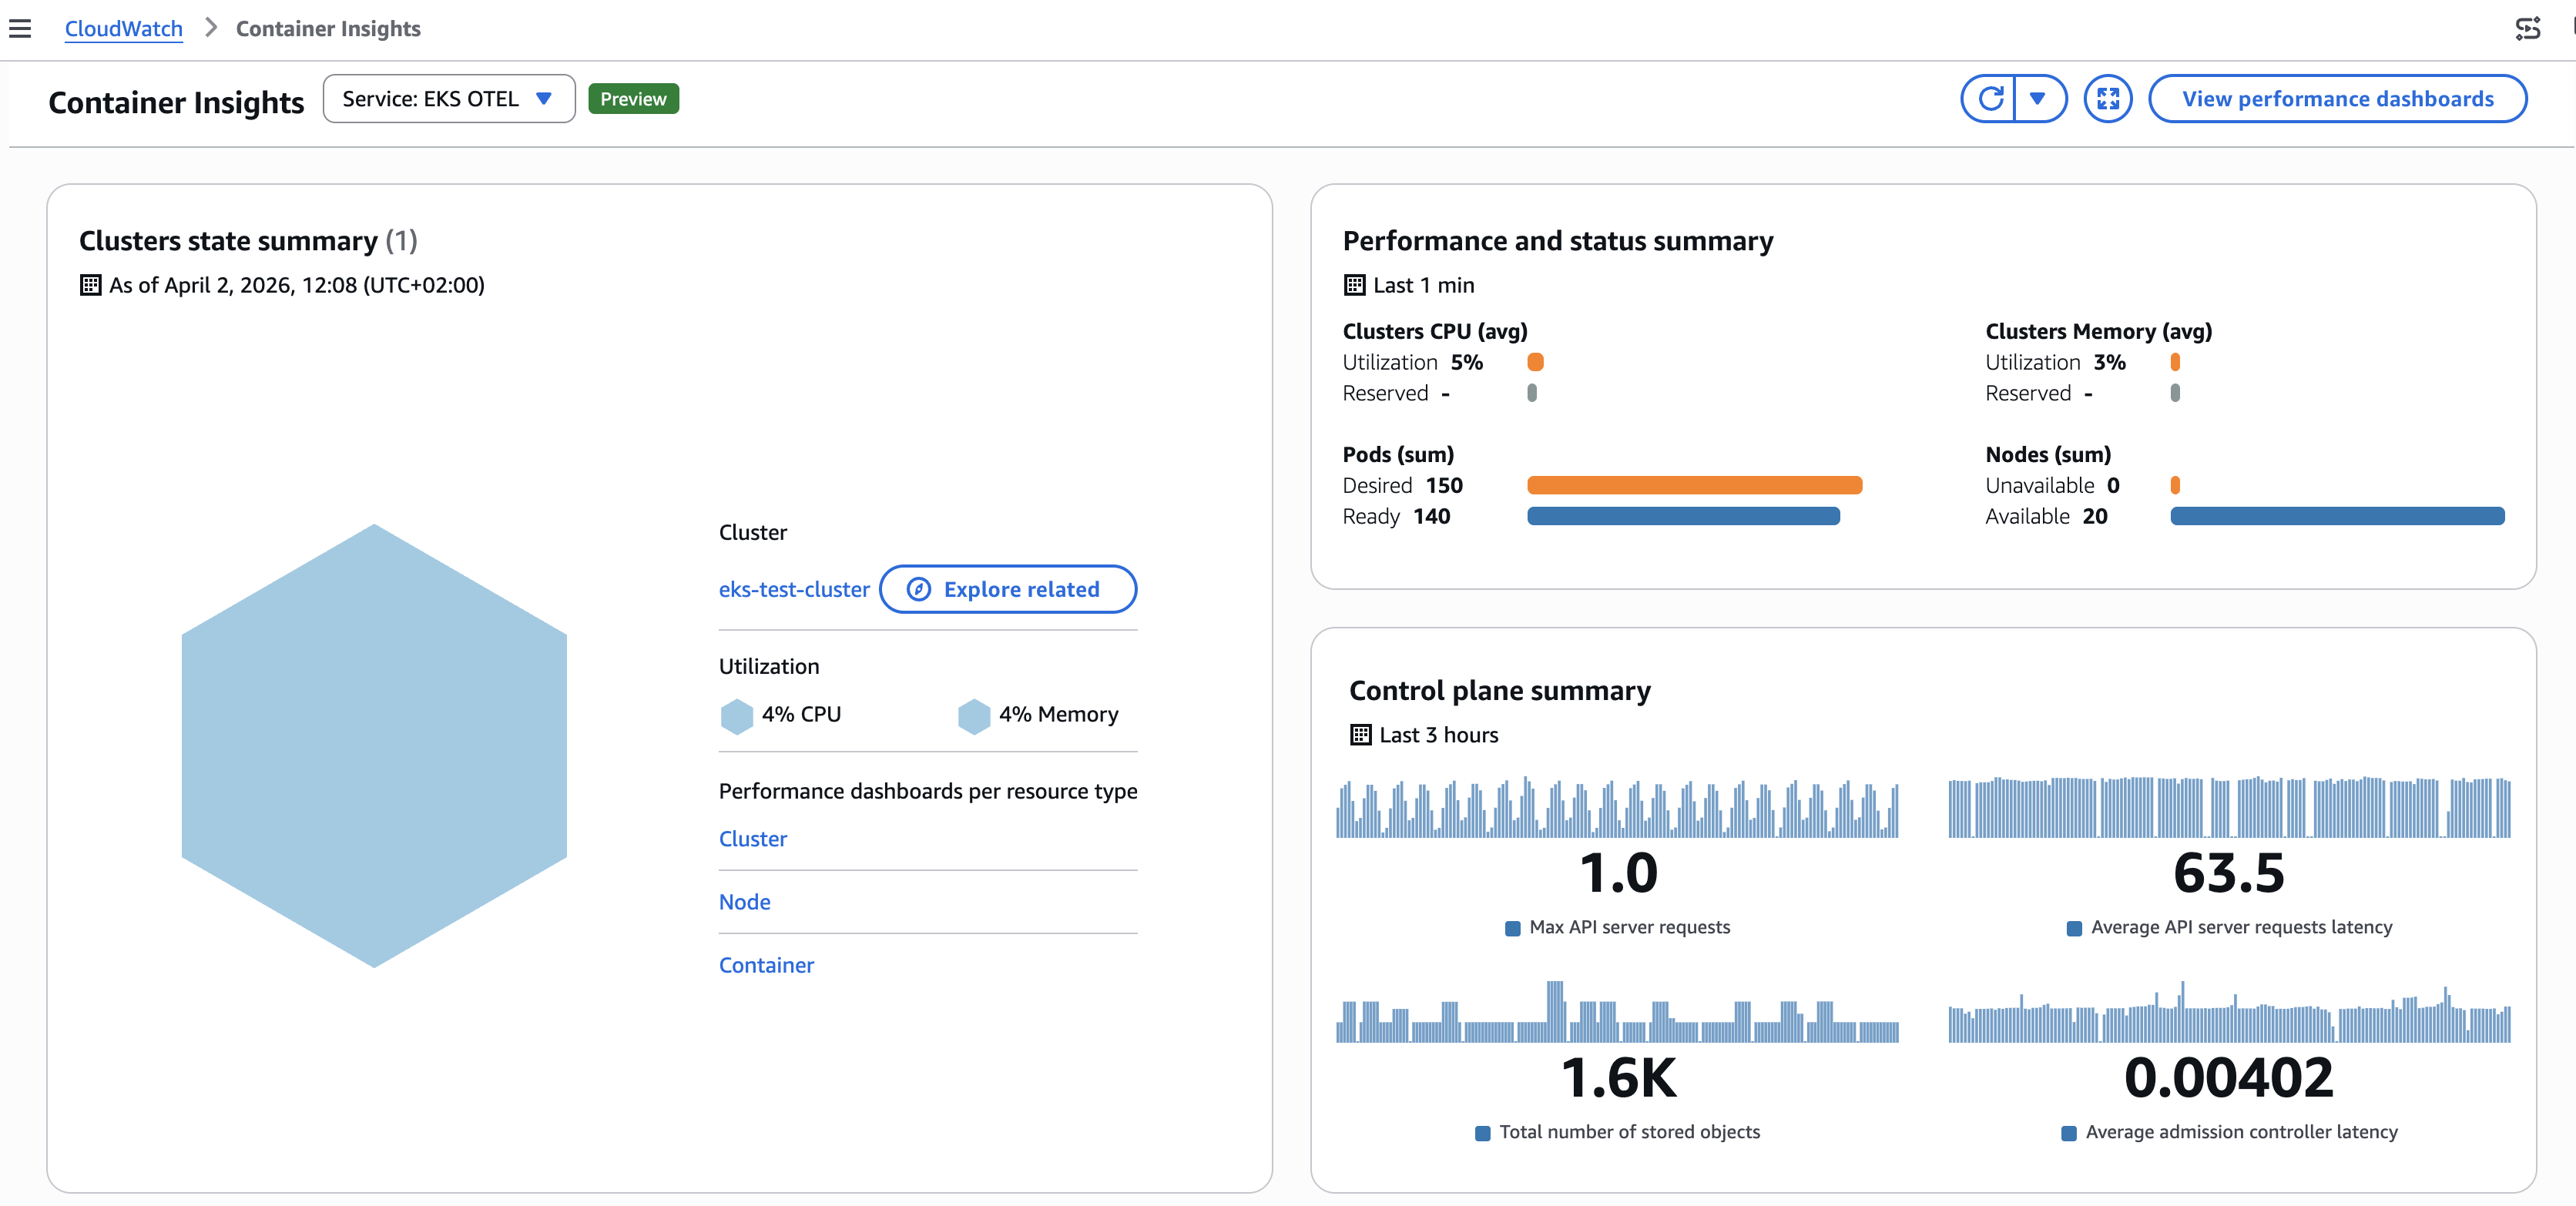
Figure 3: Amazon CloudWatch Container Insights dashboard
Query metrics using PromQL with CloudWatch Query Studio
You can query OTLP-ingested metrics using PromQL in the CloudWatch console, Amazon Managed Grafana, or query interfaces that supports PromQL and AWS Signature Version 4 (SigV4). CloudWatch Query Studio provides a built-in PromQL editor for exploring and visualizing these metrics directly in the console. Select the PromQL query mode to get started.
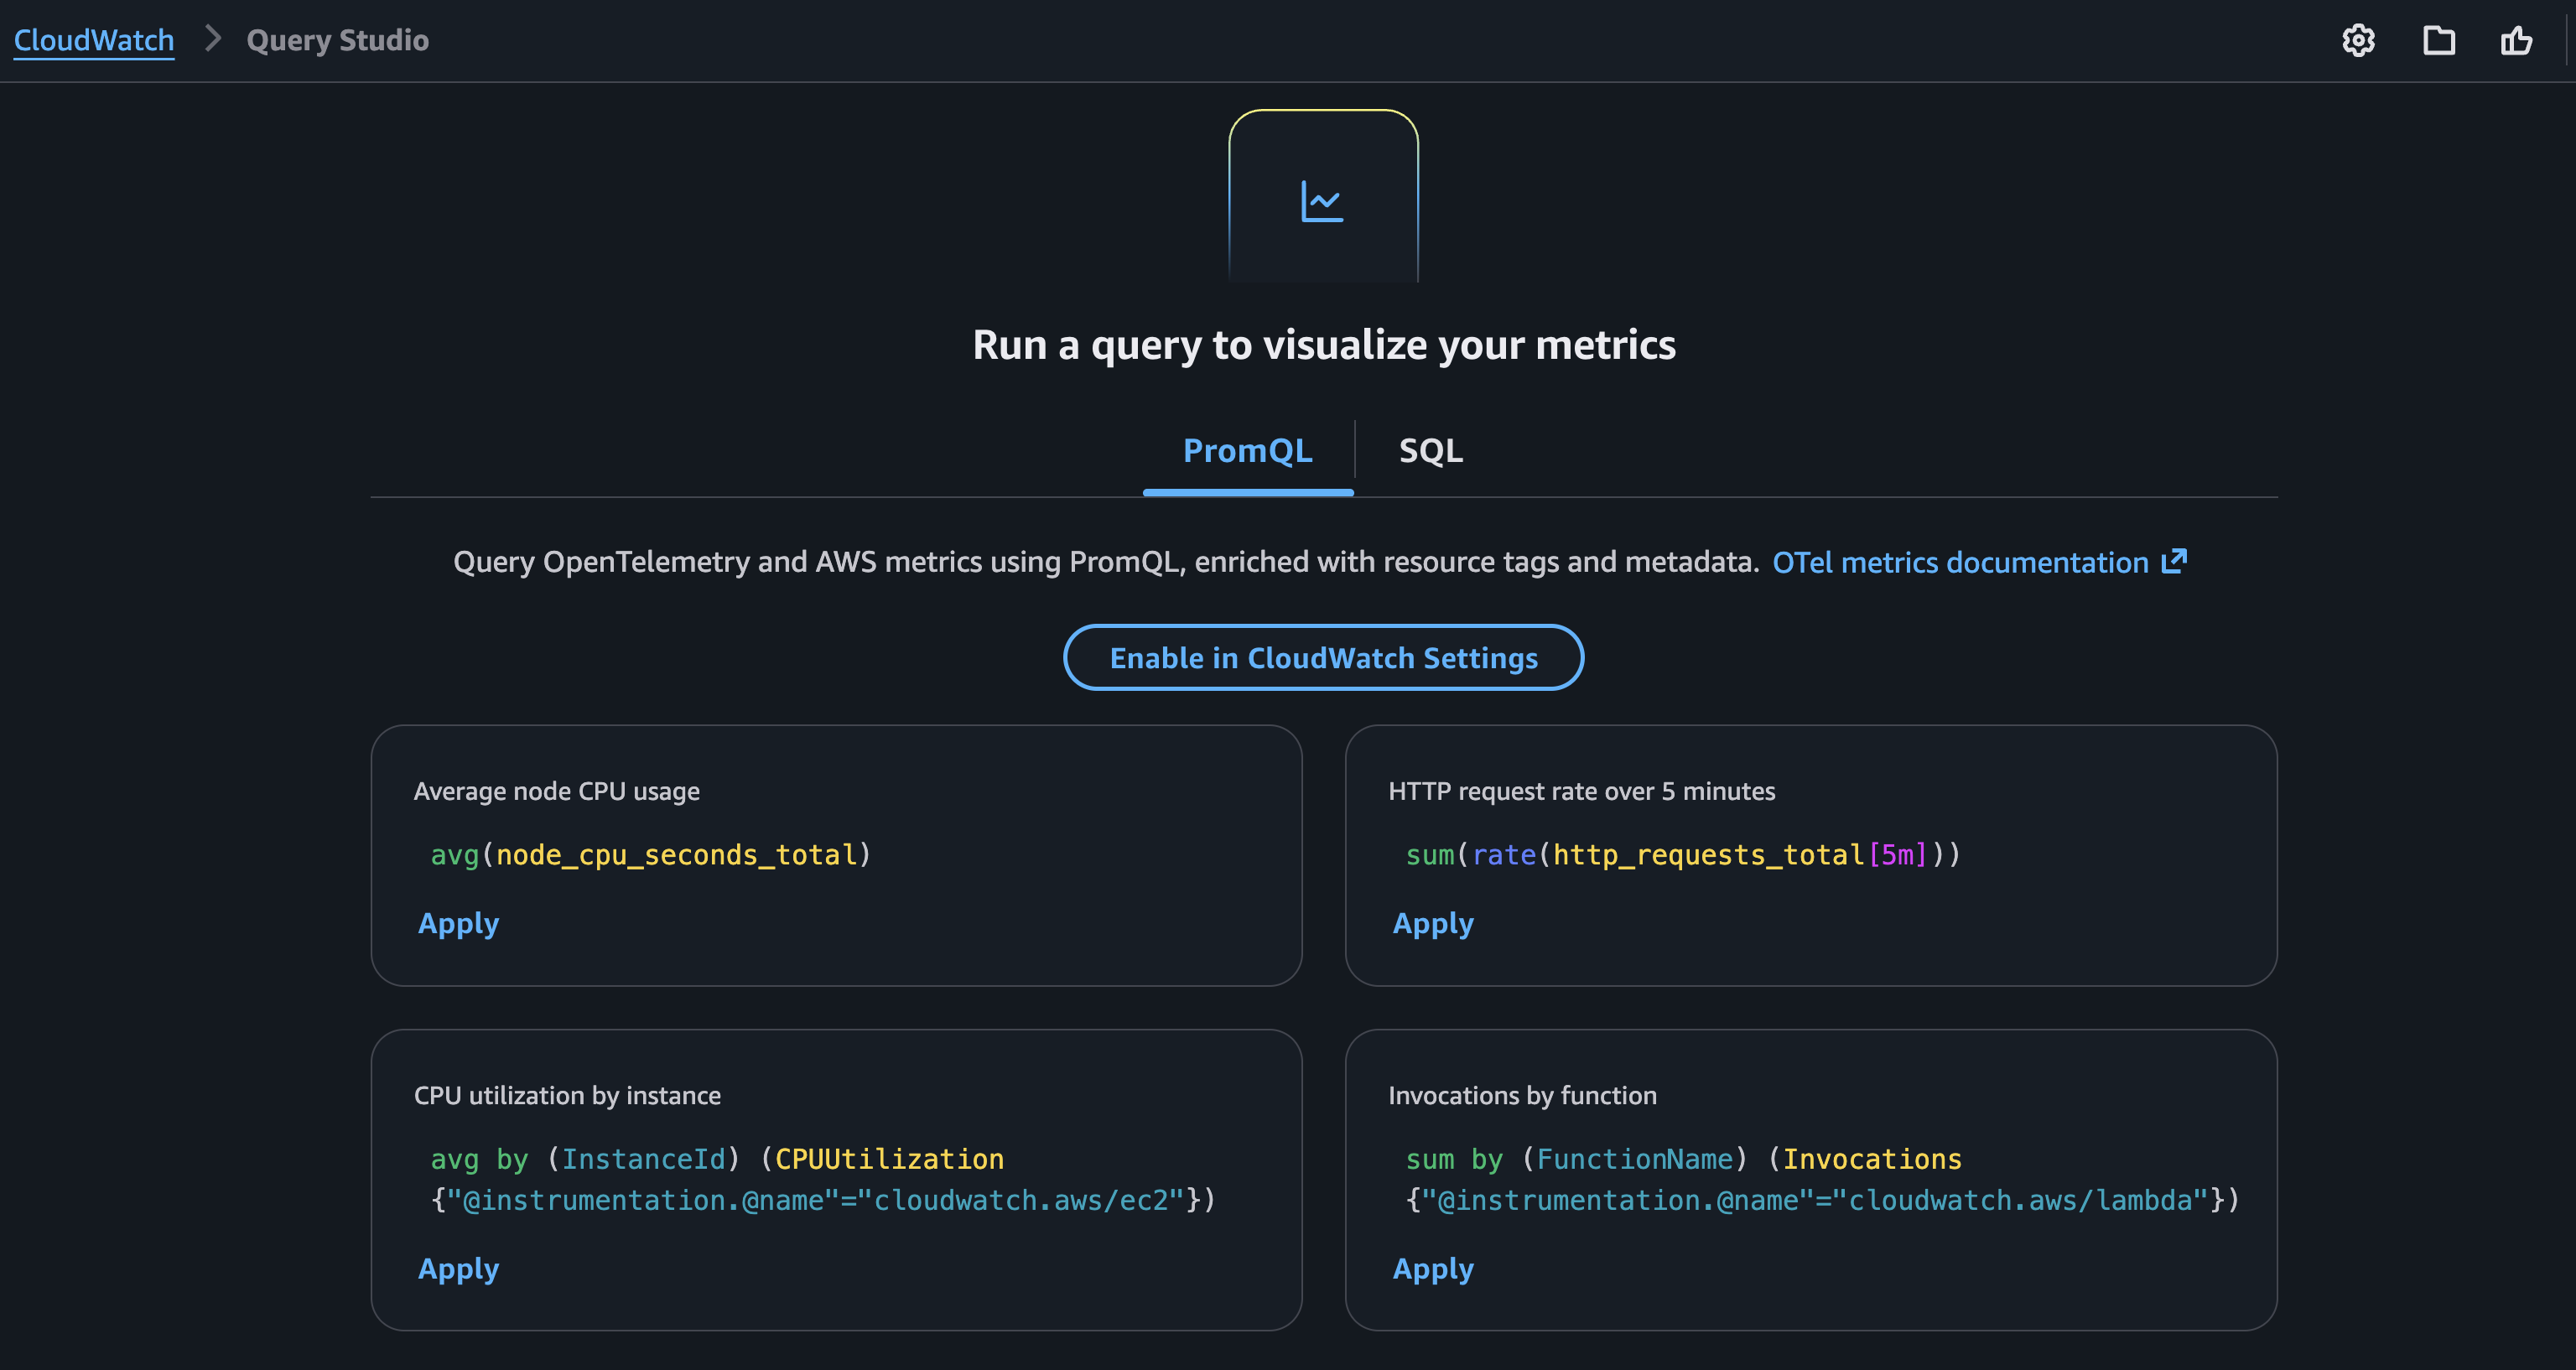
Figure 4: Amazon CloudWatch Query Studio interface with PromQL query mode
Queries using enriched AWS resource context
Because enrichment is enabled, you can query across AWS resource boundaries using the tags that CloudWatch adds automatically. No exporters, no custom labels:
# AWS Lambda function duration for functions tagged with application "order-pipeline"
Duration{"@aws.tag.appname"="order-pipeline"}

# Amazon EC2 CPU utilization for production delivery workloads
CPUUtilization{"@aws.tag.Environment"="production", "@aws.tag.Application"="delivery"}

# Running pods grouped by AWS account and namespace
sum by (aws_account_id, k8s_namespace_name) (kube_pod_status_phase{phase="Running"})
The last query returns the count of running pods grouped by AWS account and Kubernetes namespace without any custom instrumentation. The aws_account_id label is added automatically by the enrichment layer.
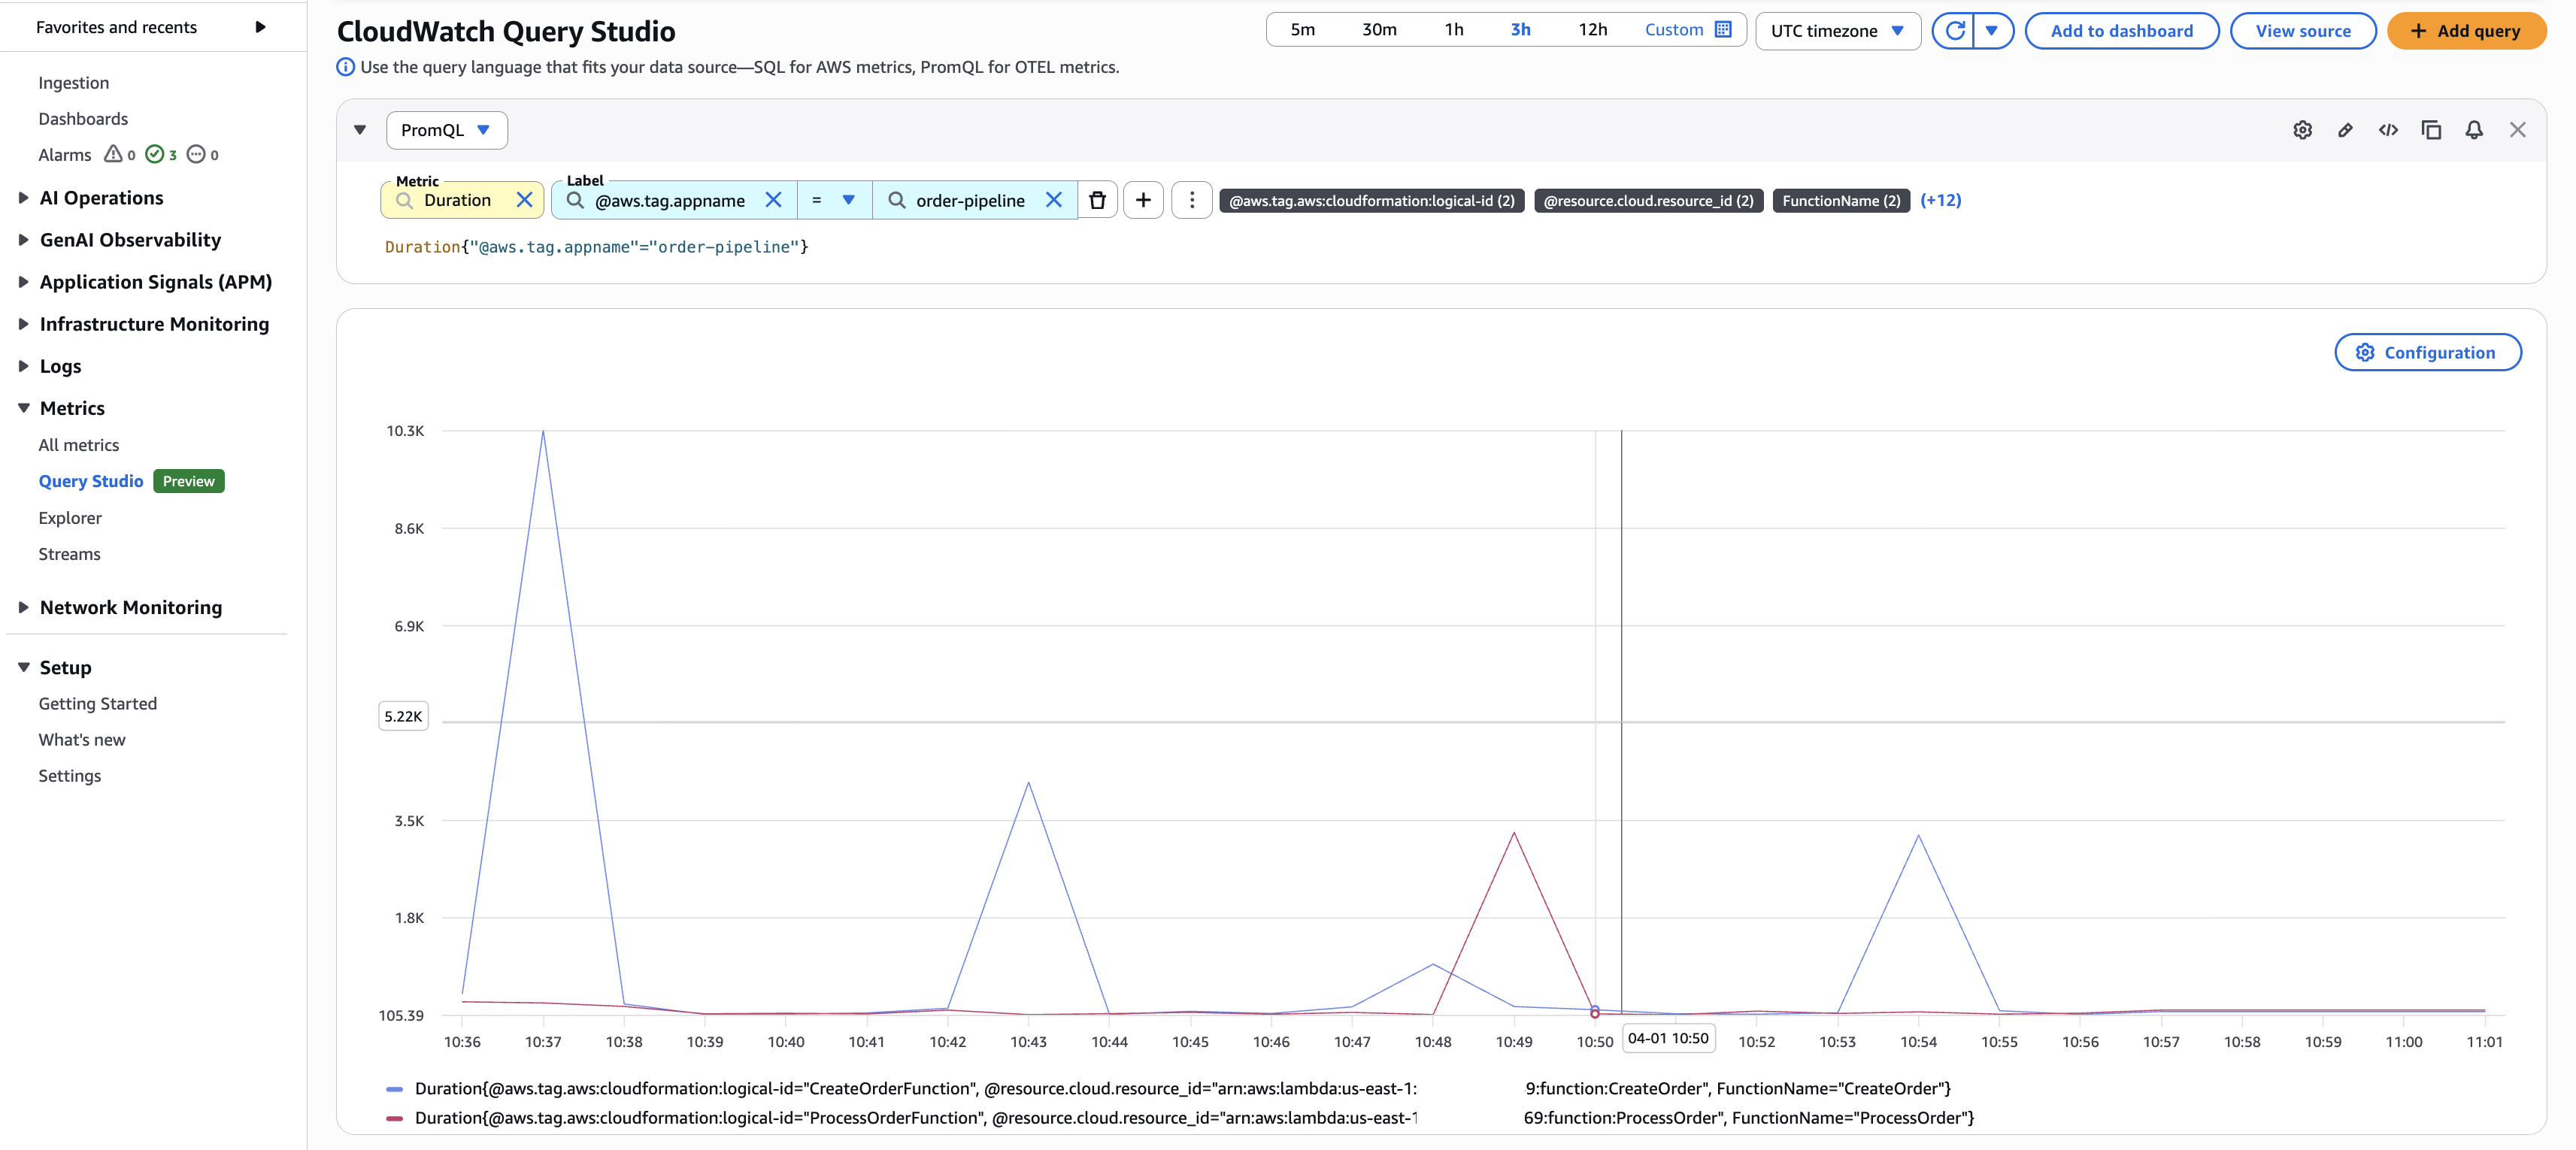
Figure 5: CloudWatch Query Studio querying Lambda duration metrics
Query metrics using PromQL in Grafana
To visualize OTLP-ingested metrics in Amazon Managed Grafana, add a Prometheus data source that points to the CloudWatch PromQL endpoint. This section walks through configuring the data source with AWS Signature Version 4 (SigV4) authentication.
- Open your Amazon Managed Grafana workspace.
- Choose Data Sources.
- Choose Add data source.
- Select Prometheus as the data source type.
- For the URL, enter the CloudWatch PromQL endpoint for your Region:
https://monitoring.<AWS Region>.amazonaws.com/v1/metrics - Under Authentication, select SigV4.
- Configure the appropriate IAM role for SigV4 authentication.
- Choose Save & Test to verify the connection.
If Save & Test succeeds, you will see a “Data source is working” confirmation. If it fails, verify that the IAM role has
cloudwatch:GetMetricDataandcloudwatch:ListMetricspermissions, and that SigV4 signing is properly configured.
After the data source is configured, you can use the same PromQL queries in Grafana dashboards.
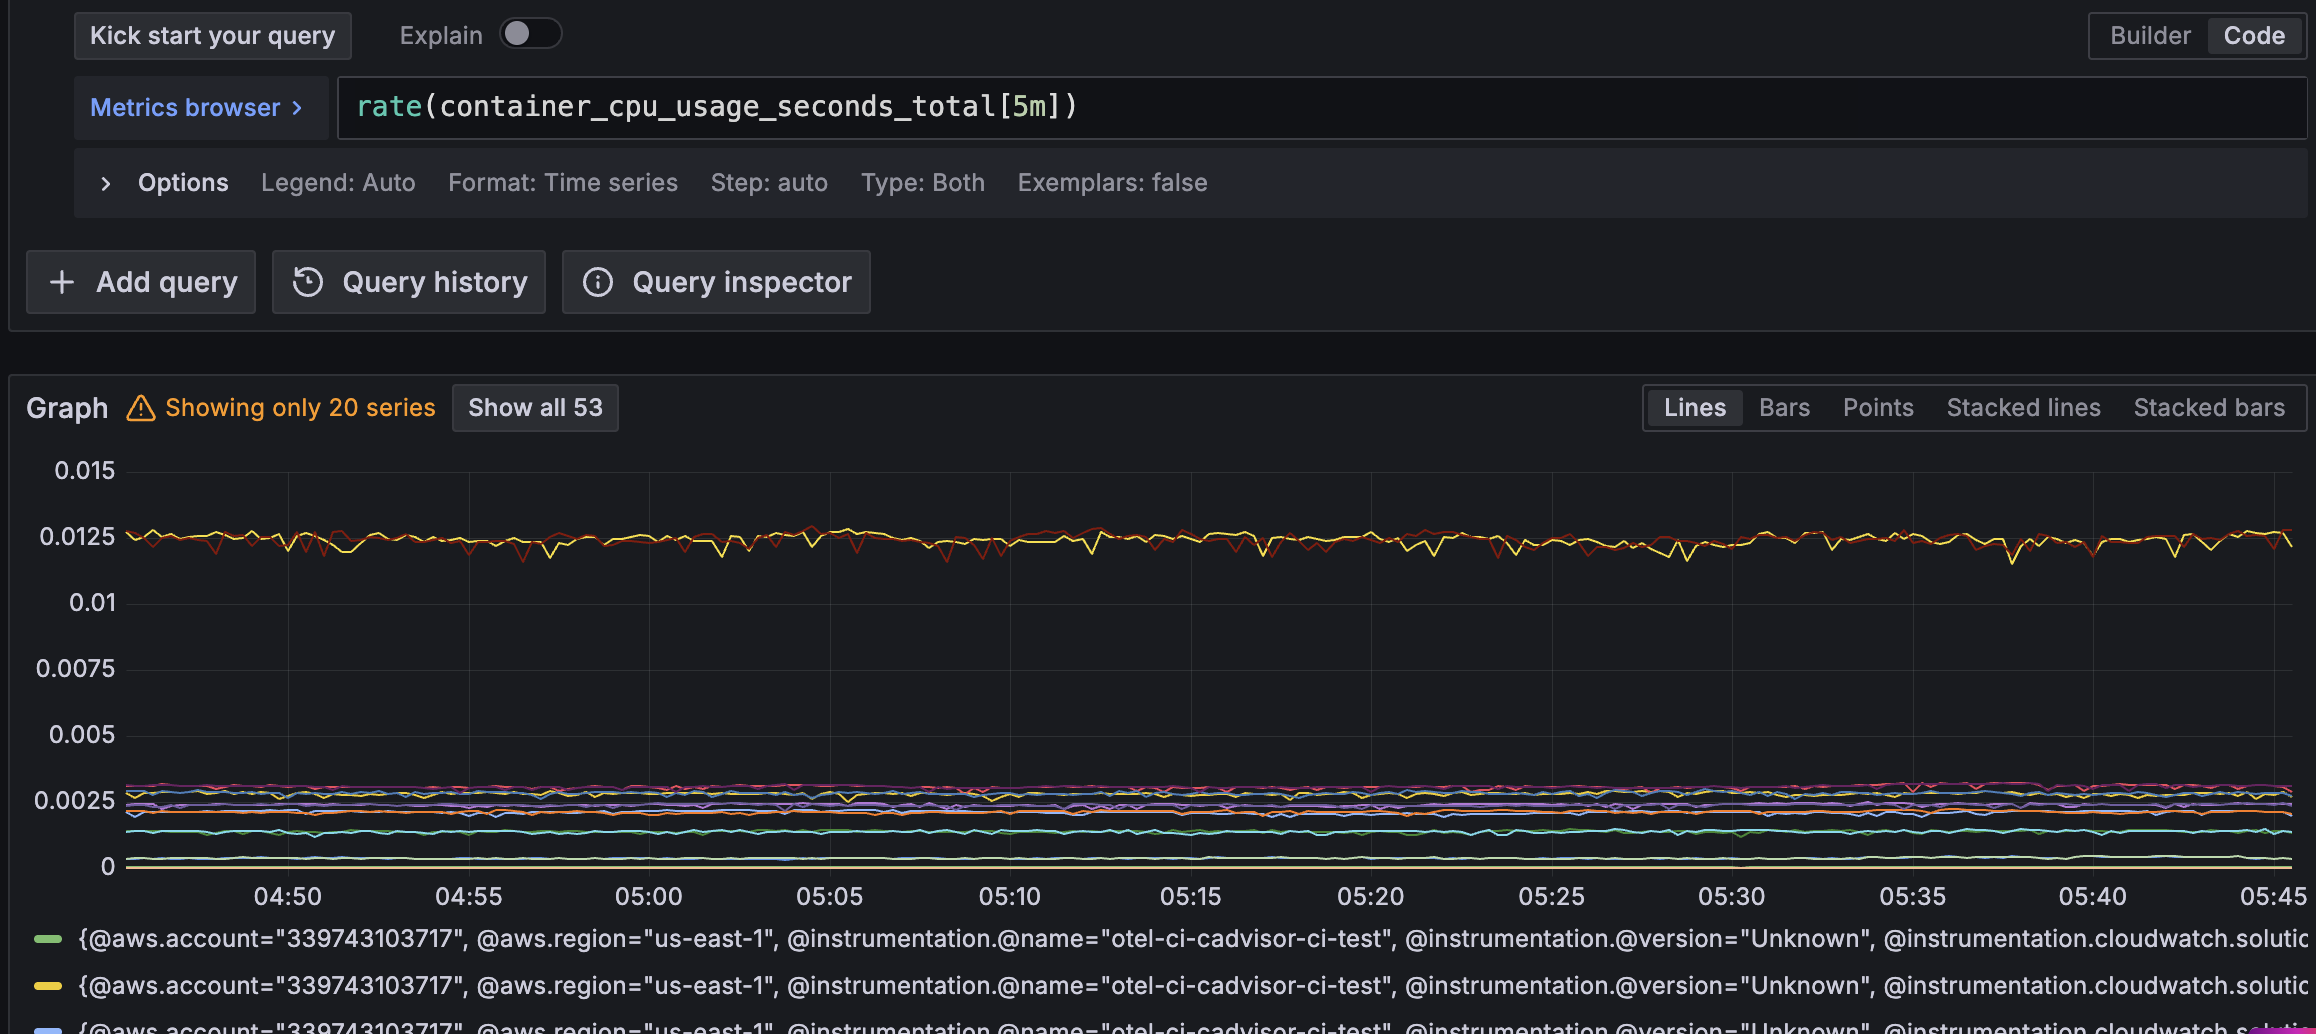
Figure 6: Grafana Explore with CloudWatch PromQL
Custom application metrics
CloudWatch OTLP ingestion also supports custom application metrics. Applications instrumented with an OpenTelemetry SDK can send metrics through the CloudWatch agent running in your cluster with no changes to your instrumentation code required.
To see this in action, deploy a sample Python application from the aws-otel-community repository. The application uses the OpenTelemetry Python SDK to emit custom metrics covering all OTel metric types: counters, histograms, gauges, and up-down counters. For example, the app defines a latency_time histogram that measures API response times:
from opentelemetry import metrics
meter = metrics.get_meter(__name__)

# Histogram --- measures API latency distribution
latency_time = meter.create_histogram(
  name="latency_time",
  description="Measures latency time",
  unit="ms",
)
Deploy the sample application
Find the sample application and all deployment manifests in the aws-otel-community repository on GitHub. The Container Insights add-on you deployed earlier includes a CloudWatch agent that acts as an OpenTelemetry collector. Point the sample app to it by setting the OTEL_EXPORTER_OTLP_ENDPOINT environment variable: http://cloudwatch-agent.amazon-cloudwatch.svc.cluster.local:4317.
This walkthrough uses the CloudWatch agent, but you can use any OpenTelemetry-compatible collector or SDK that supports OTLP/HTTP to send metrics directly to the CloudWatch OTLP endpoint.
Query application metrics with PromQL
After deploying the application, open CloudWatch Query Studio or in your Amazon Managed Grafana workspace, navigate to Explore, and select the CloudWatch PromQL data source.
The following query shows the p99 latency for the demo app in Amazon Managed Grafana, grouped by the automatically enriched @aws.region label:
histogram_quantile(0.99, sum by (le, aws_region) (rate(latency_time_bucket{resource_service_name="python-demo-app"}[5m])))`
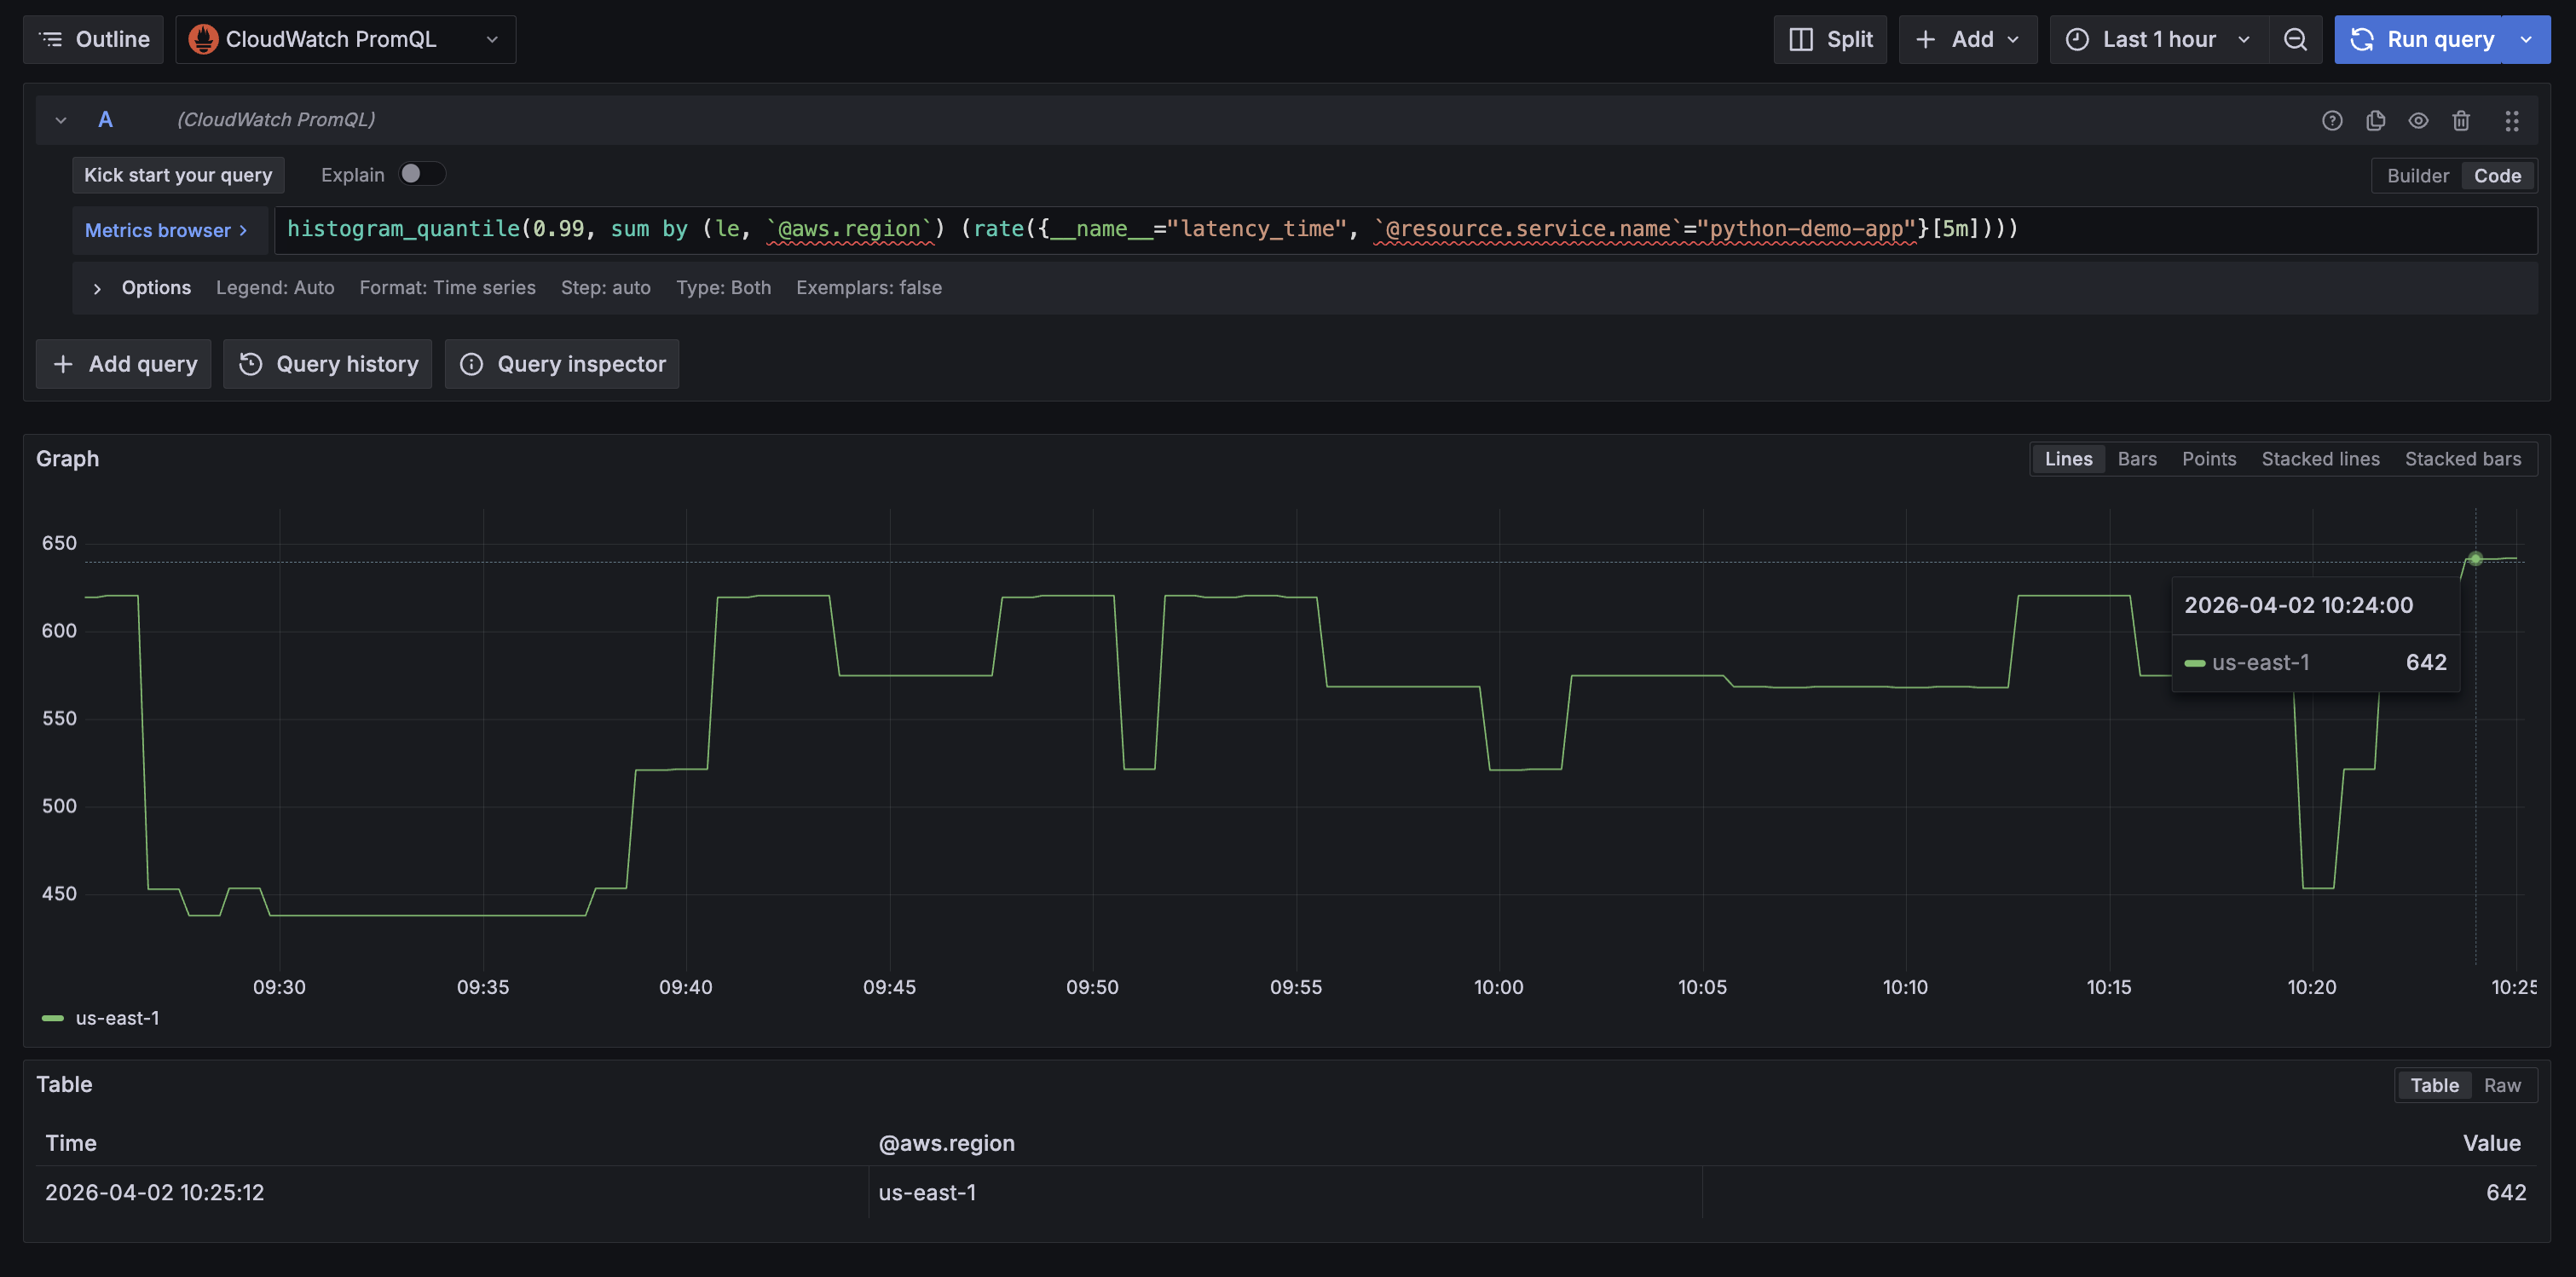
Figure 7: P99 latency for the sample application in Amazon Managed Grafana
Because enrichment is enabled, every application metric is automatically enriched with AWS resource context. For example, querying cpu_usage returns these labels without any additional instrumentation:
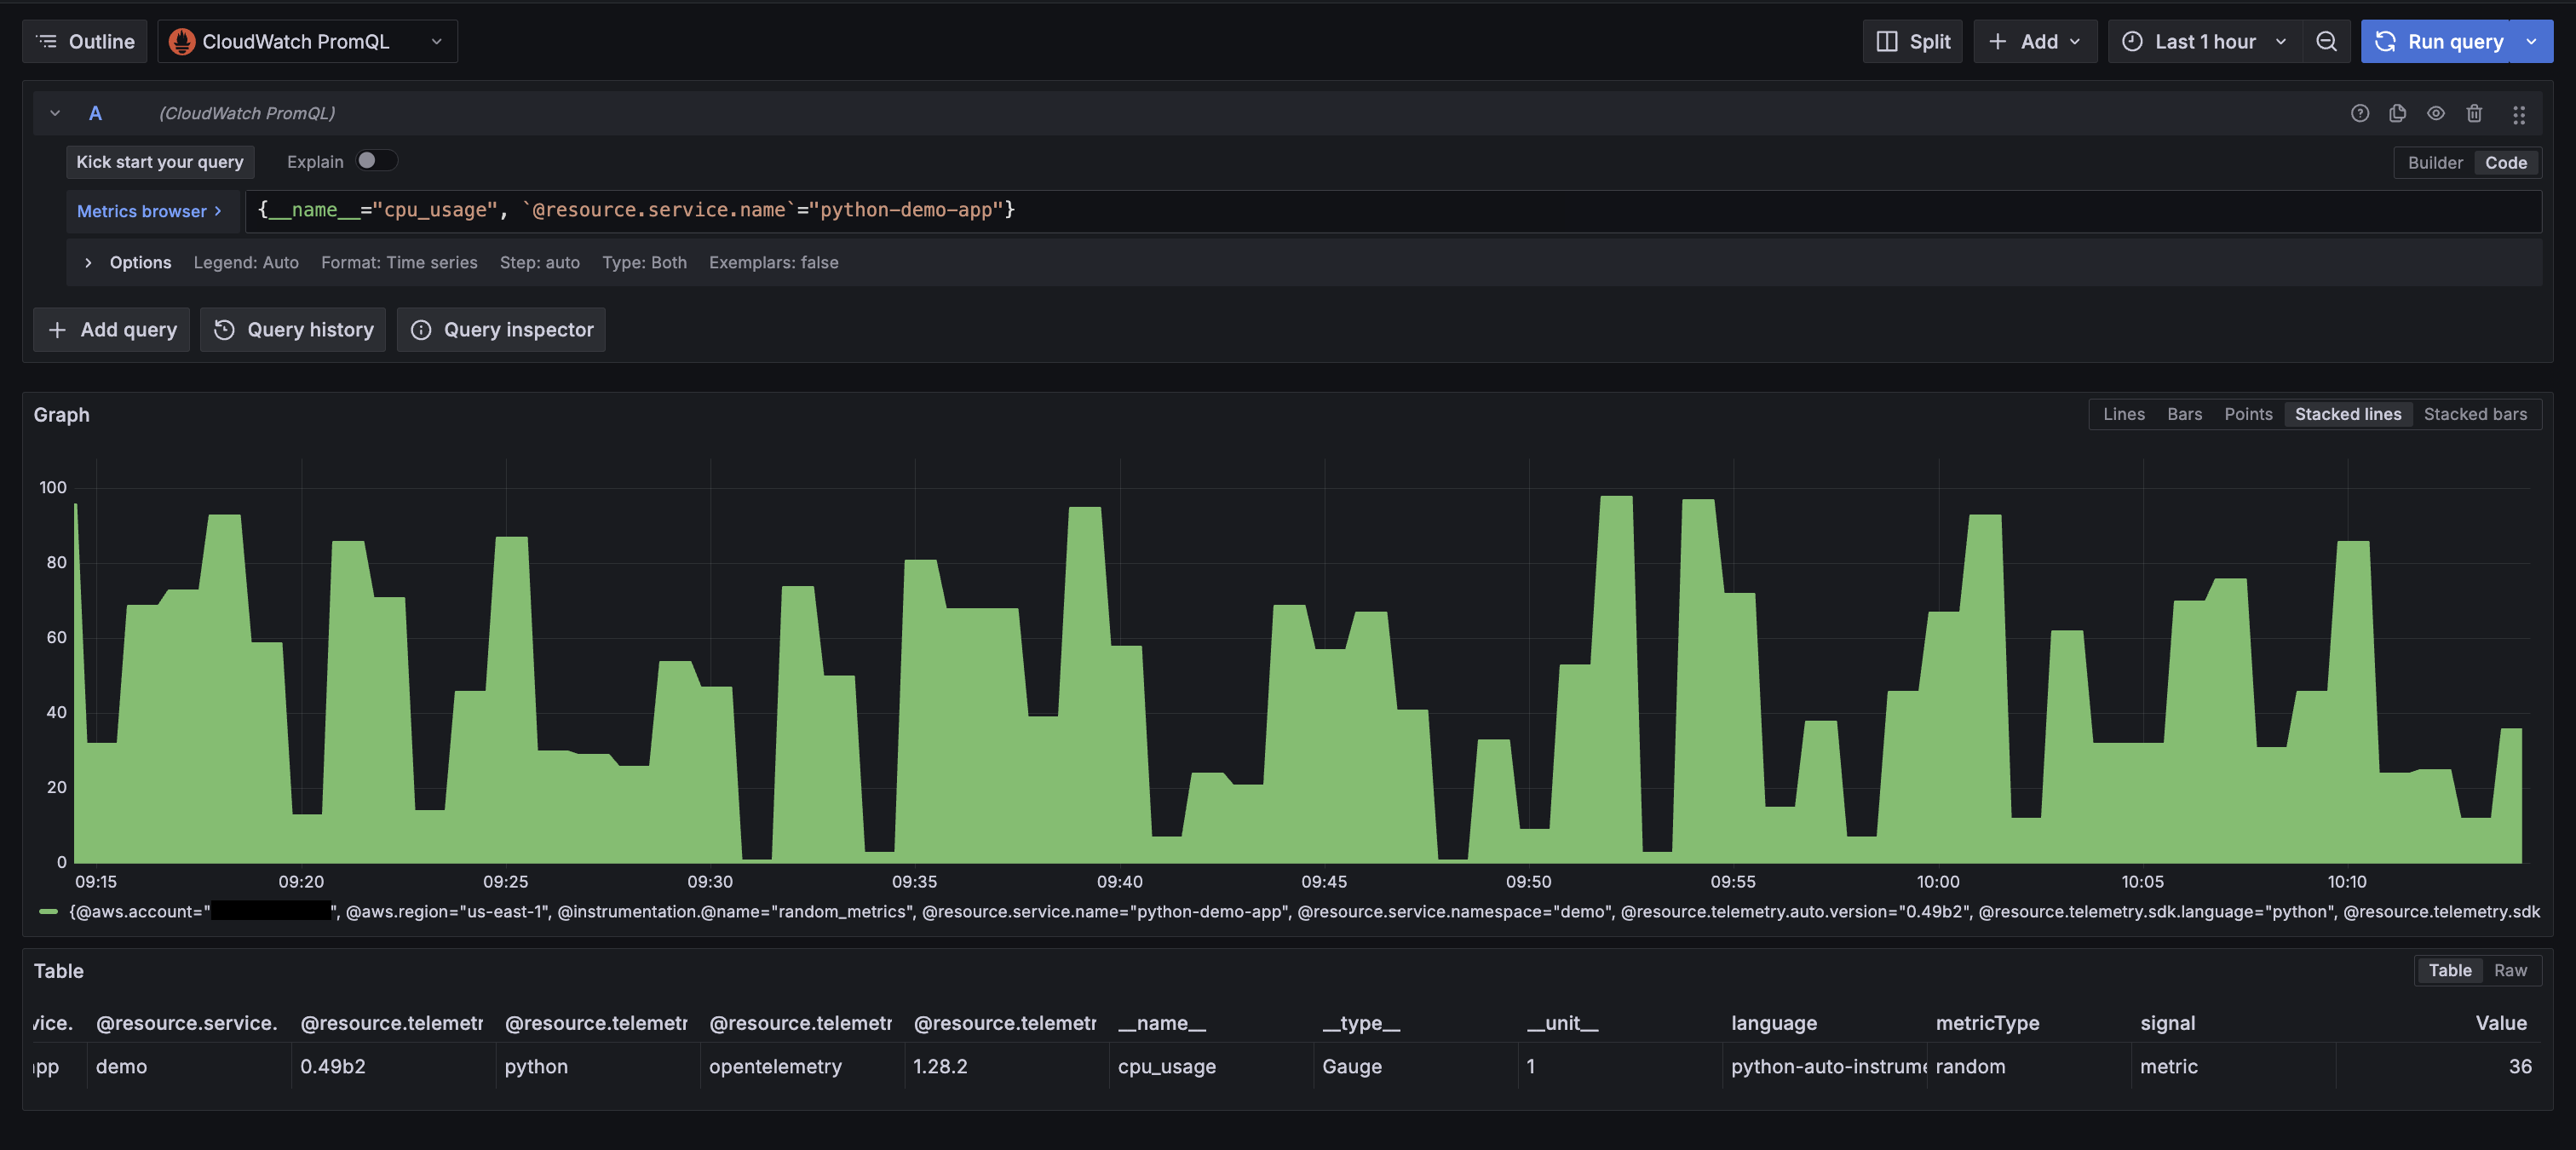
Figure 8: Showing all enriched labels from custom OTel instrumentation
Pricing
The OTLP ingestion capability and PromQL queries are available at no additional cost during the preview period. For current pricing details, see the Amazon CloudWatch Pricing page.
Amazon EKS and Amazon Managed Grafana resources used in this walkthrough are charged at standard rates. To avoid ongoing charges, follow the clean up in the following section after you finish the walkthrough.
Clean up
- Delete the sample application:
kubectl delete -f demo-app.yaml
- Remove the Amazon CloudWatch Observability add-on from your EKS cluster:
aws eks delete-addon \
 --cluster-name \
 --addon-name amazon-cloudwatch-observability
- Remove the Prometheus data source from your Grafana workspace (log in to the Grafana console, navigate to Data Sources, and delete the CloudWatch PromQL data source you configured).
- Delete the Amazon Managed Grafana workspace (only if created for this walkthrough):
aws grafana delete-workspace --workspace-id
- Delete the Amazon EKS cluster (only if created for this walkthrough):
aws eks delete-cluster --name
- Disable OTel enrichment (if no longer needed for your account):
# Disable OTel enrichment
aws cloudwatch stop-o-tel-enrichment

# Disable telemetry enrichment
aws observabilityadmin stop-telemetry-enrichment
- Detach the IAM policy if it was attached specifically for this walkthrough:
aws iam detach-role-policy \
 --role-name \
 --policy-arn arn:aws:iam::aws:policy/CloudWatchAgentServerPolicy
Conclusion
This post walked through native OpenTelemetry metrics ingestion in Amazon CloudWatch: enabling the enrichment layers, deploying Container Insights on Amazon EKS, sending custom application metrics with the OpenTelemetry SDK, querying everything with PromQL.
With this preview capability, you can consolidate your metrics pipeline into CloudWatch. High-cardinality metrics with extended label limits, PromQL queries, and automatic AWS resource enrichment work together so that infrastructure metrics, container metrics, and application metrics all flow through the same pipeline and carry the same AWS resource context. No separate backends, no exporters, no additional API calls to bring your AWS metrics into a unified view.
For more hands-on examples of application-level instrumentation with OpenTelemetry, explore the following resources:
- AWS Observability Best Practices Guide: patterns for instrumenting applications with OpenTelemetry SDKs
- One Observability Workshop: hands-on labs for metrics, traces, and logs on AWS
- AWS Observability Accelerator: CDK patterns and Terraform modules to automate telemetry collection and query
The preview is available at no additional cost in US East (N. Virginia), US West (Oregon), Europe (Ireland), Asia Pacific (Singapore), and Asia Pacific (Sydney). To get started, enable the enrichment layers in your account and deploy the CloudWatch Observability add-on on an Amazon EKS cluster.