AWS Cloud Operations Blog
Investigating Service Issues with Amazon CloudWatch Application Signals Custom Metrics
When a critical service fails, you need to know how much revenue you’re losing, not just that latency has increased. This post shows you how to integrate business metrics with CloudWatch Application Signals to see both technical performance and business impact in one unified view.
With CloudWatch Application Signals, you can view metrics, traces, and logs in a unified interface, helping you quickly identify problems across complex distributed systems. In this post, we’ll show how adding custom business metrics to Application Signals helps identify revenue impact during service disruptions – something infrastructure monitoring alone couldn’t reveal.
Business metrics that matter
While Application Signals automatically captures the RED metrics—Request Rate (invocations per minute), Errors (fault percentage), and Duration (response latency); the business logic generates valuable data that these standard observability metrics typically don’t capture. We’ve discovered that custom metrics connect technical performance data with crucial business insights that matter to stakeholders. For example, tracking order value gives immediate insight into revenue impact when CloudWatch Application Signals detects service issues.
Connecting these business metrics with Application Signals gives you a clearer picture of how technical issues affect the bottom line.
Key benefits of custom metrics in application signals
By integrating business metrics with technical data, custom metrics give you a clearer picture of how system performance affects your bottom line. Instead of guessing which system issues matter most, you see exactly how service degradations affect your bottom line.
When you integrate business context directly into your monitoring dashboards, your teams no longer waste time switching between tools to understand the real-world impact of technical problems. Custom metrics provide immediate business context alongside technical performance data, so when Application Signals detects a performance degradation, you see which customers are affected and how much revenue is at risk
Application Signals creates a unified view by connecting business metrics with technical performance data. Your operations team can work more efficiently by seeing all relevant data in one place. Instead of diagnosing problems in isolation, your team spends more time fixing the issues that directly impact your business.
Custom metrics show you the real business consequences of technical problems as they happen, making troubleshooting more effective. This visibility helps you prioritize fixes based on actual business criticality rather than technical severity alone. A minor database query slowdown becomes urgent when you see it’s blocking high-value customer transactions.
You can now track what directly impacts your business—hourly revenue, customer satisfaction scores, or transaction success rates—alongside system performance metrics. If sales numbers suddenly fall, it presents which service is causing the problem and respond accordingly.
Cost Considerations
When implementing custom metrics in Application Signals, your costs depend on the number and frequency of metrics you publish, plus the volume of trace and log data generated.
Start with essential business metrics and expand gradually. Use sampling for high-volume services to balance cost with visibility—you don’t need every transaction to spot trends and issues.
Review your metrics quarterly to remove unused ones and set appropriate data retention periods. Most troubleshooting needs recent data, so shorter retention works for high-volume metrics while keeping longer periods for critical business indicators.
Custom metrics integration with Application Signals
Integrating custom business metrics with Application Signals is straightforward. Once published to CloudWatch, they automatically appear alongside your technical performance data, creating a single view of both system health and business impact.
The following images of trace and application maps show a distributed architecture suggesting potential bottlenecks in service interactions.
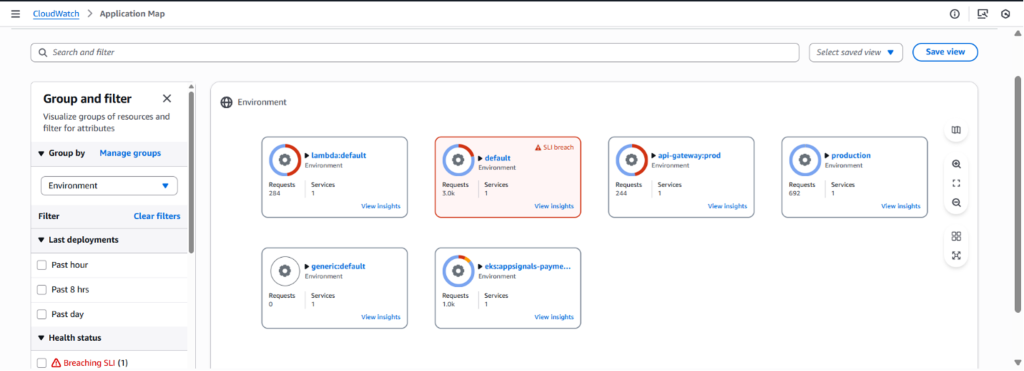
Figure 1: Trace data in CloudWatch Trace Map.
Application Map can show environment and related services in the same view.

Figure 2: CloudWatch Application Map – Environment view.
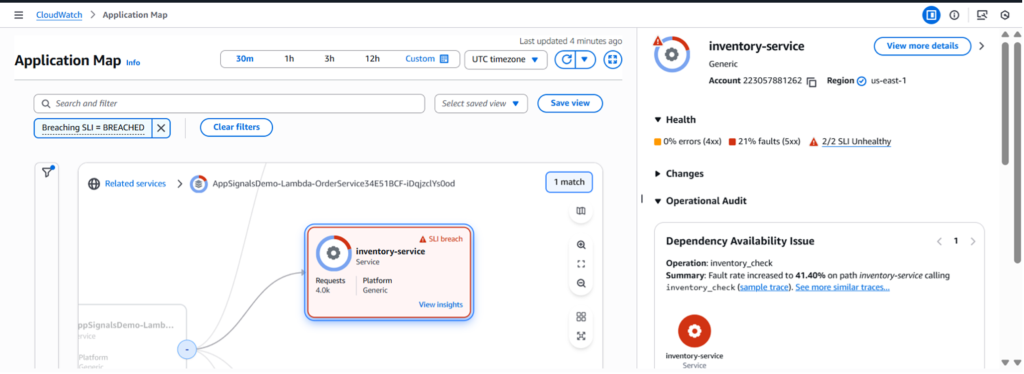
Figure 3: CloudWatch Application Map – Breached SLI – Insights
How custom metrics appear in Application Signals
In the CloudWatch console, Application Signals displays custom metrics alongside standard performance data. When you navigate to a service in the Application Signals dashboard, the Related Metrics section shows both infrastructure metrics (CPU, memory) and business metrics (order values, processing times) in a unified view.
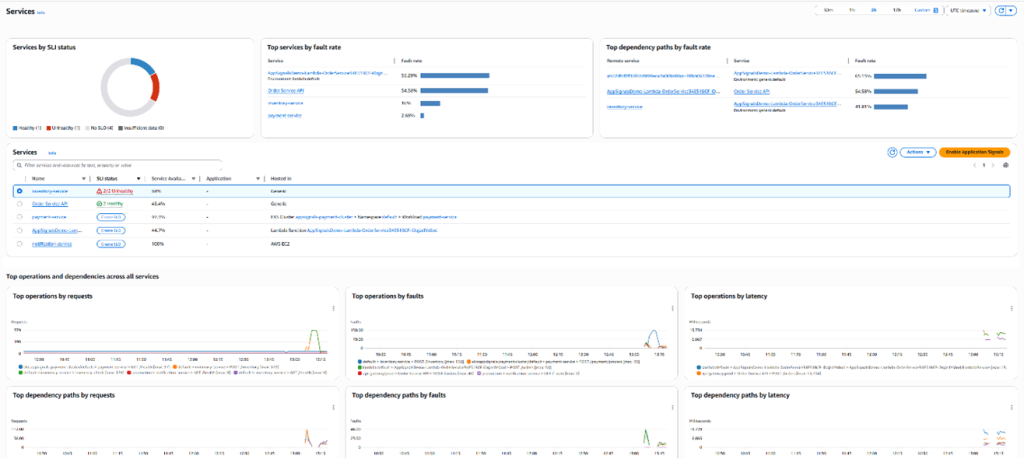
Figure 4: View of all services in Application Signals
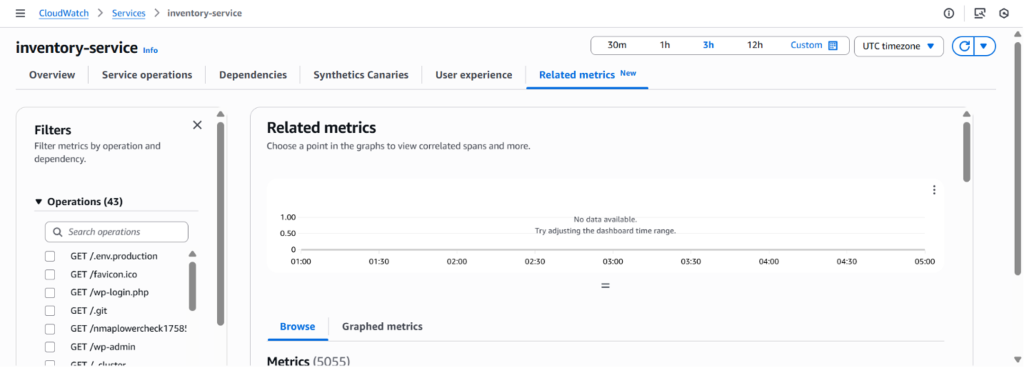
Figure 5: Related Metrics tab of Selected service in Application Signals
Custom metrics appear in the metric type filter, allowing you to focus on business-relevant data that provides context for technical performance issues.
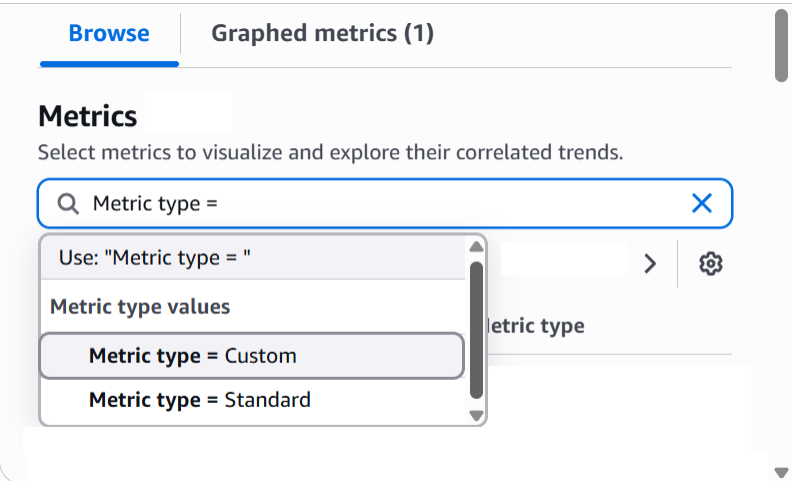
Figure 6: Custom metric filter in Related Metrics Tab
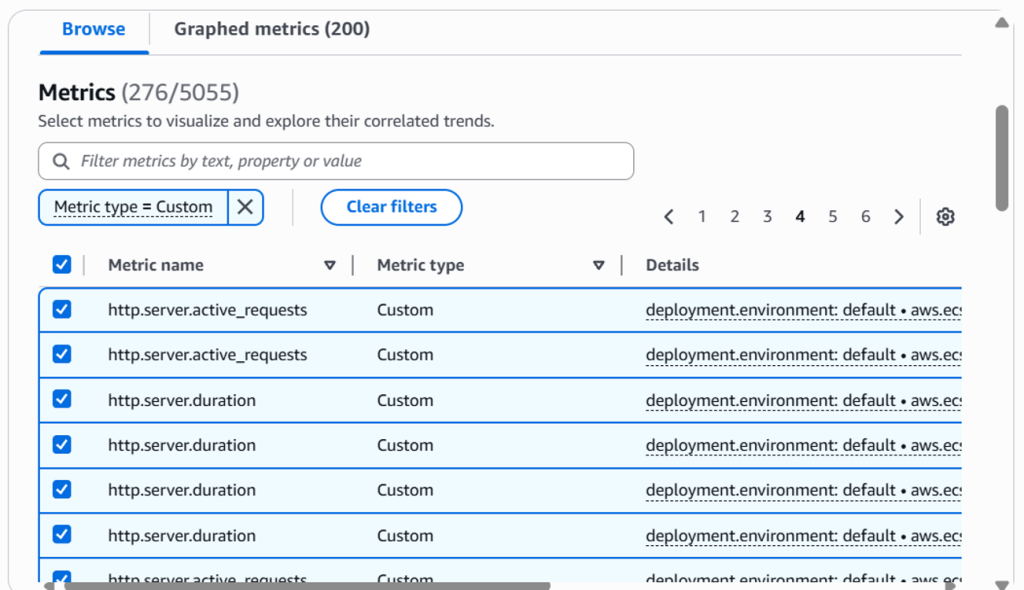
Figure 7: Custom metric results in Related Metrics Tab
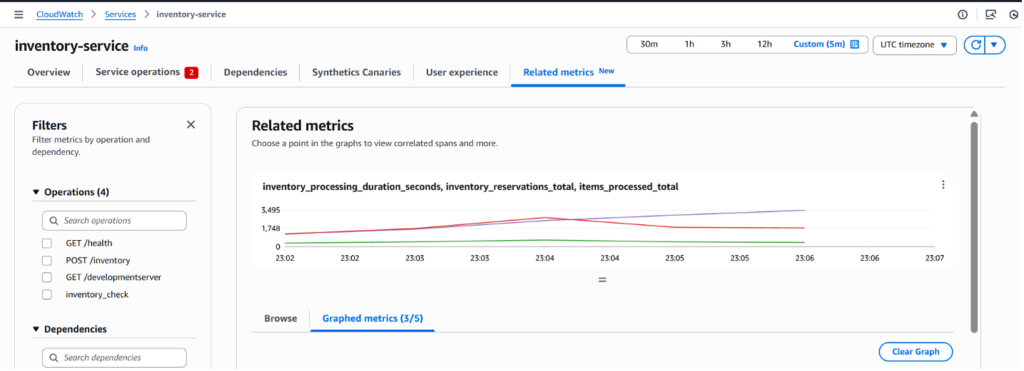
Figure 8: Related Metrics graph with Custom metric selected
Understanding the demo architecture: Multi-service e-commerce platform
Our demonstration uses an e-commerce platform spanning multiple AWS compute services, each publishing custom business metrics to Application Signals:
User → Amazon API Gateway → AWS Lambda (Orders) → Amazon RDS ← Amazon ECS (Inventory) → Amazon EKS (Payments) → Amazon EC2 (Notifications)
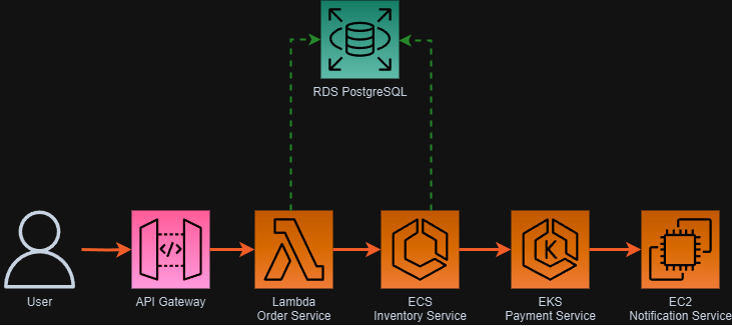
Figure 9: E-commerce platform architecture
Each service publishes custom metrics that provide business context alongside Application Signals’ automatic service monitoring.
Scenario 1: Lambda order processing – Business impact visibility
Order processing latency jumped to 35 seconds on our enterprise e-commerce platform. Orders worth $15,000-$20,000 were timing out, and enterprise customers expecting sub-second responses were calling support. Our ECS dashboards showed healthy services, but orders weren’t completing.
We instrumented the order pipeline to track order completion time, transaction value, queue depth, and processing success rate. Using the AWS SDK, we published these metrics to CloudWatch with dimensions matching our Application Signals service topology.
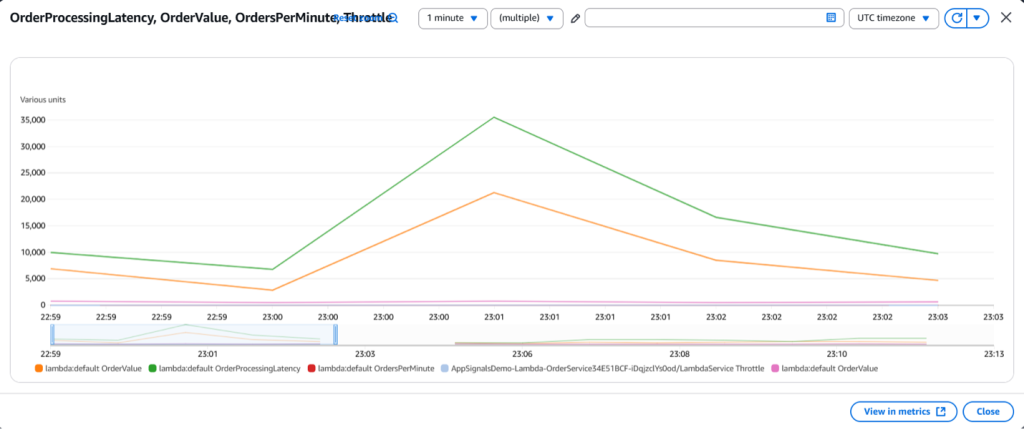
Figure 10.1: CloudWatch application signal – Lambda custom metric datapoints
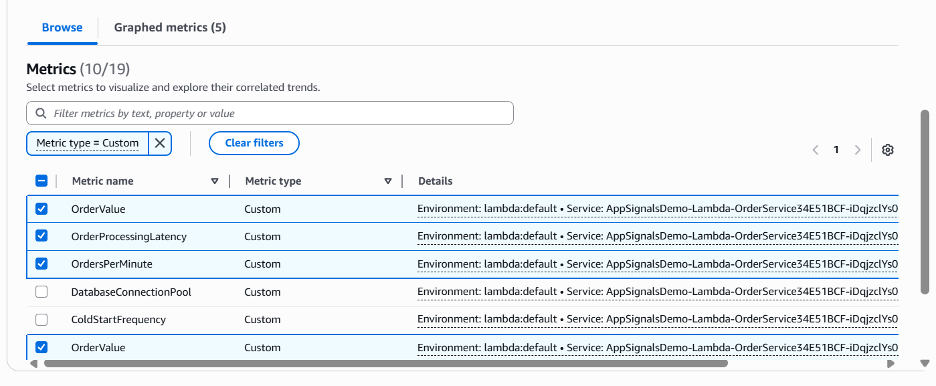
Figure 10.2: CloudWatch application signal – Selected lambda custom metrics
Application Signals showed the payment validation service was overwhelmed during high-volume periods, especially for transactions over $10,000 requiring enhanced fraud detection. The delays correlated with high-value orders during peak hours. We escalated to engineering leadership and optimized the fraud detection pipeline, implementing separate processing queues for enterprise orders.
Scenario 2: ECS inventory management – Operational excellence metrics
Our ECS inventory service processed about 2,000 items with a 2.5-second average processing time. Health checks passed, but we were losing sales. Standard container monitoring showed everything running normally.
After adding custom inventory metrics to CloudWatch, we found roughly 92,000 total stock items but only 53,000 available—about 15% availability. Nearly 500 active reservations were creating tracking complexity our ECS service couldn’t handle efficiently.
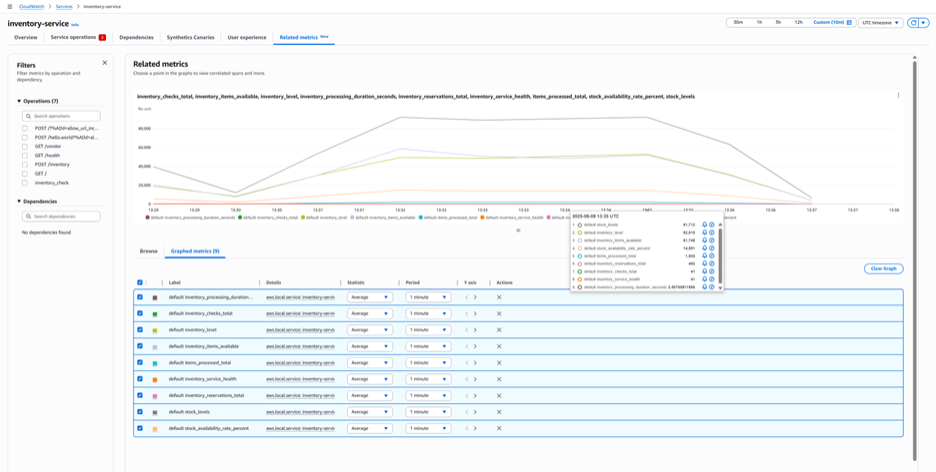
Figure 11: CloudWatch application signal – ECS custom metrics
The inventory service performed 41 checks while processing 2,000 items. This wasn’t a performance issue—we simply hadn’t provisioned enough capacity for the business volume. About 39,000 unavailable units meant lost sales, and the reservation backlog prevented accurate delivery estimates.
Using this integrated view of business and technical metrics, we scaled the ECS inventory service and restructured the reservation management system. Within a week, stock availability increased to over 70% and processing time dropped to under 1 second per item.
Scenario 3: EKS payment processing – Financial transaction monitoring
Customers abandoned $500 purchases mid-checkout, complaining about payment errors and timeouts. Support tickets surged, but our EKS monitoring showed healthy pods.
After adding payment success metrics, we discovered nearly 20% of transactions were failing. Payment processing took 11 seconds on average, and the success rate had dropped to 82%. At $500 per transaction, the 18% failure rate represented significant lost revenue.

Figure 12: CloudWatch application signal – EKS custom metrics
The fraud detection component took nearly 1 second per check, cascading through multiple validation steps to create the 11-second total latency. Elevated fraud scores triggered additional security checks, but our payment infrastructure couldn’t handle the processing load—the service health score had dropped to 25%.
We identified customers experiencing double-digit payment delays and an 18% transaction failure rate. Engineering prioritized optimizing the fraud detection pipeline and scaling the payment processing infrastructure.
Scenario 4: EC2 notification service – Customer communication metrics
Customer support received calls about missing order confirmations. The pattern suggested a broader communication problem than our EC2 monitoring revealed.
We added notification delivery metrics to CloudWatch. Application Signals showed only 171 notifications processing despite thousands of customer actions that should have triggered emails.
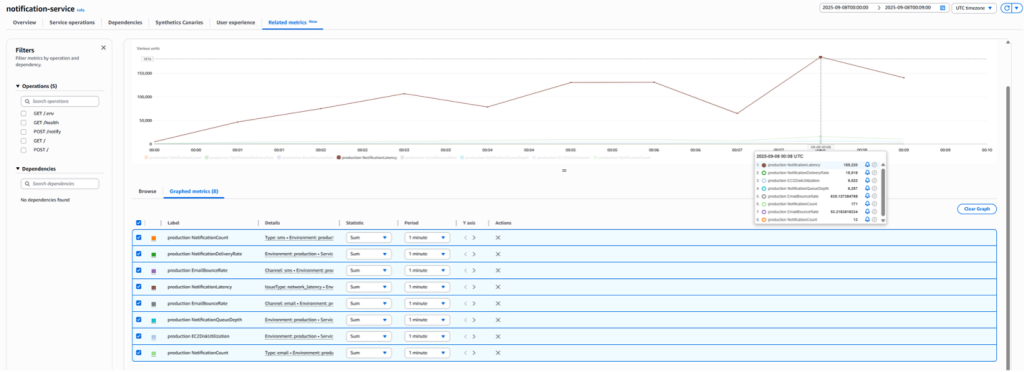
Figure 13: CloudWatch application signal – EC2 Custom metrics
Queue metrics showed over 6,000 messages backlogged. Processing time had reached 185 seconds per notification—over 3 minutes per email. Disk utilization metrics revealed storage bottlenecks throttling the communication pipeline.
Email bounce rates had increased by 635%. Order confirmations, payment receipts, and account updates weren’t reaching customers. We scaled the EC2 notification service and optimized disk I/O to clear the backlog.
Application Signals connected these scattered symptoms into a clear crisis: customers weren’t receiving essential communications, support tickets were surging, and our notification service was on the verge of complete failure
Implementing Custom Metrics in your Applications
Choosing the right business metrics
The most effective custom metrics connect technical performance to business outcomes. High-impact metrics include:
- Revenue metrics: Transaction values, order completion rates, payment success percentages
- Customer experience: User-perceived latency, abandonment rates, communication delivery success
- Operational efficiency: Queue depths, inventory turnover rates, fraud detection timing
- Service capacity: Items processed per minute, reservation management, notification throughput
How custom metrics integrate with Application Signals
Custom metrics use CloudWatch’s existing infrastructure to flow into Application Signals. Your applications publish business data using the same AWS SDK calls that handle technical metrics, with business-relevant namespaces and dimensions. Application Signals correlates these with service topology to create unified dashboards showing both technical status and business impact.
Label your metrics carefully to ensure they appear in the right service context. Use dimension names that match Application Signals’ service discovery conventions. Add business-specific labels like ‘premium_customer‘ or ‘high_value_transaction‘ for filtering by business criteria. Include technical dimensions like ‘processing_queue’ or ‘order_size_range’ to pinpoint problem locations.
To integrate custom metrics with Application Signals, configure specific OpenTelemetry resource attributes that allow Application Signals to recognize and correlate your business metrics with service topology. Key attributes include service.name, deployment.environment, and aws.application_signals.metric_resource_keys.
For complete implementation details, platform-specific configuration examples (EKS, ECS, Lambda, EC2), and code samples, see Custom metrics with Application Signals in the AWS documentation.
Tracing business impact across services
Application Signals correlates your custom metrics with distributed traces, showing how business impact flows through your service architecture. A spike in high-value order failures, for example, can be traced through payment processing, inventory checks, and notification delivery to identify the bottleneck.
Conclusion
When order values and transaction success rates were added to the Application Signals dashboards, it finally explained the slowdowns in terms of lost revenue. This approach helped the team prioritize fixes based on actual business impact rather than technical severity alone. For example, see which service degradations were affecting the highest-value transactions, allowing respond first to issues directly impacting the bottom line.
It portrayed real value when Application Signals merged our payment success rates with latency metrics. Suddenly, it was shown why customers were abandoning purchases during checkout. This approach has helped us move from simply fixing problems to improving business outcomes.
Start by adding metrics that directly affect revenue, such as order value or checkout completion rate, to your Application Signals dashboard.
Get Started Today
- Enable Application Signals in your AWS Console
- Application Signals on Lambda
- Application Signals on EKS
- Application Signals on ECS
- Application Signals on EC2
- Custom Metrics with Application Signals
- Try the Application Signals workshop
Learn More