AWS Cloud Operations Blog
Prometheus MCP Server: AI-Driven Monitoring Intelligence for AWS Users
We recently launched the open source Prometheus Model Context Protocol (MCP) server for Amazon Managed Service for Prometheus. This new capability enables artificial intelligence (AI) code assistants such as Amazon Q Developer CLI, Cline, and Cursor to interact with your Prometheus monitoring infrastructure through natural language queries. The MCP server provides AI assistants with contextual monitoring data and enables them to execute PromQL queries without requiring deep expertise in query languages.
As a result, developers and operations teams can receive tailored monitoring insights throughout the entire application lifecycle, improving their observability and incident response processes.
Large Language Models (LLMs) have revolutionized the way developers write code, and their capabilities are being expanded by the Model Context Protocol (MCP) server. While LLMs excel at providing general coding assistance based on their training data, the MCP server extends their capabilities by enabling real-time access to monitoring tools and data sources, including AWS infrastructure monitoring.
The Prometheus MCP server provides AI code assistants with monitoring query tools and up-to-date, contextual information about your Amazon Managed Service for Prometheus workspaces. This allows code assistants to provide contextual guidance throughout the monitoring lifecycle, from initial setup through production optimization and incident response.
Integrating the Prometheus MCP server into your development workflow provides enhancements across various phases of application monitoring.
During the getting started phase, it offers guided workspace discovery and connection setup. In the monitoring phase, it reduces the PromQL learning curve by providing natural language interfaces for metric queries and analysis. For debugging and troubleshooting, the Prometheus MCP server provides automated query translation and instant access to monitoring data.
Features
The Prometheus MCP server provides several MCP tools, each of which can be invoked by AI assistants to interact with Amazon Managed Service for Prometheus. The tools provided by the Prometheus MCP server can be broken down into three categories:
1) Workspace Management
Discover and connect to your Amazon Managed Service for Prometheus workspaces across regions:
- GetAvailableWorkspaces – List all available Prometheus workspaces in specified regions
- GetServerInfo – Retrieve server configuration details and connection status
2) Metrics Discovery and Querying
Execute monitoring queries and discover available metrics without complex PromQL knowledge:
- ListMetrics – Retrieve all available metric names from your Prometheus workspace
- ExecuteQuery – Execute instant PromQL queries against Prometheus with natural language translation
- ExecuteRangeQuery – Execute PromQL queries over time ranges for trend analysis
3) Intelligent Query Translation
Transform natural language questions into optimized PromQL queries:
- Natural Language Interface: Ask questions like “What’s the current CPU usage across our application pods?”
- Automatic Query Optimization: AI selects appropriate metrics, aggregation functions, and time windows
- Context-Aware Filtering: Intelligent filtering based on your infrastructure context
Walkthrough
To demonstrate the capabilities of the Prometheus MCP server, the following sections walk through example scenarios.
Monitoring Infrastructure Performance
In this section we demonstrate how the Prometheus MCP server accelerates troubleshooting of AWS infrastructure. For this walkthrough, we’ll use Amazon Q Developer CLI to interact with our monitoring data through natural language queries.
Follow the Prometheus MCP Server documentation to install the prerequisites including IAM permissions for Amazon Managed Service for Prometheus access.
Prerequisites
Before getting started, ensure you have:
AWS Requirements:
- AWS account with appropriate permissions
- IAM permissions for Amazon Managed Service for Prometheus access
- At least one Amazon Managed Service for Prometheus workspace configured
System Requirements:
- macOS or Linux operating system
- Python 3.12 or higher
- AWS CLI configured with valid credentials
Tools:
- Amazon Q Developer CLI
- uv utility from Astral
Set up the Amazon Q Developer CLI
macOS and Linux:
- Install Amazon Q Developer CLI on your system
- Install the uv utility from Astral or the GitHub README
- Use the uv utility to install Python version 3.12
uv python install 3.12Windows:
- Install Amazon Q Developer CLI on your system
- Install Python 3.12 from python.org or Microsoft Store
- Install uv utility:
pip install uv- Verify installation:
uv python install 3.12Configuring MCP Servers
To configure Amazon Q Developer CLI to use the Prometheus MCP server, add the following to your ~/.aws/amazonq/mcp.json
{
  "mcpServers": {
    "prometheus": {
      "command": "uvx",
      "args": [
        "awslabs.prometheus-mcp-server@latest"
      ],
      "env": {
        "FASTMCP_LOG_LEVEL": "DEBUG"
      }
    }
  }
}
When the CLI loads, you can use the “/tools” command to see which tools have been added:
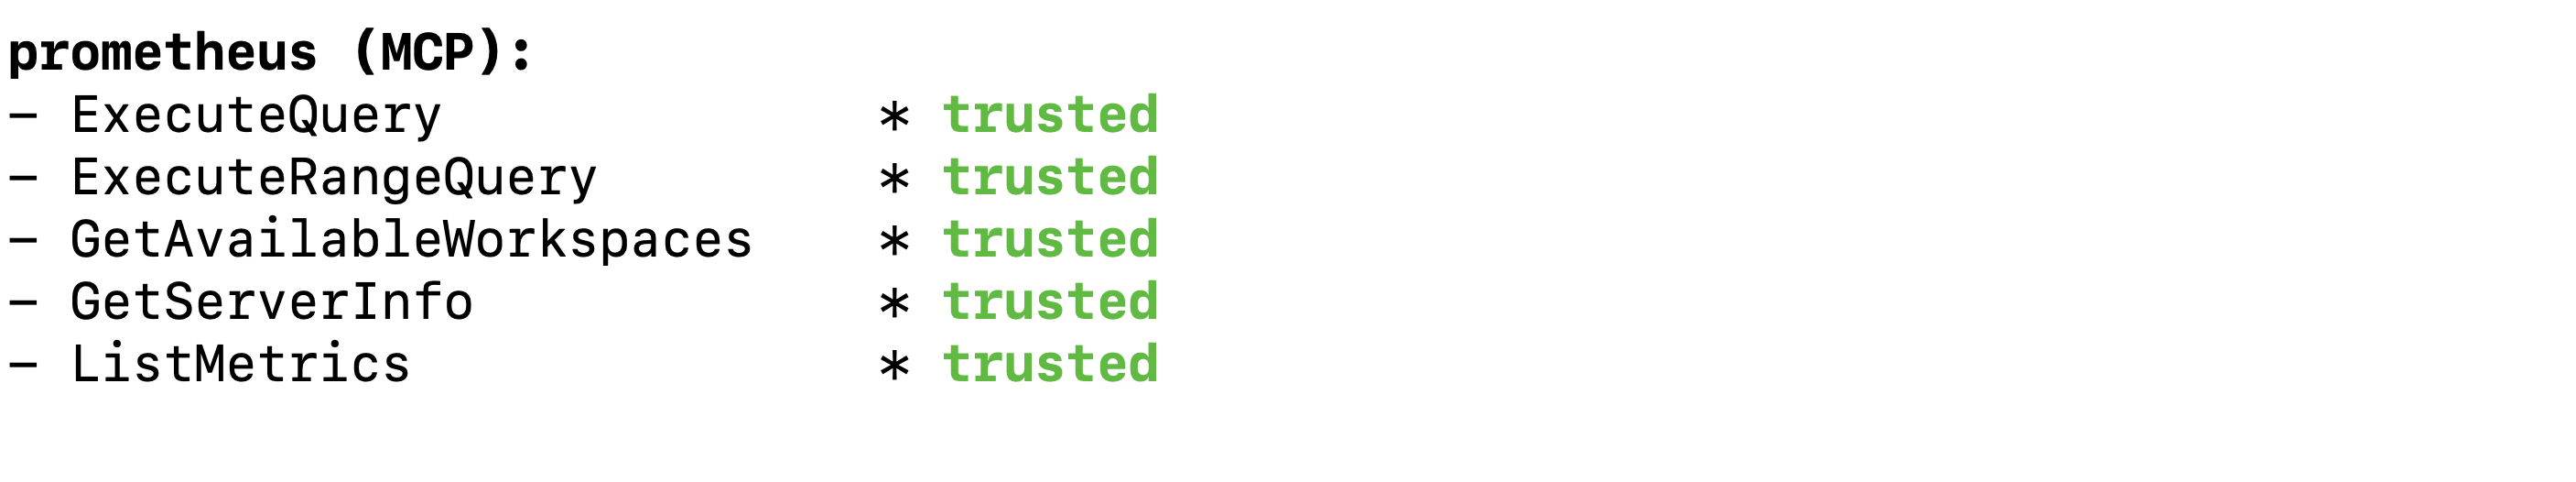
Figure 1: Amazon Q Developer CLI displaying available MCP tools including GetAvailableWorkspaces, ExecuteQuery, ExecuteRangeQuery, ListMetrics, and GetServerInfo
Real-world Demo Scenarios
Scenario 1: Environment Discovery
Prompt: “What’s our current monitoring setup?”
Amazon Q Developer CLI uses the Prometheus MCP server’s “get_server_info” tool to retrieve workspace details, region, and connection status, as shown in the following response:
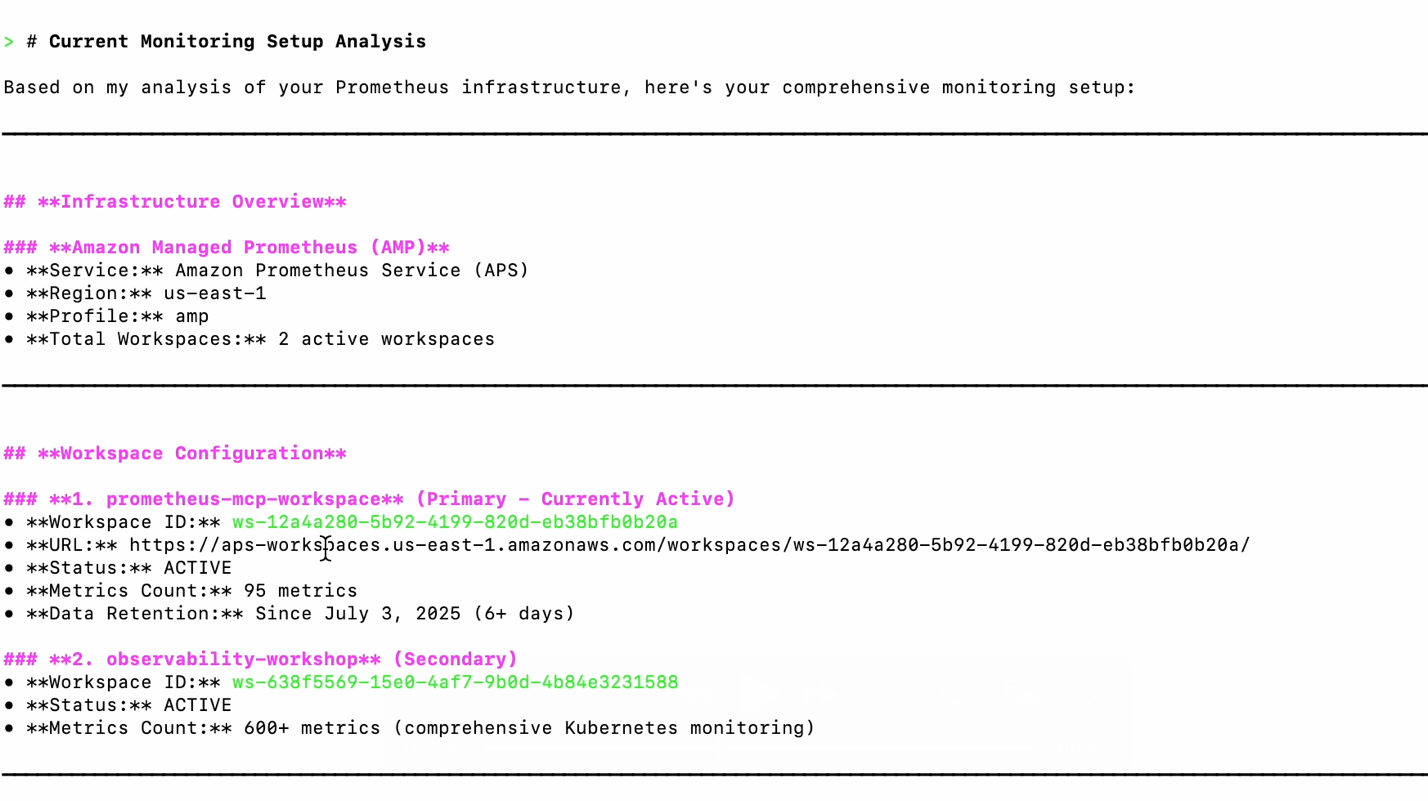
Figure 2: Output showing Prometheus workspace details with workspace ID ws-abc123, region us-east-1, and active status
Prompt: “What metrics are available in our system?”
Amazon Q Developer CLI uses the “list_metrics” tool to discover available monitoring data:
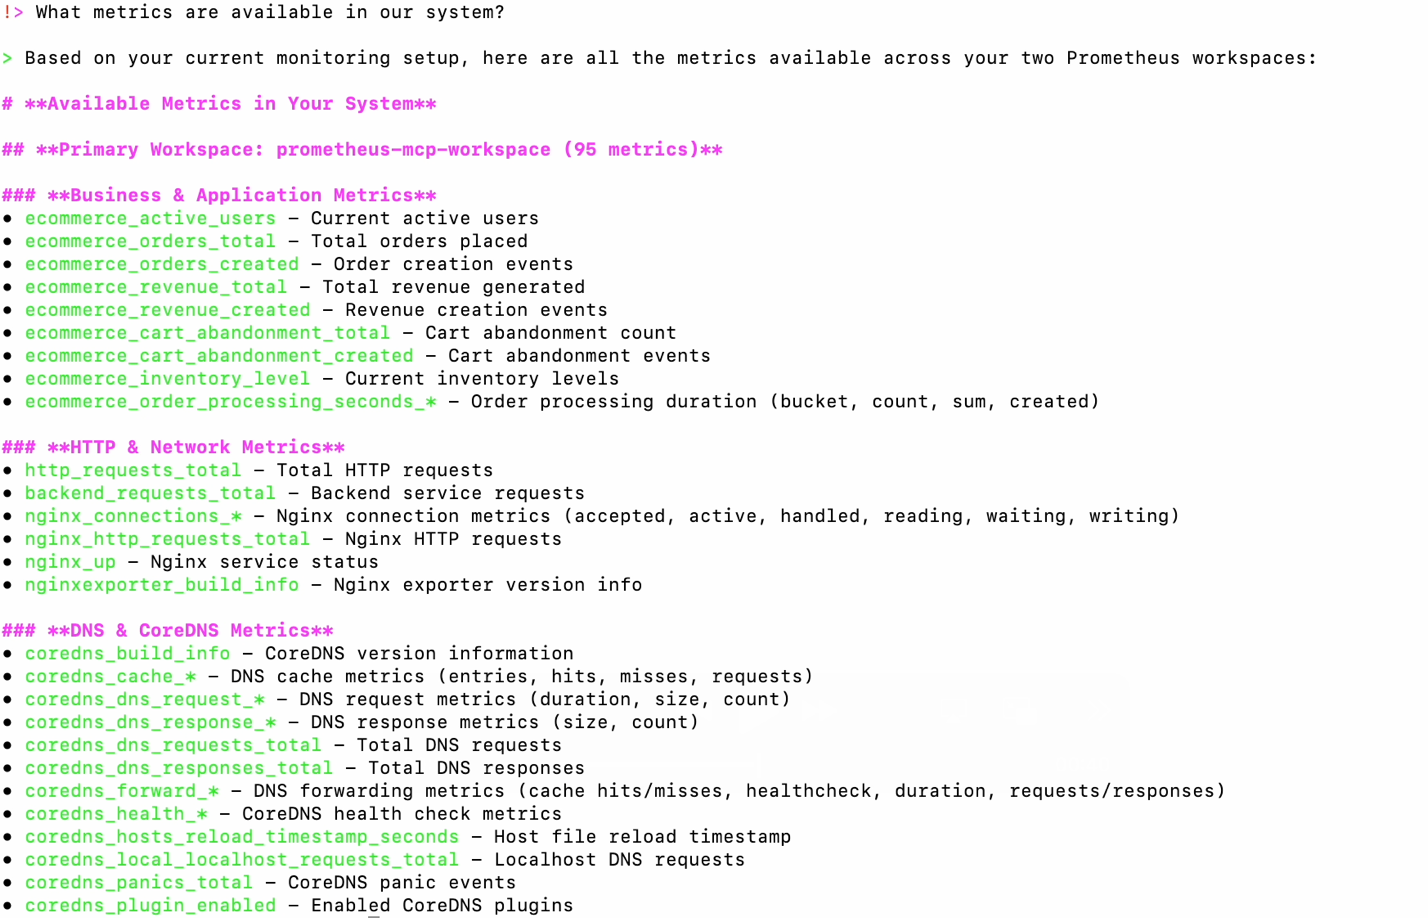
Figure 3: displaying list_metrics tool output showing available Prometheus metrics including container_cpu_usage_seconds_total, http_requests_total, memory_usage_bytes, and other system metrics in alphabetical order
Scenario 2: Performance Monitoring
Prompt: “What’s the current CPU usage across our application pods in the last hour?”
Amazon Q Developer CLI uses the “execute_range_query” tool, automatically translating this to the appropriate PromQL query “rate(container_cpu_usage_seconds_total[5m])” and presenting time series data in a human-readable format, as shown in the following figure:
![Figure4: Graph visualization showing CPU usage time series data from execute_range_query with rate(container_cpu_usage_seconds_total[5m]) displaying usage patterns across application pods over the last hour with values ranging from 0.2 to 0.8](https://d2908q01vomqb2.cloudfront.net/972a67c48192728a34979d9a35164c1295401b71/2025/11/21/06_cpu_usage_application_pods.png)
Figure4: Graph visualization showing CPU usage time series data from execute_range_query with rate(container_cpu_usage_seconds_total[5m]) displaying usage patterns across application pods over the last hour with values ranging from 0.2 to 0.8
Behind the scenes, Amazon Q Developer CLI constructs queries for both request rates and error rates, filtering for HTTP 4xx and 5xx status codes, providing a comprehensive view of service health.
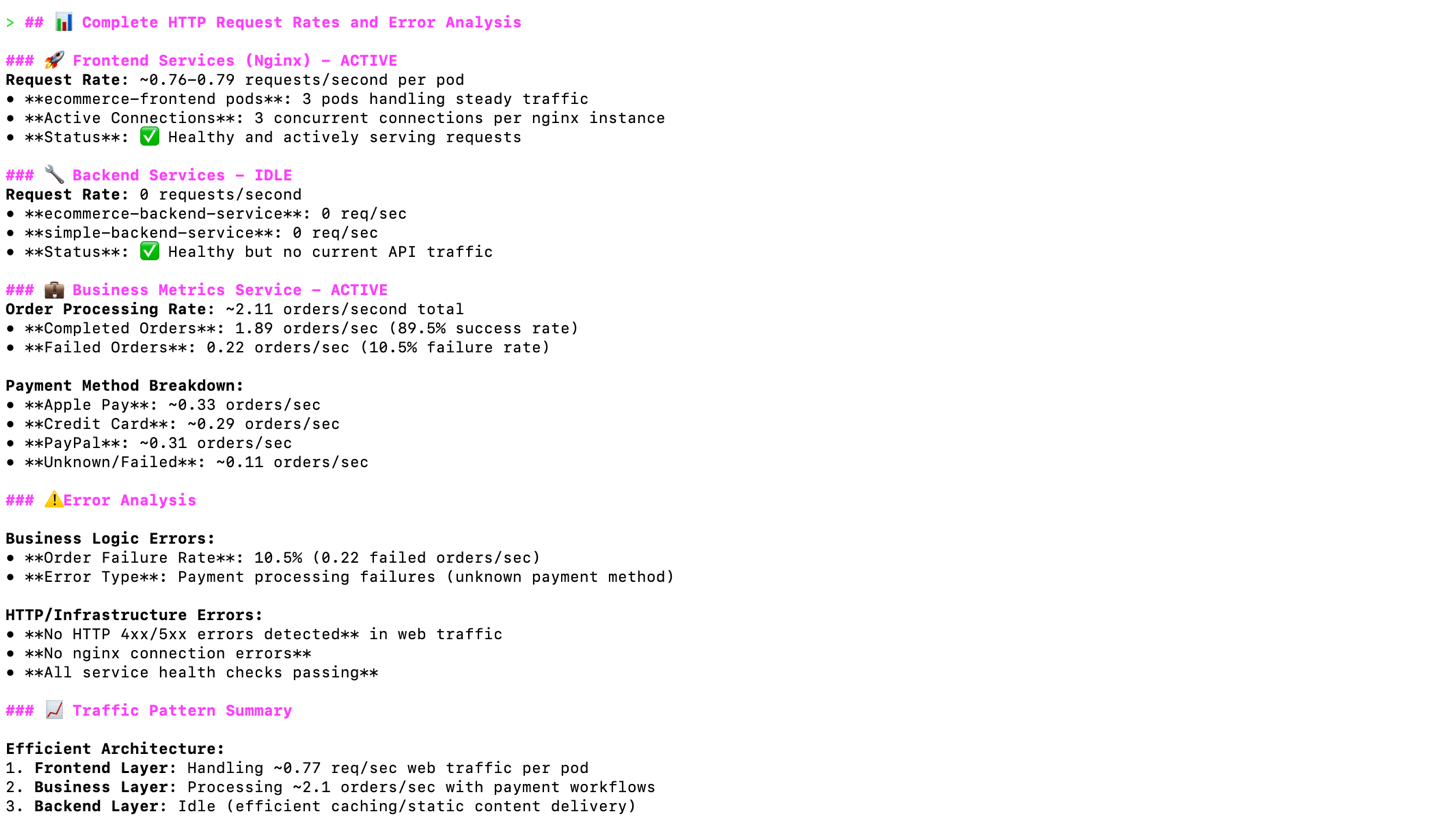
Figure5: Terminal output showing HTTP request rates and error analysis with metrics for 2xx, 4xx, and 5xx status codes, displaying request volume and error percentages for service health assessment
Scenario 3: Incident Response
Prompt: “Are there any issues with our services right now?”
Amazon Q Developer CLI uses multiple Prometheus MCP server tools to assess current system health, as shown in the following figure:
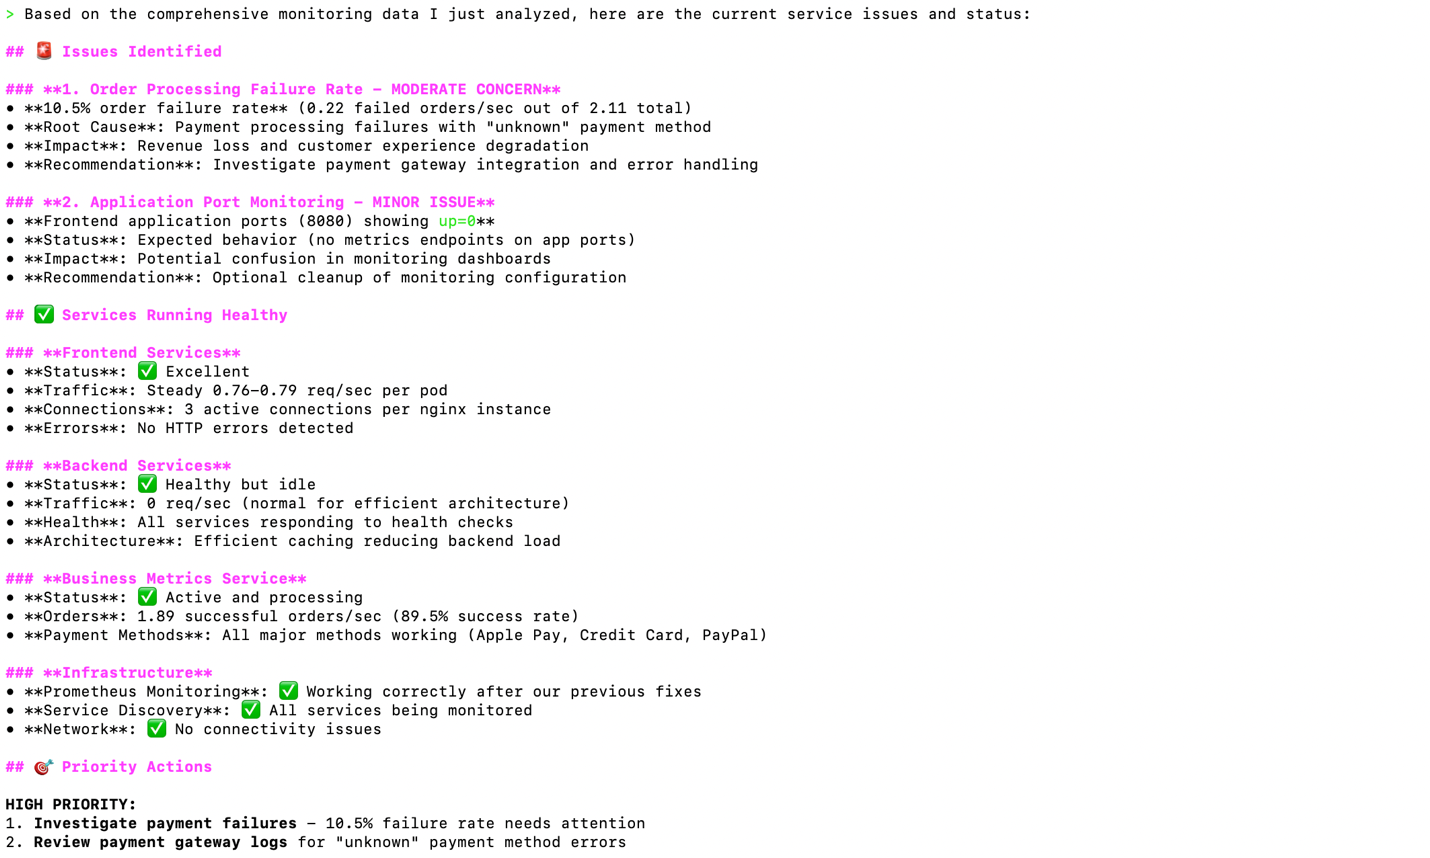
Figure 6: Multi-panel dashboard showing system health assessment with service status indicators, memory usage graphs, CPU utilization metrics, and alert status displaying overall infrastructure health
Amazon Q Developer CLI analyzes memory usage patterns over time and identifies potential issues:
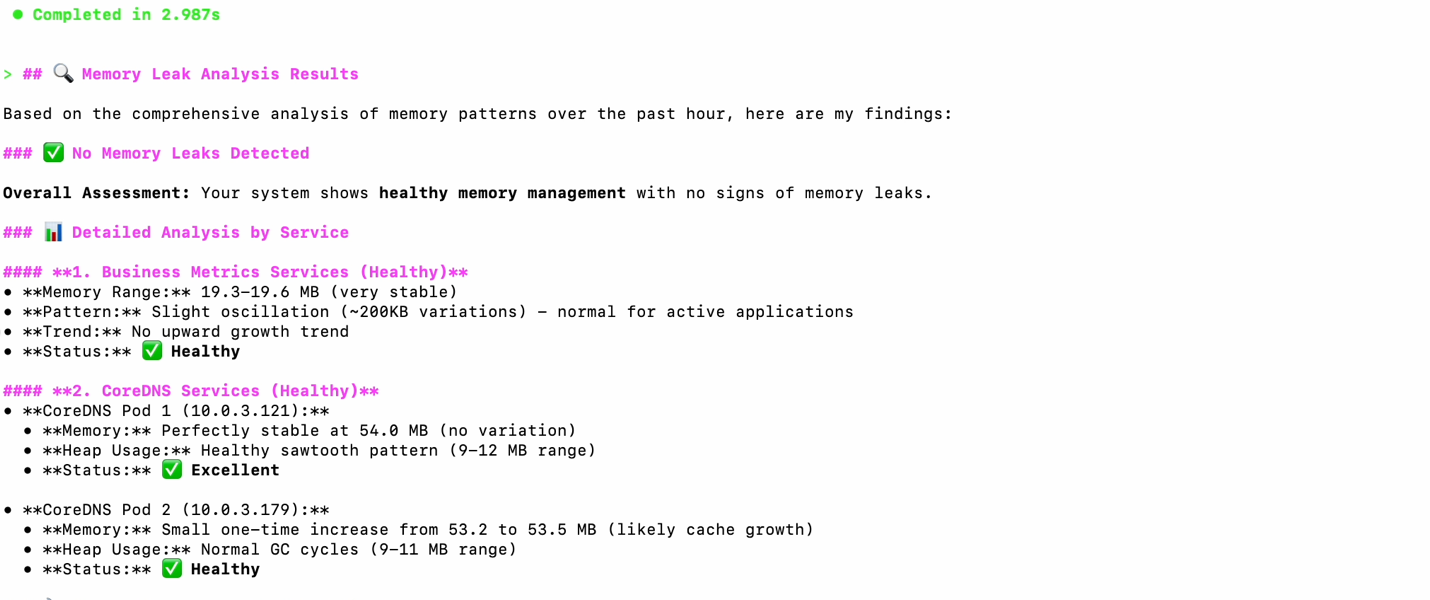
Figure 7: Time series graph showing memory usage patterns over 24 hours with execute_range_query results highlighting potential memory leak in application containers with steadily increasing memory consumption
Troubleshooting Infrastructure Issues
Another area where the Prometheus MCP server provides valuable context is identifying performance bottlenecks and system anomalies.
Prompt: “Show me our current resource utilization.”
Amazon Q Developer CLI uses the Prometheus MCP server to gather comprehensive resource metrics, as shown in the following figure:
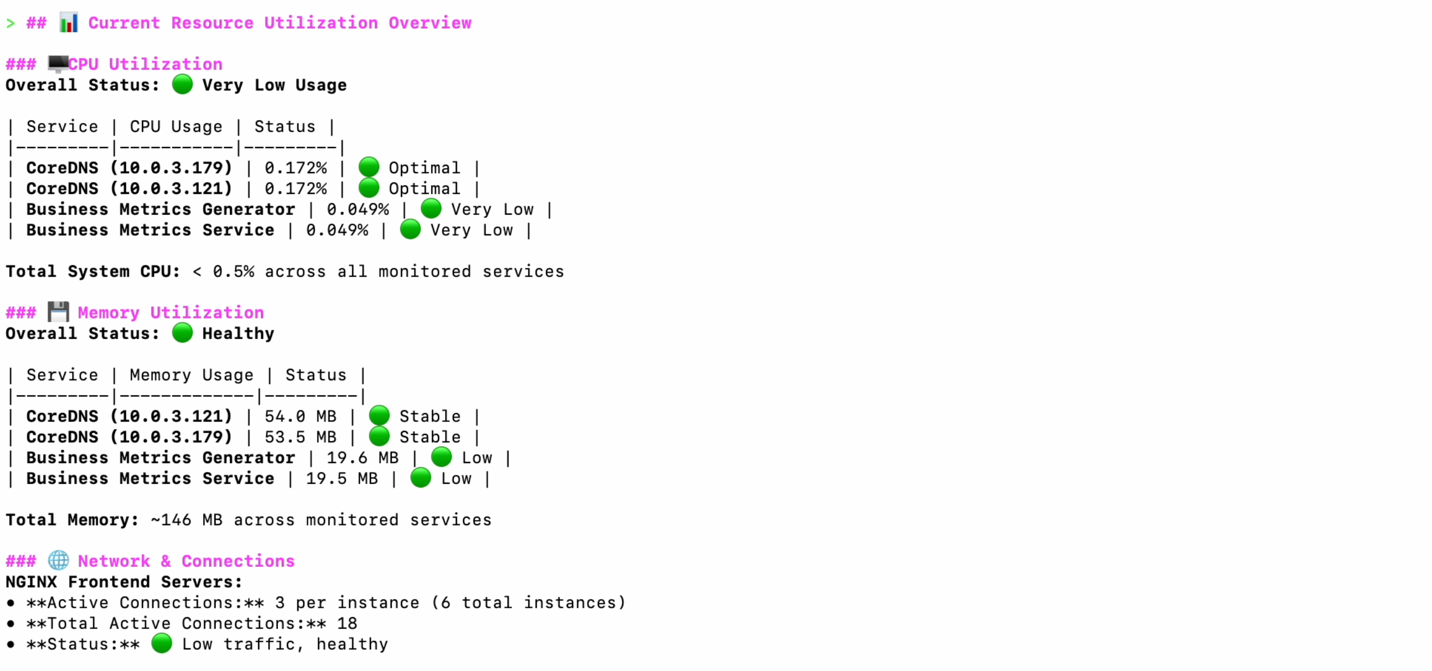
Figure 8: Comprehensive resource utilization dashboard showing CPU, memory, disk, and network metrics across infrastructure components with current usage percentages and capacity indicators
Prompt: “Are there any trends I should be worried about?”
Amazon Q Developer CLI analyzes historical data to identify concerning patterns:
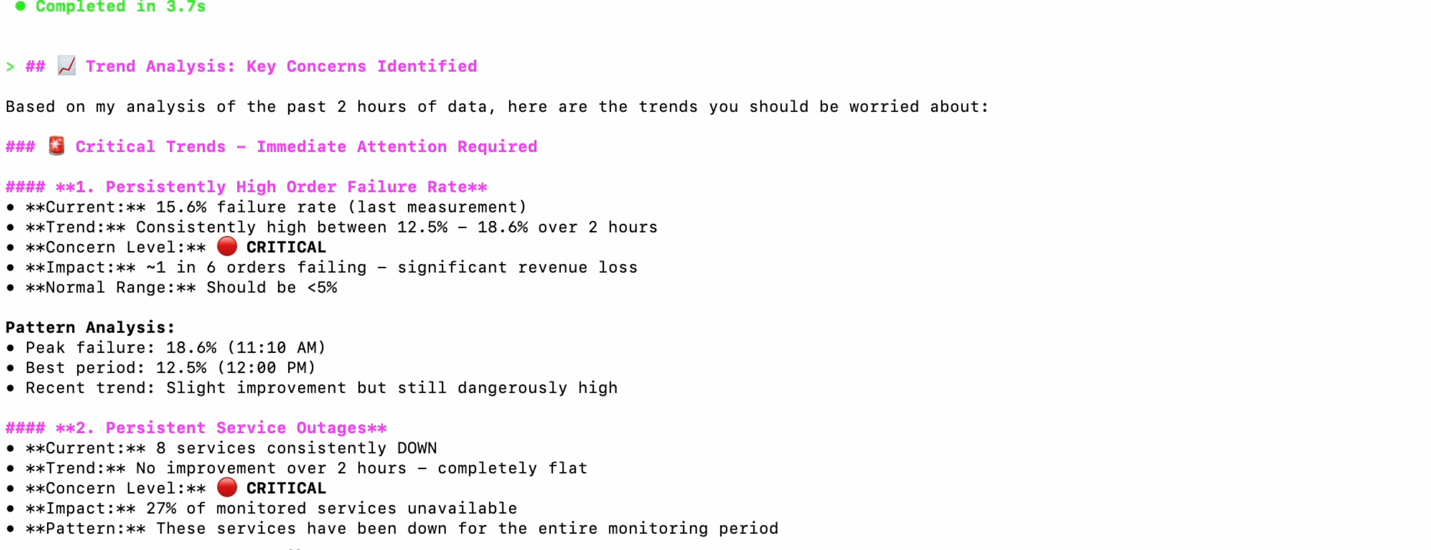
Figure 9: Historical trend analysis chart displaying concerning patterns in system metrics over the past week, highlighting increasing error rates and resource consumption trends requiring attention
Advanced Use Cases
Business Intelligence Integration
Prompt: “How many orders are we processing today?”
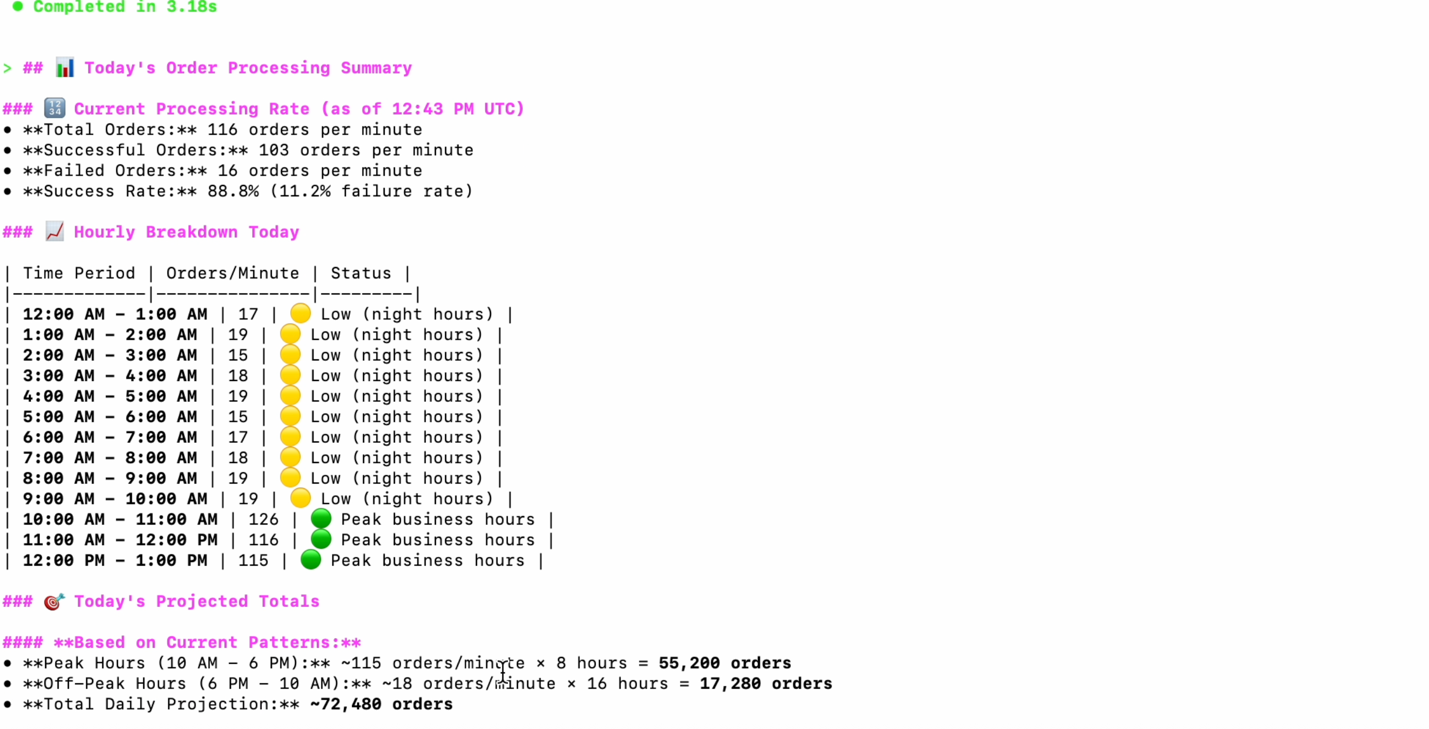
Figure 10: Business metrics dashboard showing order processing statistics with daily transaction volumes, success rates, and performance indicators derived from Prometheus business metrics
Capacity Planning
Prompt: “Do we need to scale our infrastructure?”
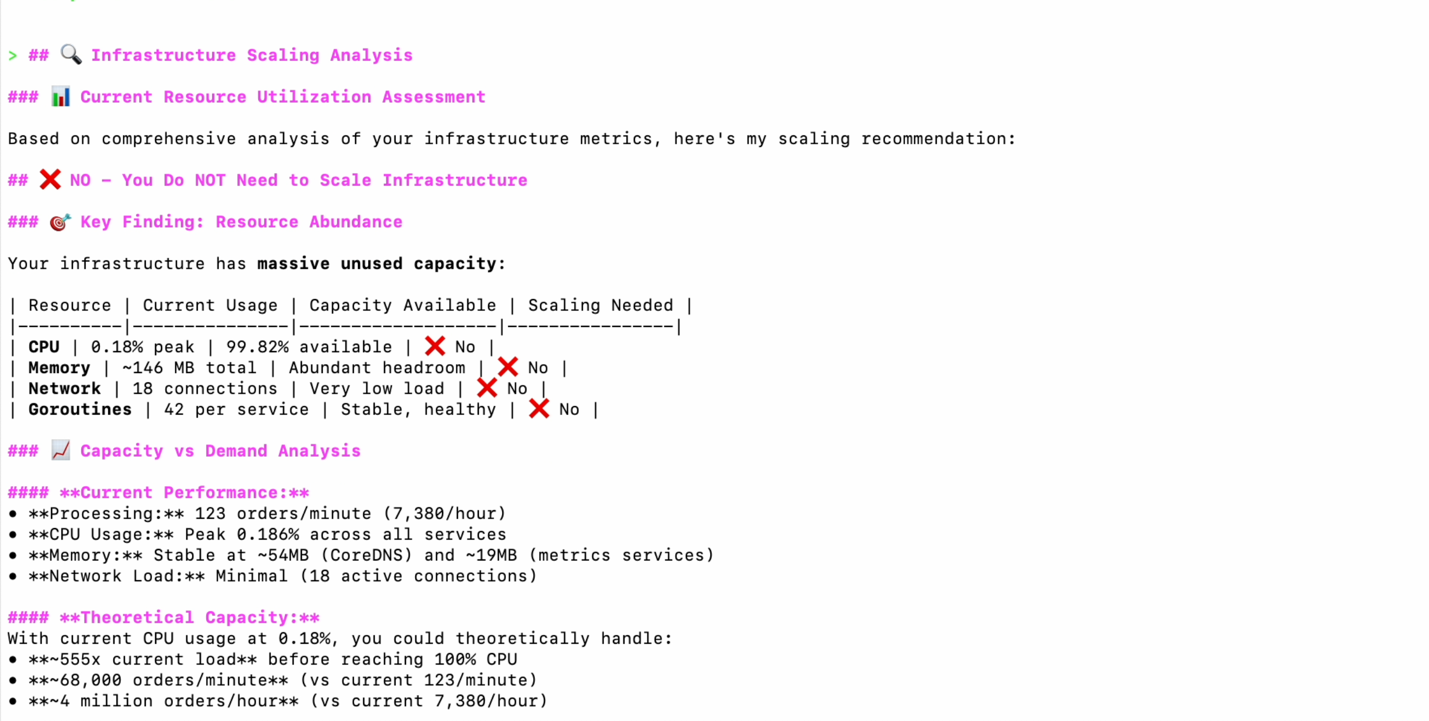
Figure 11: Infrastructure scaling analysis showing current resource utilization trends, projected growth patterns, and capacity recommendations with suggested scaling actions for optimal performance
Key Benefits
The Prometheus MCP server provides several advantages:
- Zero Learning Curve: Start monitoring immediately without PromQL knowledge
- Faster Incident Response: Get answers in seconds, not minutes
- Better Team Collaboration: Bridge the gap between business and technical teams
- Cost-Effective: Minimal additional cost with significant operational savings
- AWS-Native: Built specifically for Amazon Managed Service for Prometheus
Cleanup
When you’re finished with the walkthrough:
- Remove MCP Configuration:
Remove or comment out the Prometheus MCP server from~/.aws/amazonq/mcp.json - Uninstall Tools (Optional):
- Uninstall Amazon Q Developer CLI if no longer needed
- Remove uv utility:
pip uninstall uv(if installed via pip) - Remove Python 3.12 if installed only for this demo:
uv python uninstall 3.12
Conclusion
The open source MCP server for Prometheus allows users to interact with their monitoring environments through natural language. This MCP server allows you to:
- Query monitoring data using natural language instead of PromQL.
- Troubleshoot infrastructure issues using conversational AI.
- Democratize monitoring capabilities across development and operations teams.
As organizations continue to adopt cloud-native architectures, tools that streamline monitoring and reduce cognitive load become increasingly valuable. The Prometheus MCP server demonstrates our commitment to making observability more accessible while maintaining the power and flexibility that AWS observability users expect.
AWS encourages you to share your experiences with the Prometheus MCP server: whether it’s suggesting new features, reporting challenges, or highlighting workflows where AI assistance could be more impactful. Your insights into daily monitoring patterns, pain points, and areas where you need enhanced automation or guidance are invaluable in shaping the future capabilities of this tool.
Get started today by visiting the Prometheus MCP Server documentation. To begin your monitoring journey:
- Try Amazon Q Developer CLI – Download and install Amazon Q Developer CLI to start using natural language queries with your monitoring data.
- Set up Amazon Managed Service for Prometheus – Create your first Prometheus workspace to collect and store your application metrics.