- Amazon EMR
- Features
- EMR Studio
Amazon EMR Studio
Why EMR Studio?
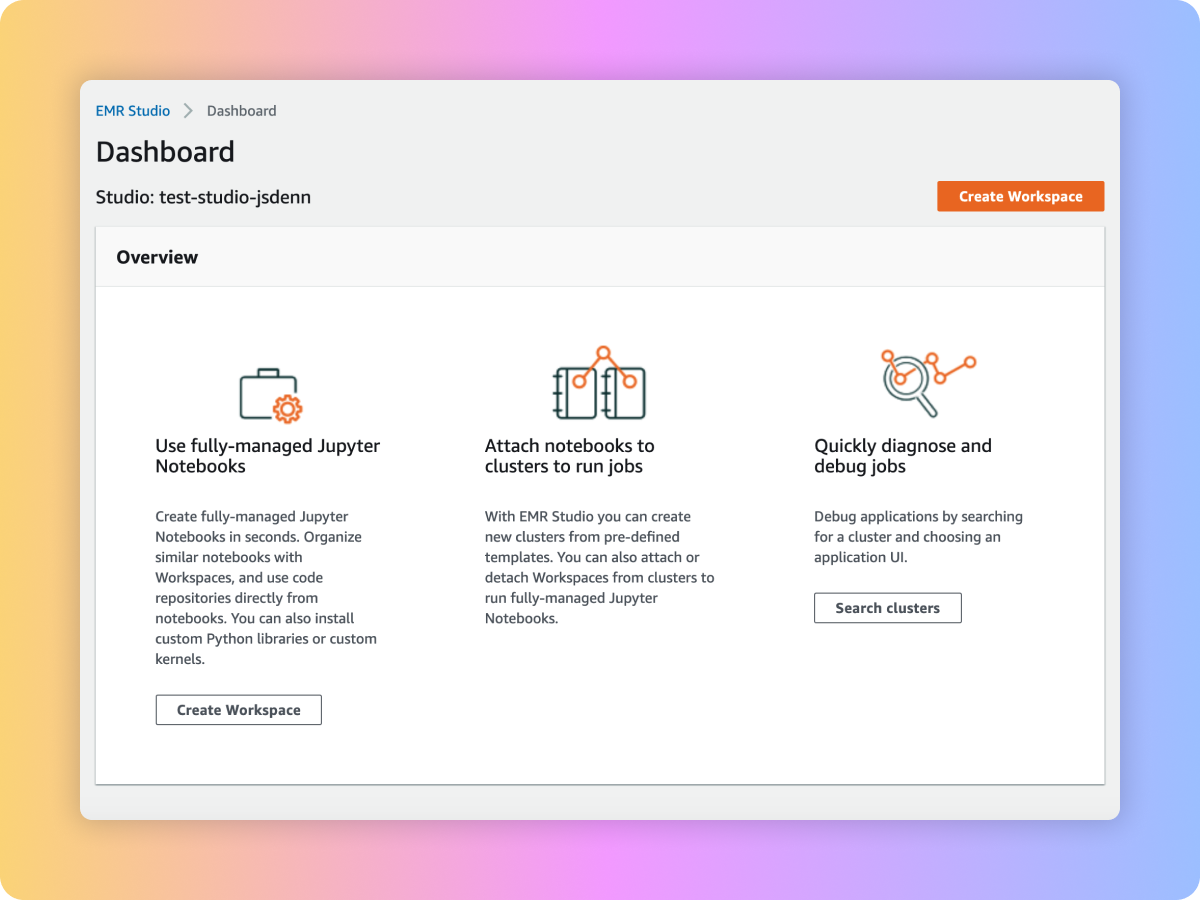
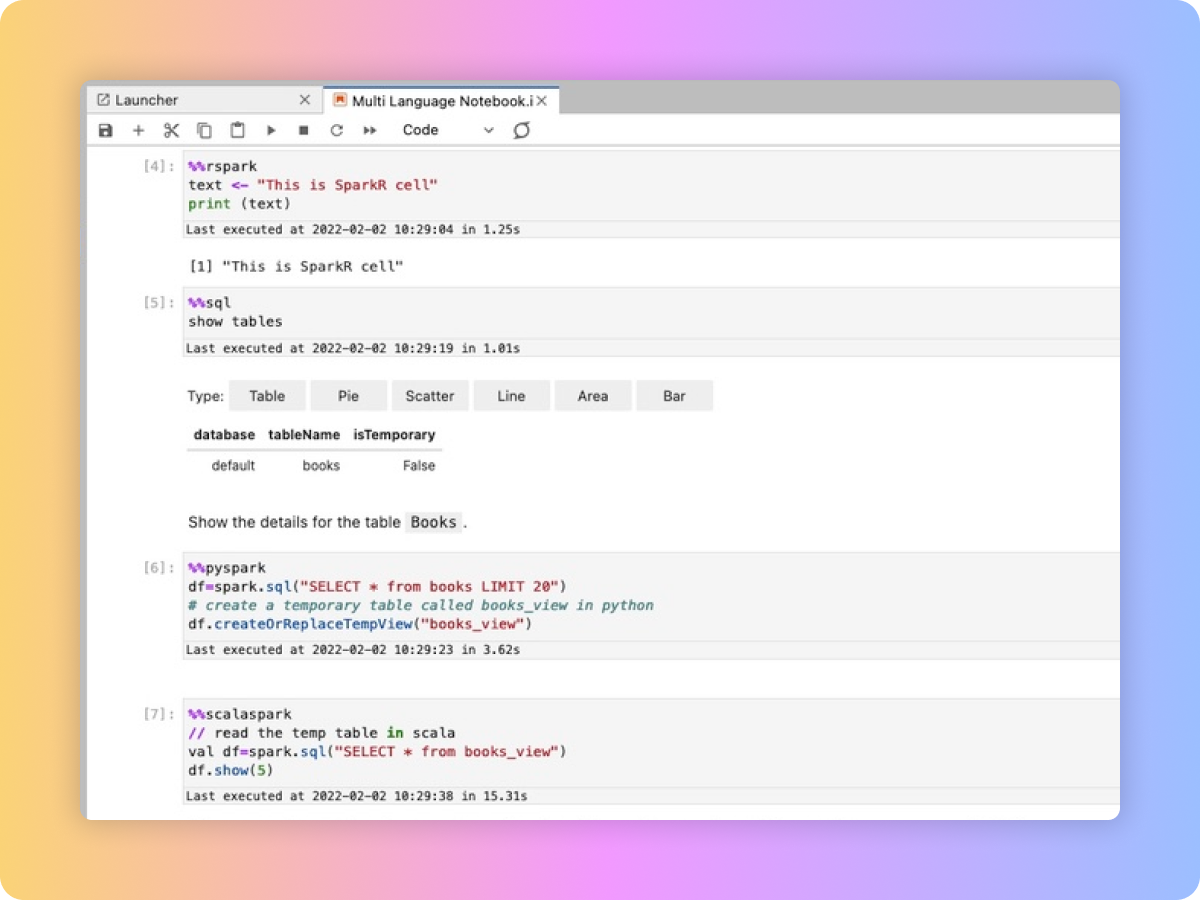
EMR Studio is an integrated development environment (IDE) that makes it easy for data scientists and data engineers to develop, visualize, and debug data engineering and data science applications written in R, Python, Scala, and PySpark.
EMR Studio provides fully managed Jupyter Notebooks and tools such as Spark UI and YARN Timeline Service to simplify debugging. Data scientists and analysts can install custom kernels and libraries, collaborate with peers using code repositories such as GitHub and BitBucket, or execute parameterized notebooks as part of scheduled workflows using orchestration services like Apache Airflow or Amazon Managed Workflows for Apache Airflow.
EMR Studio kernels and applications run on EMR clusters, so you get the benefit of distributed data processing using the performance optimized Amazon EMR runtime for Apache Spark. Administrators can set up EMR Studio such that analysts can run their applications on existing EMR clusters or create new clusters using pre-defined AWS Cloud Formation templates for EMR.
Simple to use
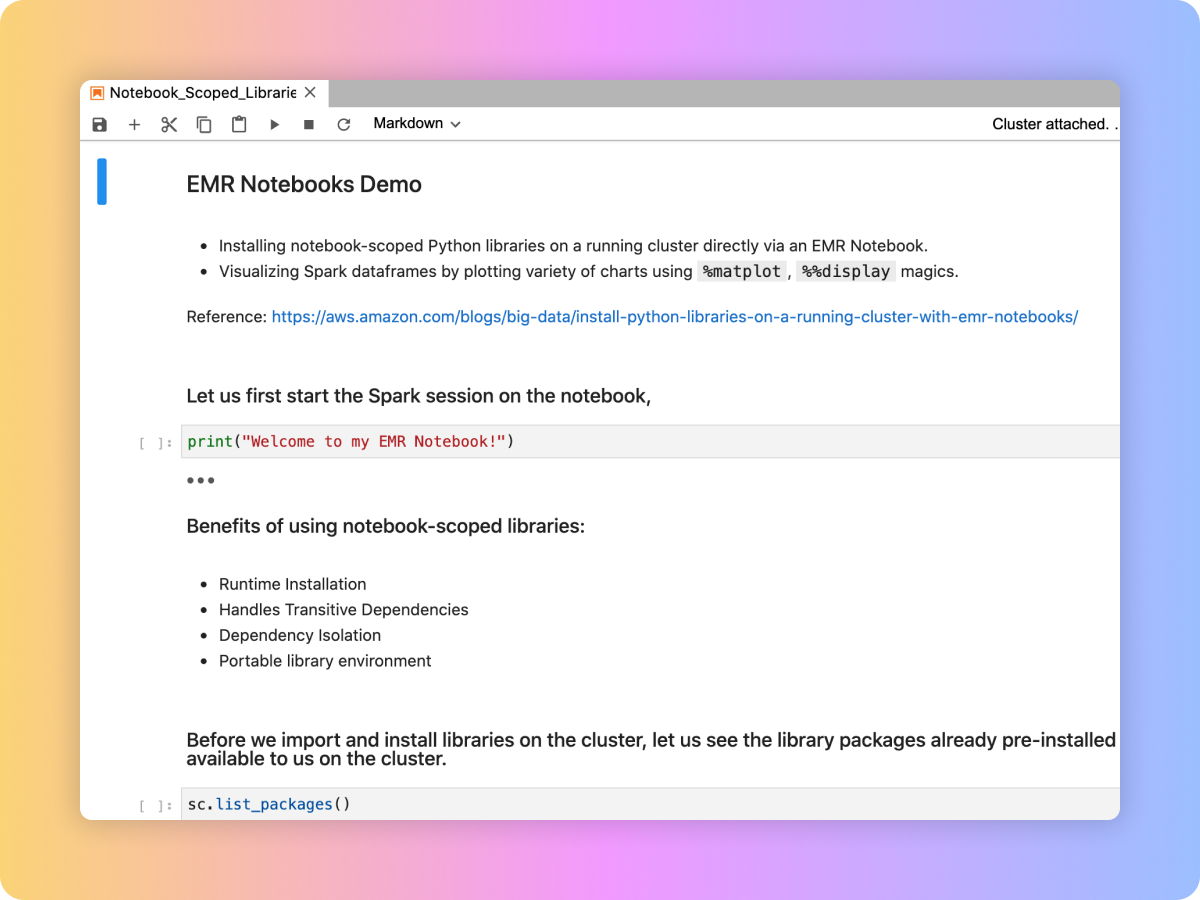
Fully managed Jupyter Notebooks
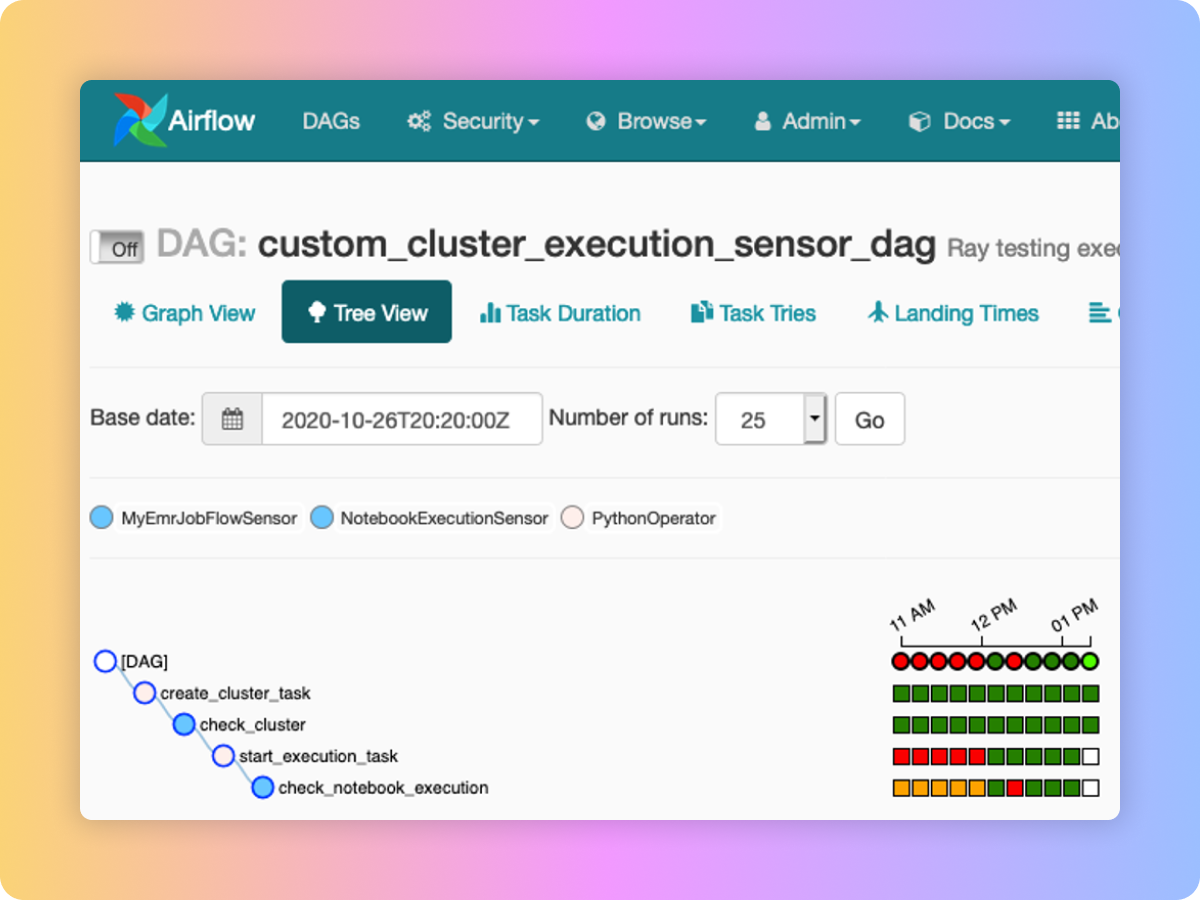
Easy to build applications
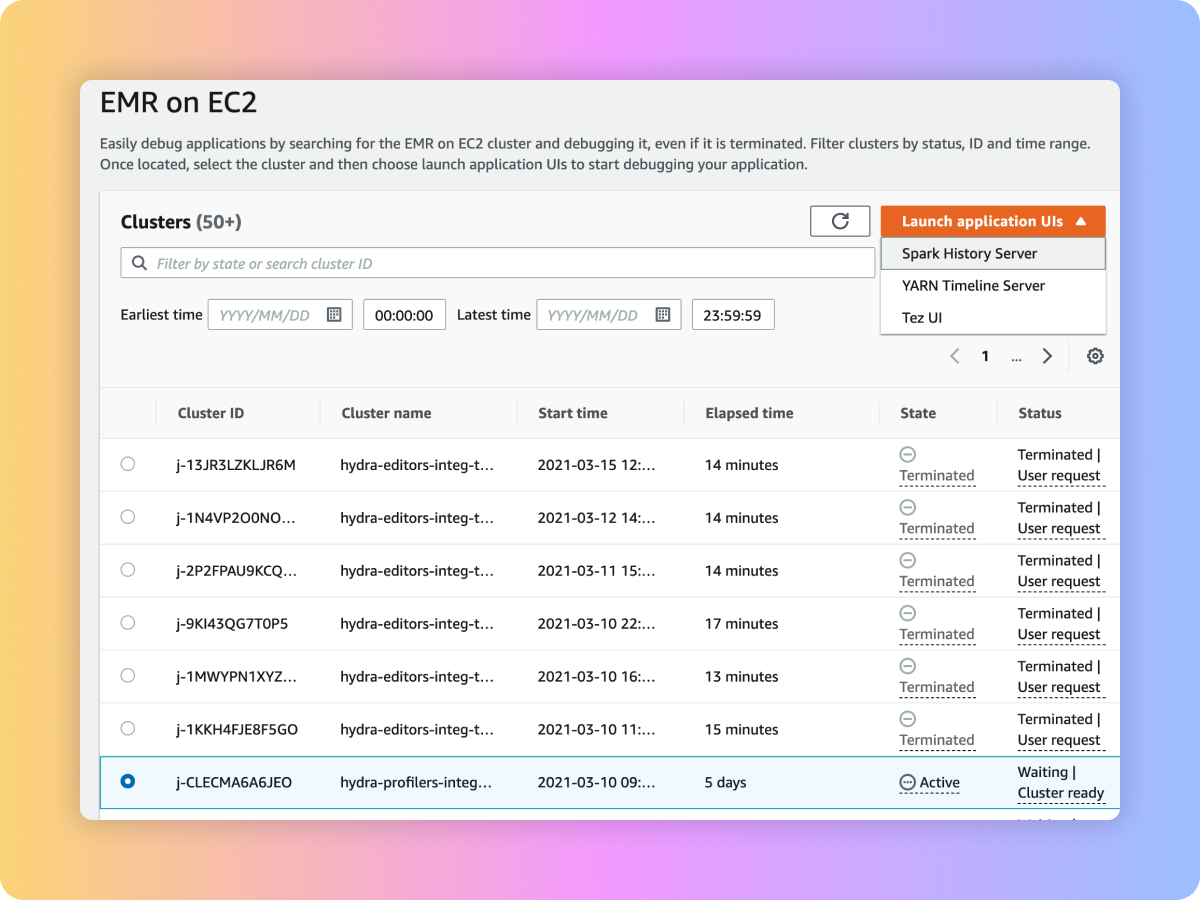
Simplified debugging
Real-time collaborative notebooks
SQL Explorer
Multi Language Notebooks
Use cases
-
With EMR Studio, you can start notebooks in seconds, get onboarded with sample notebooks, and perform your data exploration. You can collaborate with peers via built-in real time collaboration and track changes across notebook versions via Git repositories. You can also customize your environment by loading custom kernels and Python libraries from notebooks.
-
In EMR Studio, you can use code repository to trigger pipelines. You can also parameterize and chain notebooks to build pipelines. You can integrate notebooks into scheduled workflows using workflow orchestration services such as Apache Airflow or Amazon Managed Workflows for Apache Airflow. EMR Studio also allows you to re-attach notebooks to a bigger cluster to run a job.
-
In EMR Studio, you can debug notebook applications from the notebook UI. You can also debug pipelines by first narrowing down clusters using filters like cluster state, and diagnose jobs on both active and terminated clusters with as few clicks as possible to open native debugging UIs like Spark UI, Tez UI, and Yarn Timeline Service.