- AWS Solutions Library›
- Guidance for Multi-Omics and Multi-Modal Data Integration and Analysis on AWS
Guidance for Multi-Omics and Multi-Modal Data Integration and Analysis on AWS
Overview
How it works
Architecture
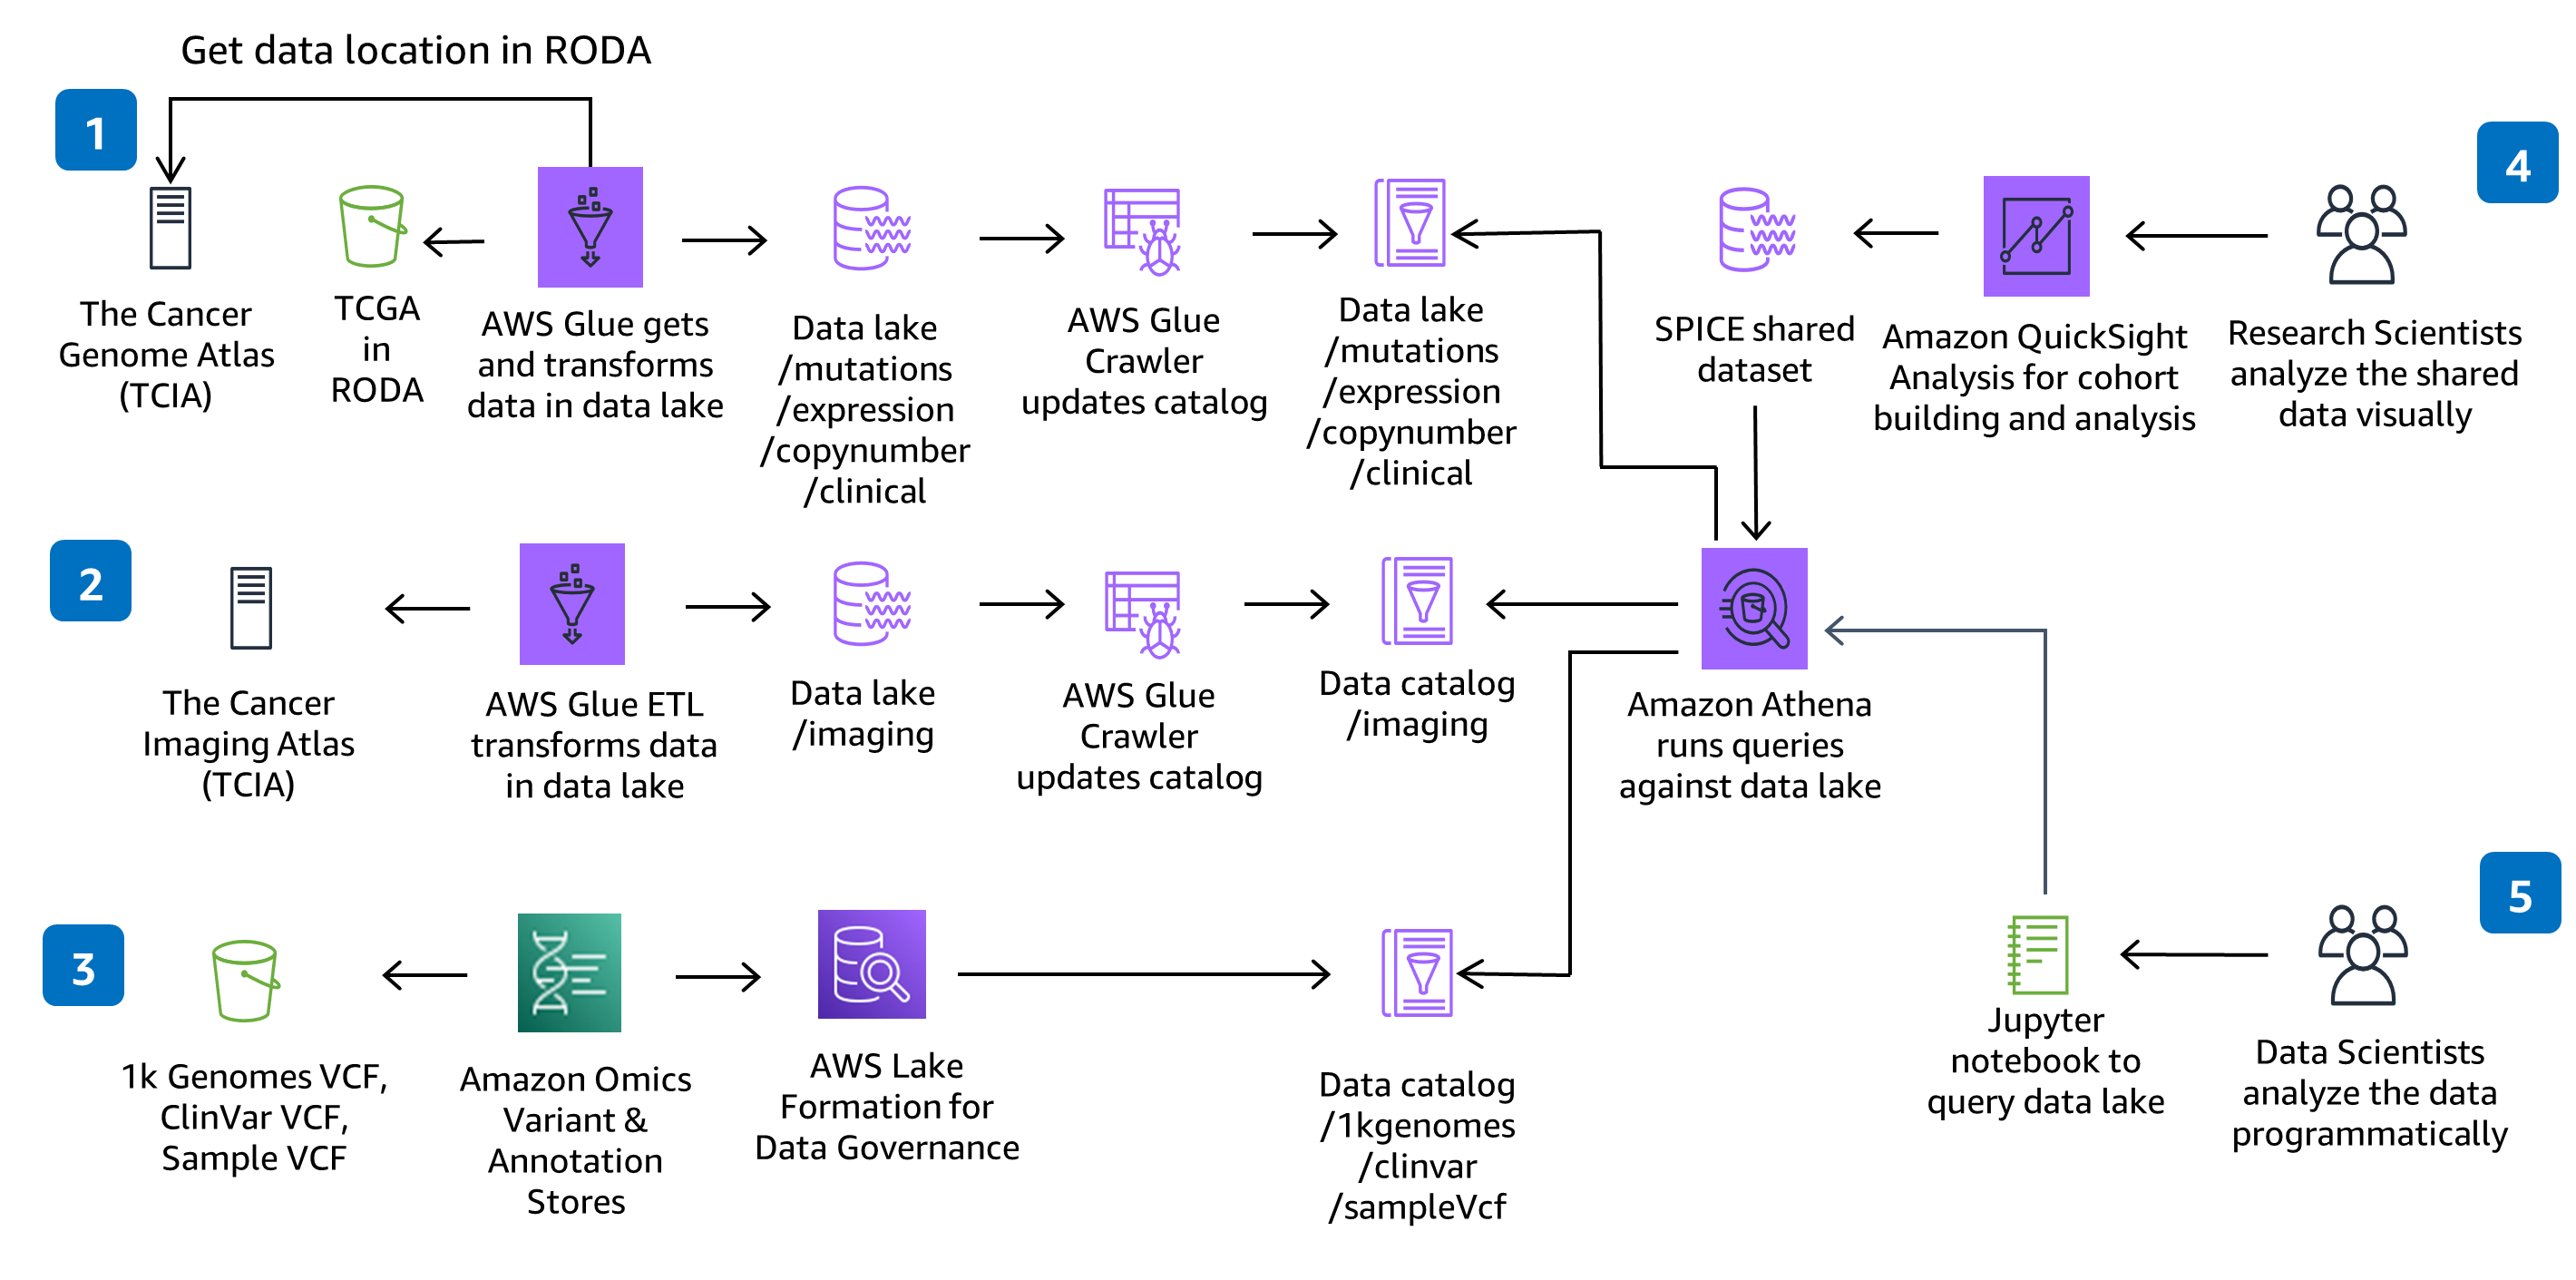
Prepare genomic, clinical, mutation, expression and imaging data for large-scale analysis and query against a data lake.
CI/CD
Prepare genomic, clinical, mutation, expression and imaging data for large-scale analysis and query against a data lake.
Well-Architected Pillars
The architecture diagram above is an example of a Solution created with Well-Architected best practices in mind. To be fully Well-Architected, you should follow as many Well-Architected best practices as possible.
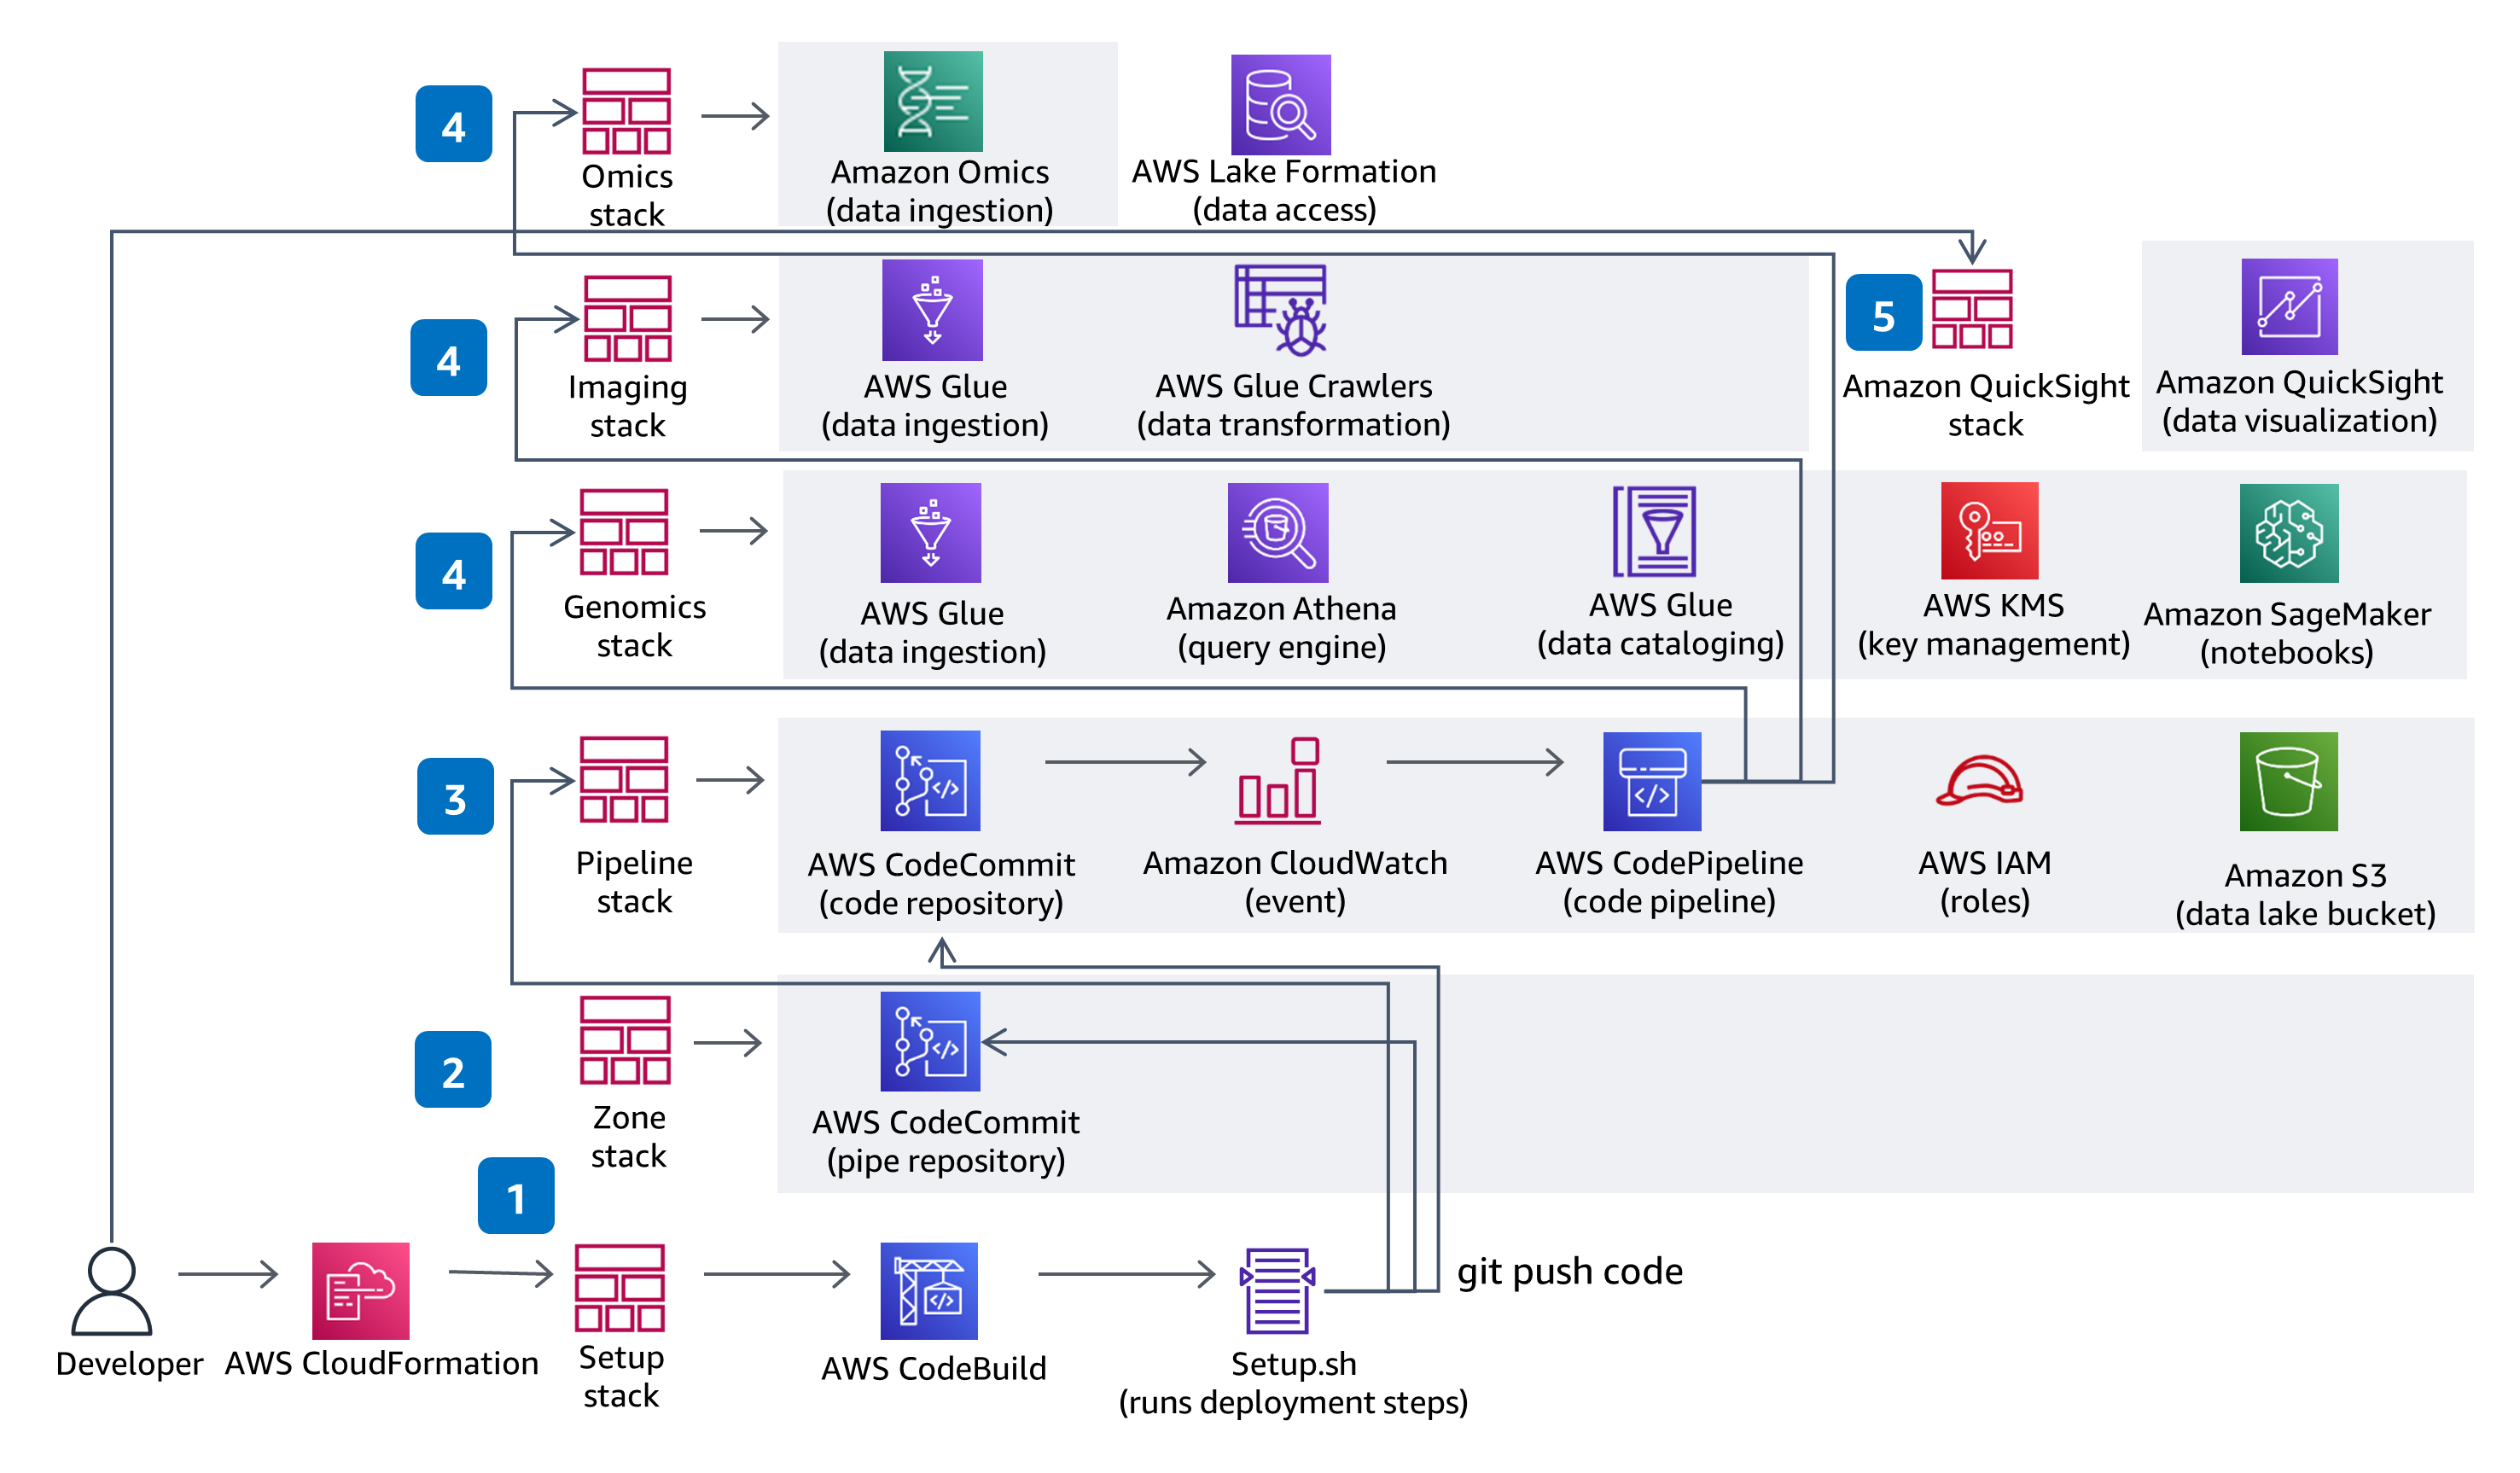
This Guidance uses CodeBuild and CodePipeline to build, package and deploy everything needed in the solution to ingest and store Variant Call Files (VCFs) and work with multi-modal and multi-omic data from the datasets in The Cancer Genome Atlas (TCGA) and The Cancer Imaging Atlas (TCIA). Serverless genomics data ingestion and analysis is demonstrated using a fully managed service - Amazon Omics. Code changes made in the solution CodeCommit repository with be deployed through the provided CodePipeline deployment pipeline.
This Guidance uses role based access with IAM and all buckets have encryption enabled, are private, and block public access. The data catalog in AWS Glue has encryption enabled and all meta data written by AWS Glue to Amazon S3 is encrypted. All roles are defined with least privileges and all communications between services stay within the customer account. Administrators can control Jupyter notebook, Amazon Omics Variant Stores’ data and AWS Glue Catalog data access is fully managed using Lake Formation, and Athena, SageMaker Notebook and QuickSight data access is managed through provided IAM roles.
AWS Glue, Amazon S3, Amazon Omics, and Athena are all serverless and will scale data access performance as your data volume increases. AWS Glue provisions, configures, and scales the resources required to run your data integration jobs. Athena is serverless, so you can quickly query your data without having to set up and manage any servers or data warehouses. The QuickSight SPICE in-memory storage will scale your data exploration to thousands of users.
By using serverless technologies, you only provision the exact resources you use. Each AWS Glue job will provision a Spark cluster on demand to transform data and de-provision the resources when done. If you choose to add new TCGA datasets, you can add new AWS Glue jobs and AWS Glue crawlers that will also prevision resources on-demand. Athena automatically executes queries in parallel, so most results come back within seconds. Amazon Omics optimizes variant query performance at scale by transforming files into Apache Parquet.
By using serverless technologies that scale on demand, you pay only for the resources you use. To further optimize cost, you can stop the notebook environments in SageMaker when they are not in use. The QuickSight dashboard is also deployed through a separate CloudFormation template, so if you don’t intend to use the visualization dashboard, you can choose to not deploy it to save costs. Amazon Omics optimizes variant data storage cost at scale. Query costs are determined by the amount of data scanned by Athena and can be optimized by writing queries accordingly.
By extensively using managed services and dynamic scaling, you minimize the environmental impact of the backend services. A critical component for sustainability is to maximize the usage of notebook server instances. You should stop the notebook environments when not in use.
Additional Considerations
Data Transformation
This architecture chose AWS Glue for the Extract, Transform, and Load (ETL) needed to ingest, prepare, and catalog the datasets in the solution for query and performance. You can add new AWS Glue Jobs and AWS Glue Crawlers to ingest new The Cancer Genome Atlas (TCGA) and The Cancer Image Atlas (TCIA) datasets, as needed. You can also add new jobs and crawlers to ingest, prepare, and catalog your own proprietary datasets.
Data Analysis
This architecture chose SageMaker Notebooks to provide a Jupyter notebook environment for analysis. You can add new notebooks to the existing environment or create new environments. If you prefer RStudio to Jupyter notebooks, you can use RStudio on Amazon SageMaker.
Data Visualization
This architecture chose QuickSight to provide interactive dashboards for data visualization and exploration. The QuickSight dashboard setup is through a separate CloudFormation template so if you don’t intend to use the dashboard you don’t have to provision it. In QuickSight, you can create your own analysis, explore additional filters or visualizations, and share datasets and analysis with colleagues.
Deploy with confidence
This repository creates a scalable environment in AWS to prepare genomic, clinical, mutation, expression and imaging data for large-scale analysis and perform interactive queries against a data lake. The solution demonstrates how to 1) use HealthOmics Variant Store & Annotation Store to store genomic variant data and annotation data, 2) provision serverless data ingestion pipelines for multi-modal data preparation and cataloging, 3) visualize and explore clinical data through an interactive interface, and 4) run interactive analytic queries against a multi-modal data lake using Amazon Athena and Amazon SageMaker.
A detailed guide is provided to experiment and use within your AWS account. Each stage of building the Guidance, including deployment, usage, and cleanup, is examined to prepare it for deployment.
The sample code is a starting point. It is industry validated, prescriptive but not definitive, and a peek under the hood to help you begin.
Contributors
Disclaimer
Did you find what you were looking for today?
Let us know so we can improve the quality of the content on our pages