AWS Cloud Financial Management
Introducing AI-Powered Cost Analysis in AWS Cost Explorer
We’re excited to announce AI-powered cost analysis in AWS Cost Explorer, powered by Amazon Q Developer. You can now click a suggested prompt or ask a question in your own words right from the Cost Explorer. Amazon Q delivers detailed insights while Cost Explorer automatically updates its charts, tables, and report parameters to reflect the analysis. This new capability brings a conversational layer to Cost Explorer’s powerful filtering capabilities, making cost analysis accessible to every team member without compromising the depth and control that experienced users rely on. Whether you’re a developer checking project costs, a finance manager reviewing monthly spending, or a FinOps practitioner running daily analysis, you can now get answers in seconds.
Why AI-powered cost analysis in Cost Explorer
Cost Explorer offers powerful cost analysis capabilities with multiple report parameters and visualization options, giving experienced users deep control over their cost views. With the addition of natural language cost analysis powered by Amazon Q Developer, we’re making these same capabilities accessible to a broader audience by adding a conversational layer. A developer wanting to know compute costs for the past week can now simply ask “What was my compute cost and usage for last week?” and Cost Explorer automatically configures the right service filter, date range, and grouping. This allows teams that previously relied on FinOps specialists for quick cost answers can now self-serve alongside power users who continue leveraging Cost Explorer’s full filtering capabilities.
AI-powered cost analysis adds a new way to interact with Cost Explorer by letting you describe what you want to see in simple words. Amazon Q understands your intent, automatically applies the right filters and configurations, and updates your Cost Explorer visualization while providing contextual insights in the Amazon Q chat panel. This means every team member can self-serve their cost questions while maintaining the depth and accuracy that Cost Explorer provides.
How it works
When you open Cost Explorer, you’ll notice two new capabilities designed to make cost analysis as simple as having a conversation.
Suggested prompts
Displayed prominently above your Cost and Usage Overview data, suggested prompts surface the most common cost questions based on real customer usage patterns. You’ll see prompts like “Which services had the biggest cost increase this month?” or “Show my projected database cost for next month.” These are the same questions that FinOps teams answer repeatedly across organizations.
Click any prompt and two things happen simultaneously: Amazon Q opens and generates detailed insights in the chat panel, while Cost Explorer automatically refreshes with the corresponding visualization, filters, groupings, and date ranges. There’s no need to manually submit or type your question in Amazon Q; the prompt is auto-submitted the moment you click, delivering a complete answer in seconds.
Each time you load the page or complete a query, the prompts refresh with new suggestions, so you always have fresh analytical angles to explore. You can also scroll horizontally through the prompt container to discover additional options beyond those initially visible.
“Ask Question” button
For questions that go beyond the pre-defined prompts, the “Ask Question” button, positioned next to the suggested prompts, lets you type any cost-related question in natural language. Click the button, and the Amazon Q chat panel opens where you can type questions like “What is my current month’s cost and usage compared to previous one?”.
Amazon Q processes your question and delivers insights in the chat panel while intelligently determining how to display the visualization. If the requested view can be rendered in Cost Explorer, which covers the vast majority of standard cost and usage queries, your Cost Explorer page automatically updates with the relevant charts, tables, filters, and groupings. For visualizations, such as pie charts or multi-dimensional analysis, the results appear in Amazon Q’s artifact panel, ensuring you always get the most appropriate visual representation of your data.
Continuing the conversation
One of the most powerful aspects of this integration is the ability to have follow-up conversations. After clicking a suggested prompt or asking a question, you can continue the dialogue in Amazon Q to drill deeper into your costs. For example, after seeing your top spending services, you might ask “Why did my Amazon Relational Database Service (RDS) costs increase last month?” or “Break this down by region.” Amazon Q maintains the conversation context, allowing natural exploration of your cost data.
Amazon Q draws from extensive knowledge beyond what’s visible in your current Cost Explorer view, including pricing data, budget information, and anomaly detection data, to provide richer context and more comprehensive answers. If a follow-up question produces a visualization that Cost Explorer can display, it updates automatically. Otherwise, the visualization appears in Amazon Q’s artifact panel while insights continue in the chat.
Example walkthrough
Let’s walk through a typical scenario. Sarah, a cloud operations manager, opens Cost Explorer for her morning cost review. She has a leadership meeting later today and needs to quickly understand her team’s current spending, investigate a few areas that caught her attention last week, and come prepared with specifics.
Step 1: Quick check with suggested prompts
Sarah starts by looking at the suggested prompts and spots one that’s immediately relevant: “How much did I spend on database service this month?”, as shown in Figure 1. She clicks it, and within seconds Amazon Q opens with a comprehensive breakdown of her database spending in its chat panel while Cost Explorer refreshes with the corresponding visualization. As shown in Figure 2, Amazon Q intelligently identified all the relevant database services in her account and applied the appropriate service filters, date range, and groupings automatically, so Sarah didn’t need to know or specify which exact database services her team is running. All report parameters are visible in the Report Parameters panel, giving Sarah full transparency into how the data was filtered. She now has a clear picture of her database costs and can either continue the conversation in Amazon Q, or adjust the filters directly from the Report Parameters panel to explore further.
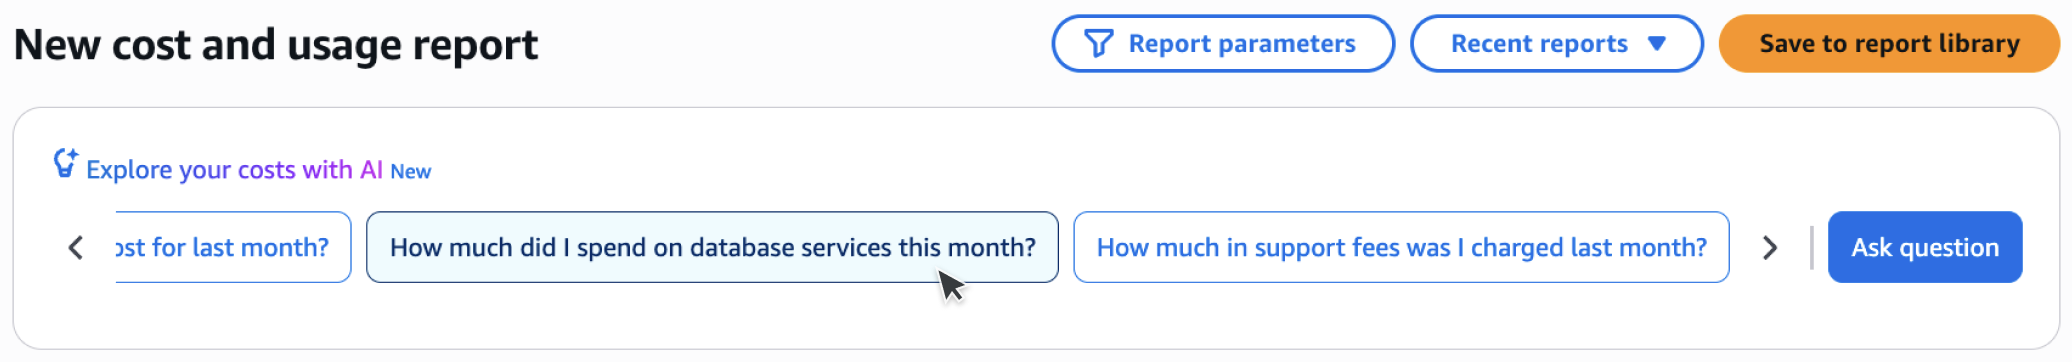
Figure 1: Sarah spots the suggested prompt “How much did I spend on database service this month?” in Cost Explorer.
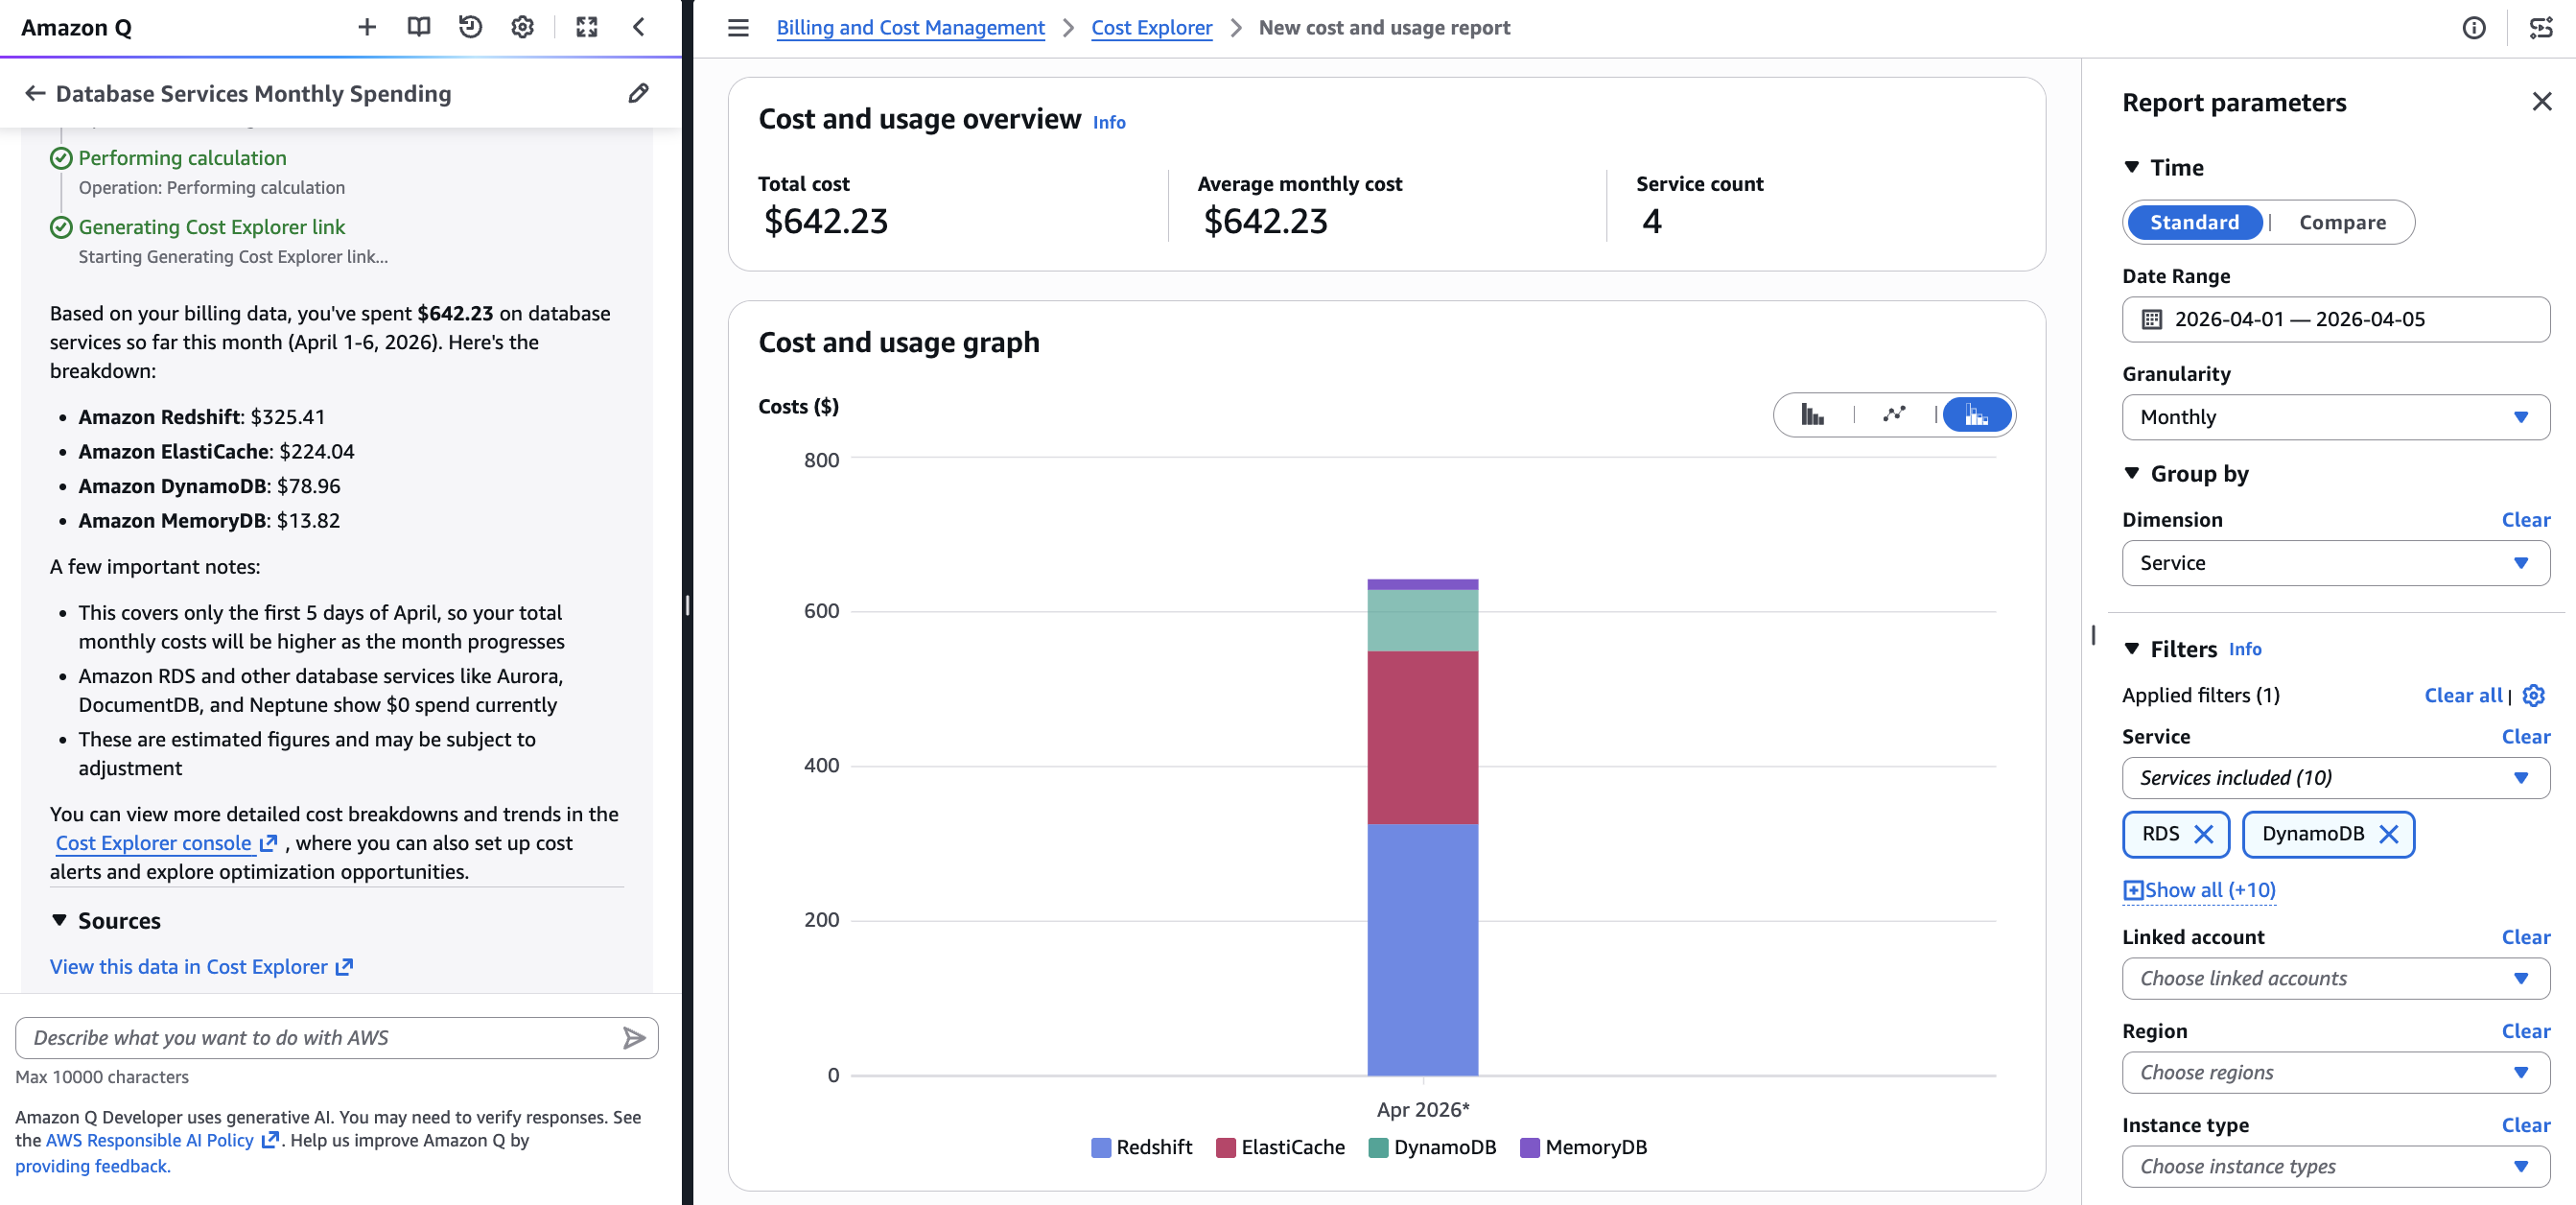
Figure 2: Upon clicking, Amazon Q opens with detailed database spending insights while Cost Explorer updates with the corresponding visualization and report parameters.
Step 2: Deeper investigation with a custom question
With database costs accounted for, Sarah turns her attention to something she noticed last week. Her Amazon Elastic Compute Cloud (EC2) costs seemed higher than expected. To investigate, she clicks the “Ask Question” button as shown in Figure 3. Amazon Q opens, and Sarah types: “Show me my EC2-instances costs broken down by instance type for the last 3 months.” As shown in Figure 4, Amazon Q provides insights about her EC2 spending trends, highlighting the instance types contributing most to the increase. Cost Explorer simultaneously updates with a chart showing costs by instance type over the requested period, along with all report parameters automatically configured. Sarah can now clearly see which instance types are driving the cost increase.
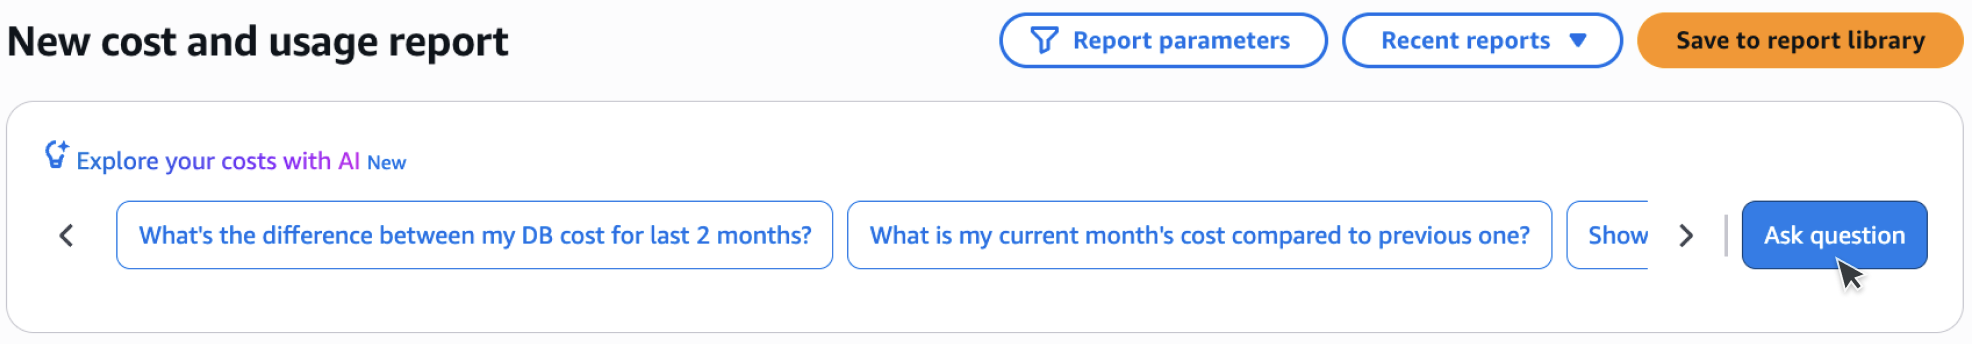
Figure 3: Sarah clicks the “Ask Question” button to investigate her EC2-instances costs further.
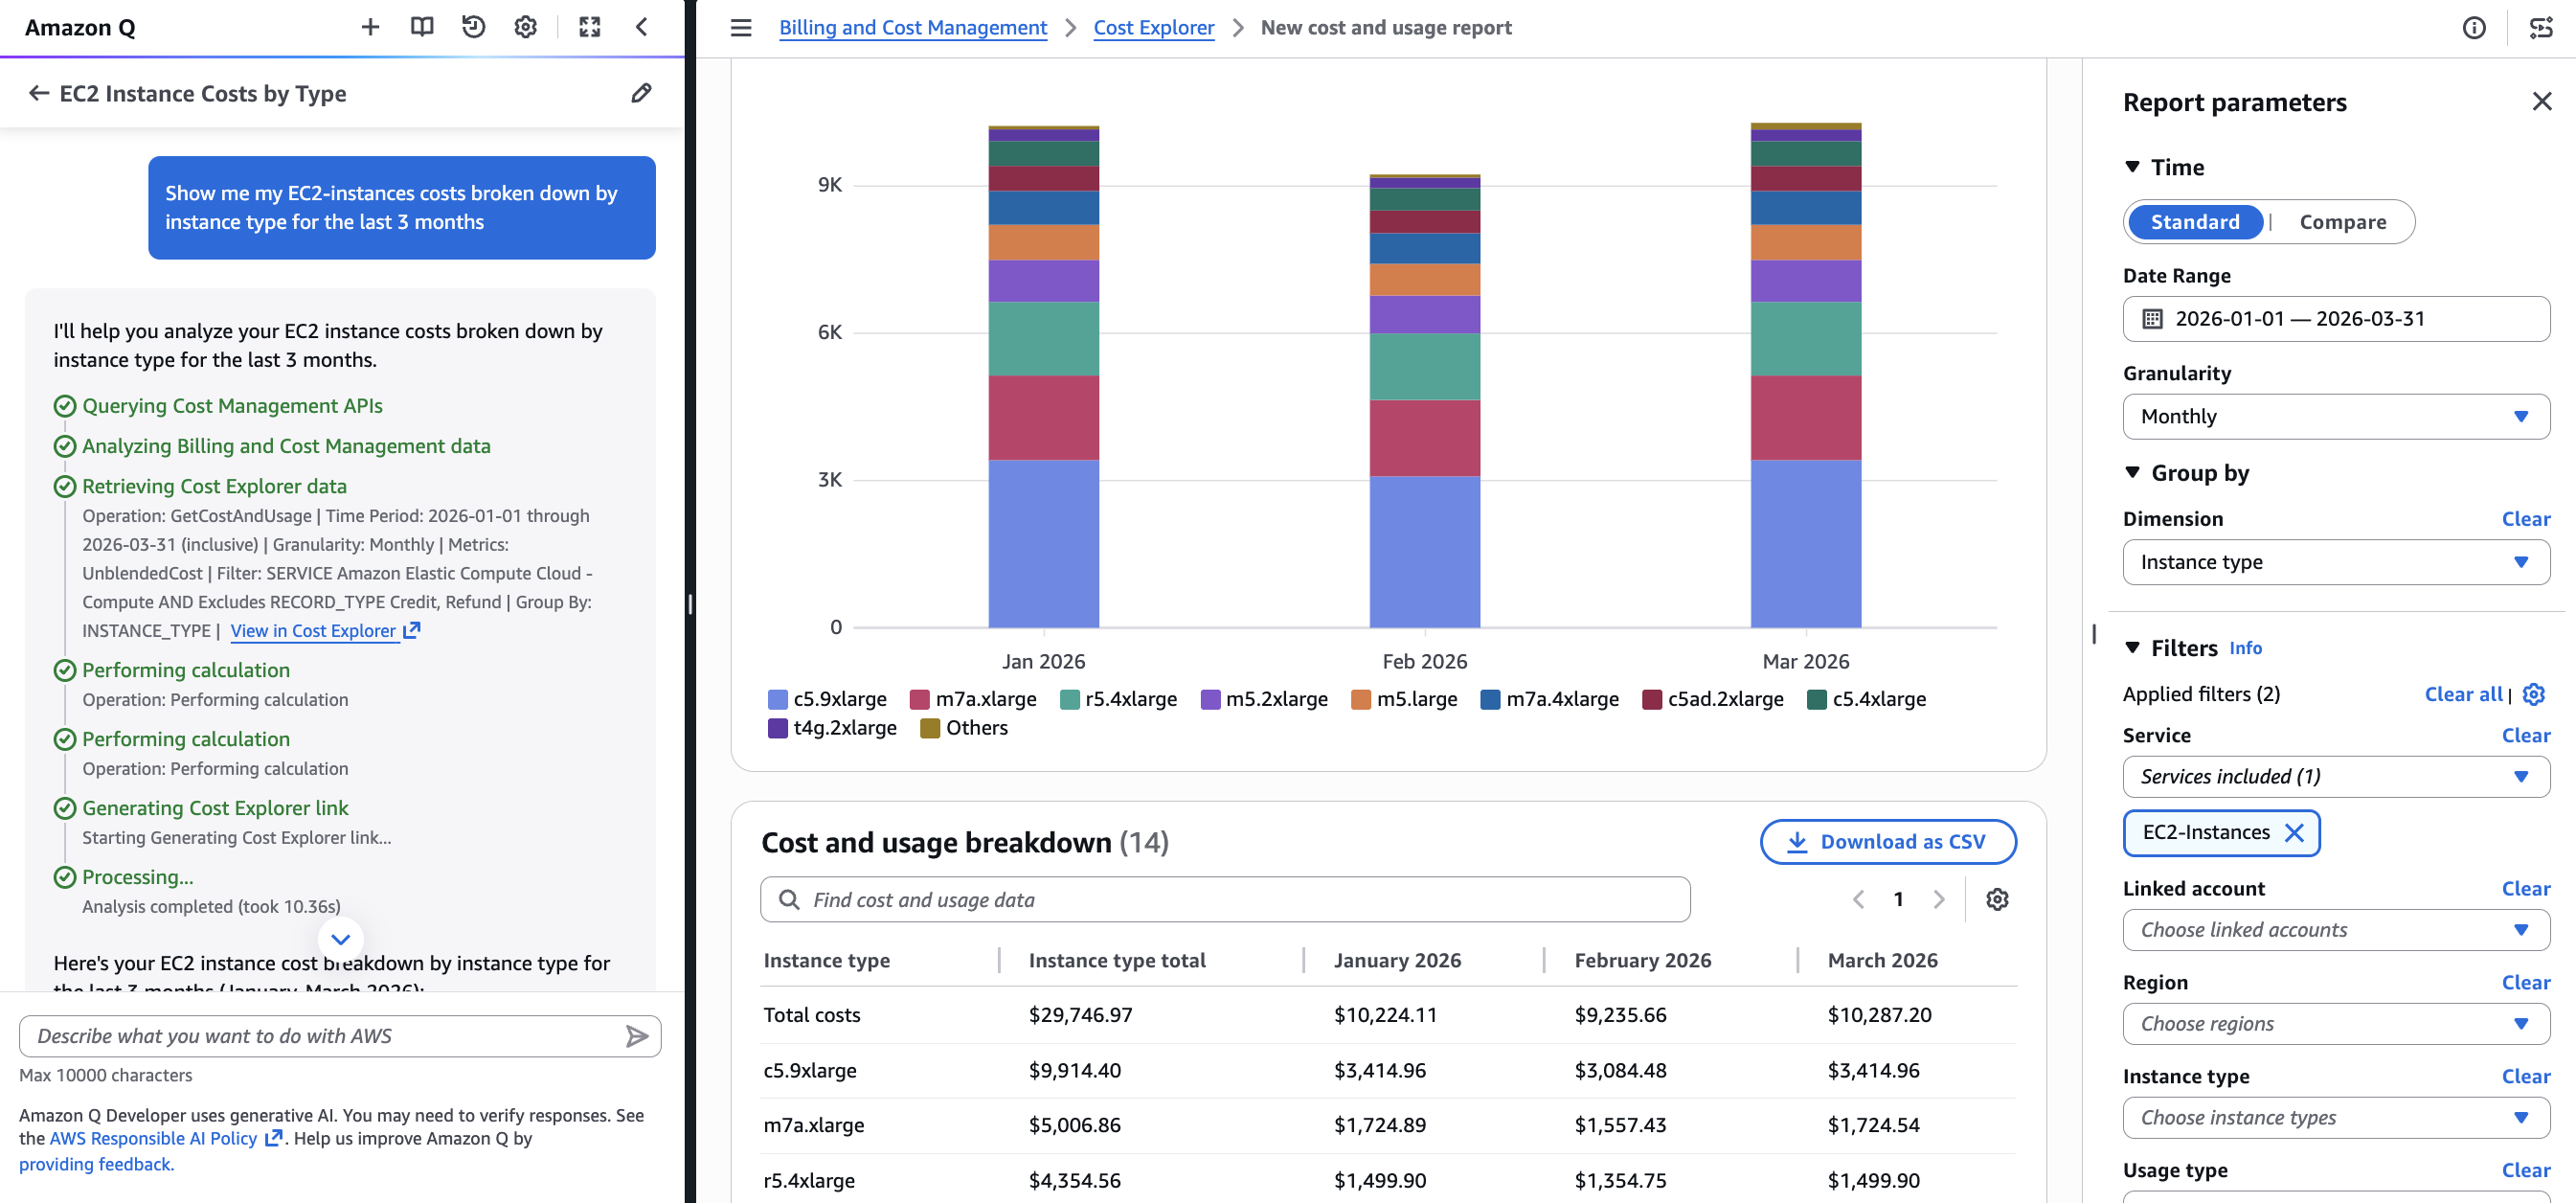
Figure 4: Amazon Q delivers EC2 spending insights by instance type while Cost Explorer updates with the corresponding visualization and report parameters.
Step 3: Follow-up conversation
Sarah notices that c5.9xlarge instances are the primary cost driver and wants to understand which regions they’re are running in. Without leaving her prior conversation, she asks a follow-up question in Amazon Q: “Which region is running the most number of c5.9xlarge instances and what’s the cost related to it?,” as shown in Figure 5. Amazon Q responds with a detailed regional breakdown of c5.9xlarge usage and associated costs, as shown in Figure 6, while Cost Explorer updates with the region-level view grouped by EC2-Instances. Sarah now knows exactly which region and instance type to discuss with her team. In under a minute of natural conversation, she completed her entire investigation and is ready to walk into her leadership meeting fully prepared.
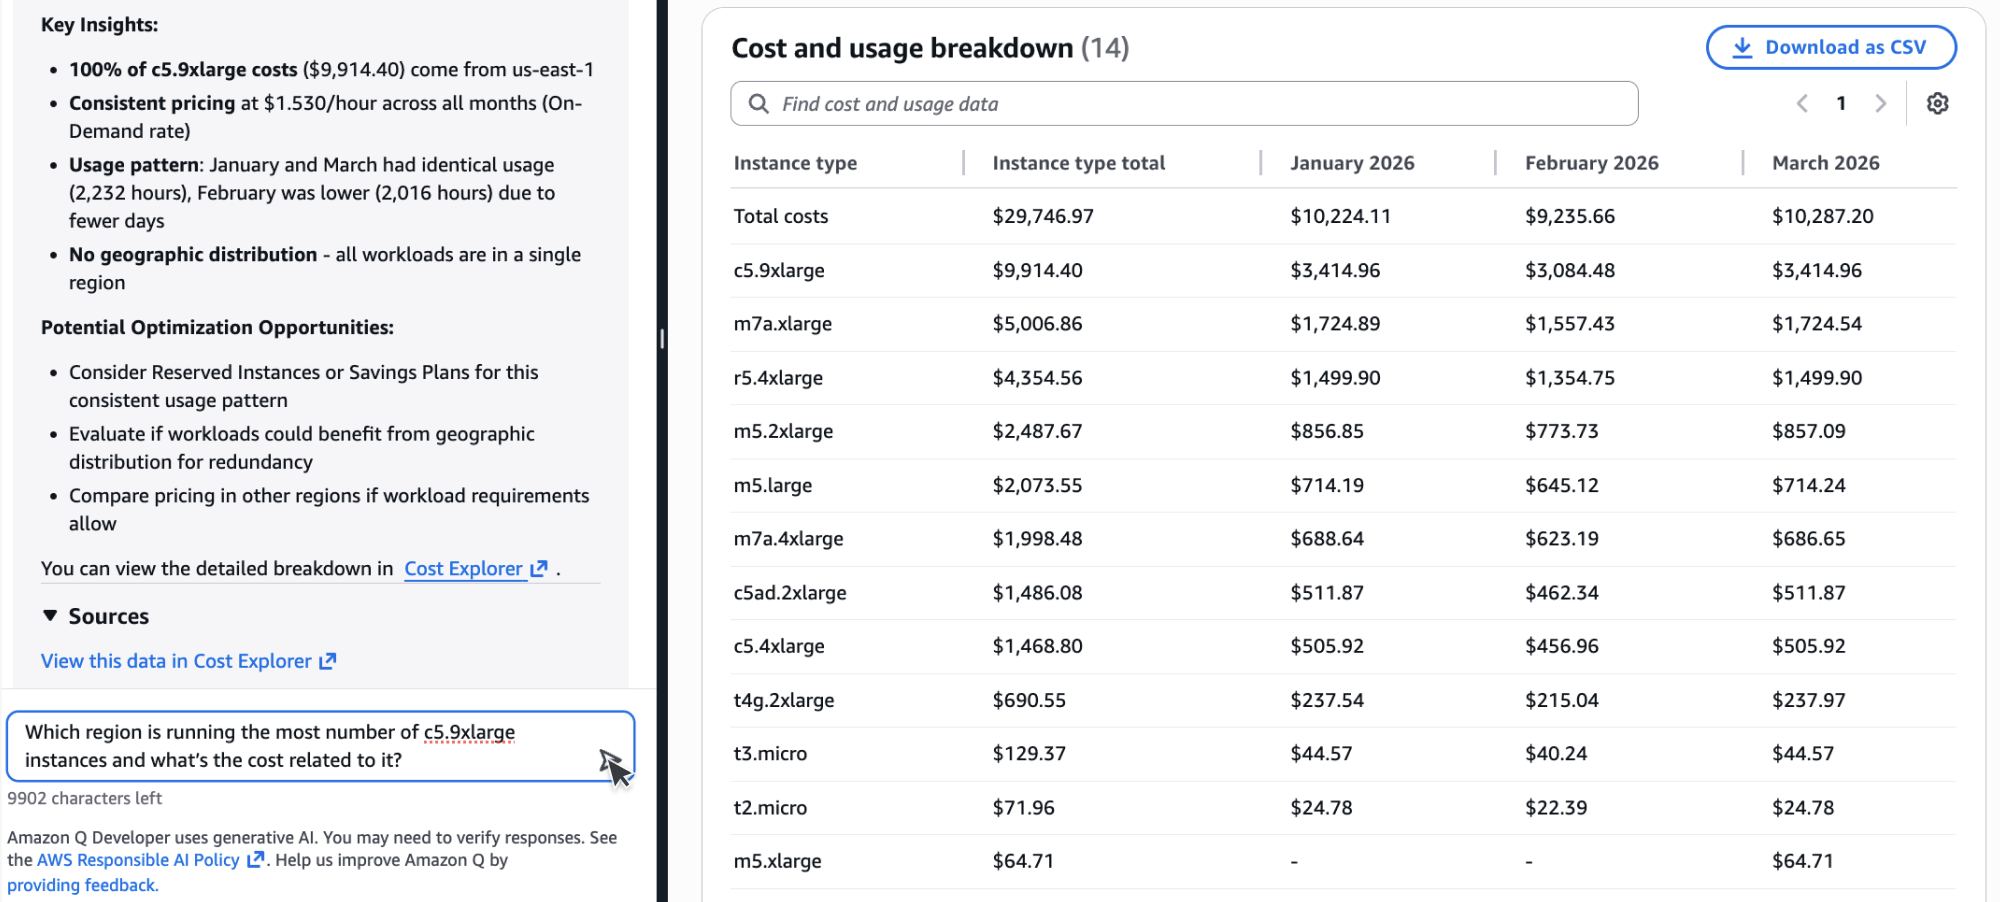
Figure 5: Sarah asks a follow-up question about which regions are running c5.9xlarge instances and the associated costs.
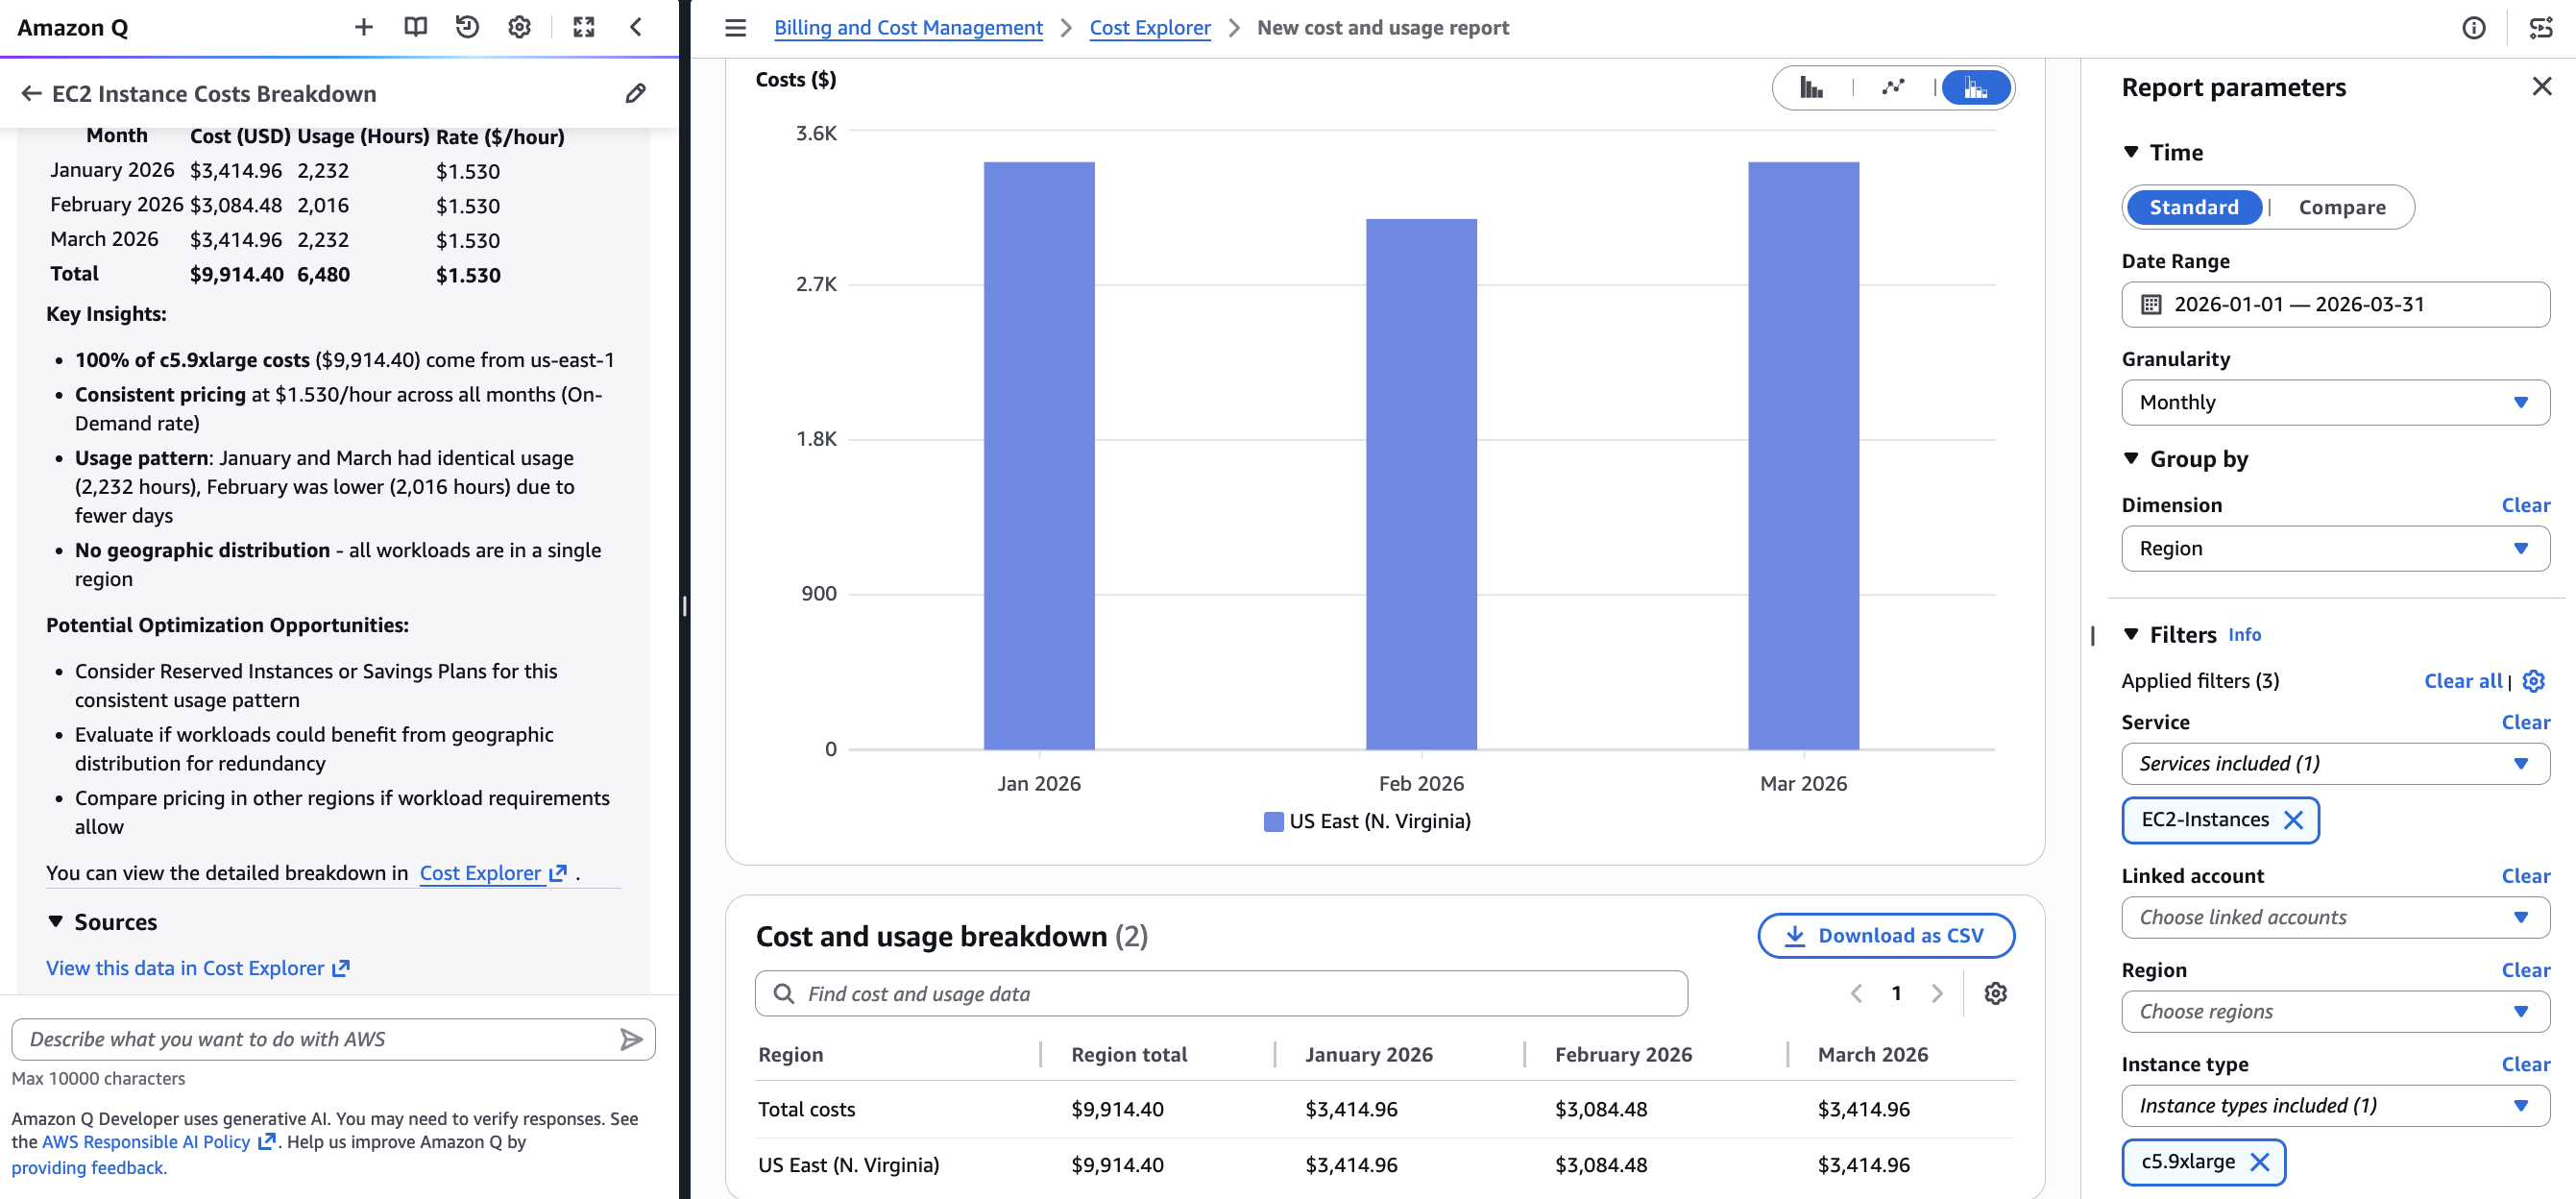
Figure 6: Amazon Q provides an insight on the region while Cost Explorer updates with the region-level view grouped by EC2-Instances.
Context-aware behavior
The integration is designed to meet you where you are. When you’re on the Cost Explorer page and interact with Amazon Q through suggested prompts or the Ask Question button, visualizations update directly in Cost Explorer, keeping you in your workflow without disruption. Your Cost Explorer view maintains all its existing functionality: you can save the AI-configured view as a report, share the URL with colleagues (all filters are preserved in the URL), bookmark it for future reference, or export the data to CSV for further analysis.
Amazon Q is available across the entire AWS console, not just Cost Explorer. If you’re working on another console page, such as Amazon EC2 or Simple Storage Service (S3), and ask a cost-related question through Amazon Q, the cost visualization appears in Amazon Q’s artifact panel alongside the chat, so you can review your cost data without navigating away from the page you’re currently working on.
Getting started
AI-powered cost analysis in Cost Explorer requires no additional setup beyond your existing Cost Explorer and Amazon Q permissions. If you already have Cost Explorer access, you’ll need Amazon Q permissions (q:StartConversation, q:SendMessage) and the q:PassRequest permission that allows Amazon Q to call AWS APIs on your behalf. The quickest way for administrators to grant access is using the AmazonQFullAccess managed policy. For detailed permission configurations, read Security for cost management capabilities in Amazon Q Developer.
Natural Language Queries for AWS Cost Explorer are available today in all commercial AWS regions at no additional charge for Cost Explorer users. Simply open Cost Explorer to discover the new capabilities and start analyzing your costs through natural conversation.
To learn more, visit our Cost Explorer documentation and start transforming how your organization understands and manages cloud costs.