AWS Business Intelligence Blog
Accelerating analytics and reducing costs: Maryland Benefits’ implementation of Amazon Quick Sight
By Lingam Chockalingam, Chief Data Architect and Karunakaran Muthusamy, Solution Architect at MD Benefits.
Maryland Benefits is an innovative, cloud-based platform that allows multiple state agencies to share and manage data in one convenient place. As an ambitious, state-of-the-art IT program, Maryland Benefits enhances customer services, streamlines common data, and reduces IT operating costs for Maryland’s state agencies. At the core of our platform is a system of modular, interconnected components, comprising a common data repository, shared service elements and resources, and mission-specific applications that support multiple programs and missions.
In this post, we share how Maryland Benefits transformed its data analytics capabilities by implementing Amazon Quick Sight, resulting in significant improvements in reporting efficiency, decision-making speed, and cost optimization across our organization.
The Challenge: Fragmented data and limited analytics capabilities
Before implementing Quick Sight, our organization encountered multiple data-related challenges that impacted our decision-making capabilities. As our data requirements grew more complex, we found that our legacy business intelligence (BI) solutions were becoming increasingly restrictive and insufficient. The cost structure of our previous tools was inflexible and often exceeded our budgetary expectations, particularly as our data and user base expanded. Customizing dashboards and reports to meet evolving business requirements was time-consuming and restrictive, making it difficult to adapt quickly to changing needs. As our data volume and user demands increased, maintaining performance and efficiency became increasingly challenging.
Additionally, our previous tools required a steep learning curve for nontechnical users, limiting accessibility across the organization. Embedding analytics into existing applications and workflows was cumbersome, which impacted user adoption and hindered seamless decision-making. Beyond tool-specific issues, we struggled with fragmented data views that made it difficult to obtain a comprehensive view of agency performance. Discovering and utilizing internal and cross-agency data was a complex process, resulting in unnecessary duplication of effort as teams spent excessive time creating and storing redundant information. Without a centralized platform for connecting data creators and users, data subscription and sharing processes were inefficient, further limiting collaboration and hindering decision-making.
The Solution: Amazon Quick Sight implementation
After we evaluated several BI tools, Quick Sight was our solution of choice. A key advantage was the serverless architecture, which reduced both costs and management overhead. The implementation process was efficient, taking just 4 weeks from assessment and planning to deployment. This timeline included Quick Sight setup and configuration, data preparation, dashboard development, testing, and deployment.
The architecture, shown in the following diagram, of Quick Sight integrates seamlessly with our existing Amazon Web Services (AWS) infrastructure, pulling data from multiple sources, including Amazon Redshift, Amazon Athena, and various file formats such as .csv and Excel files.
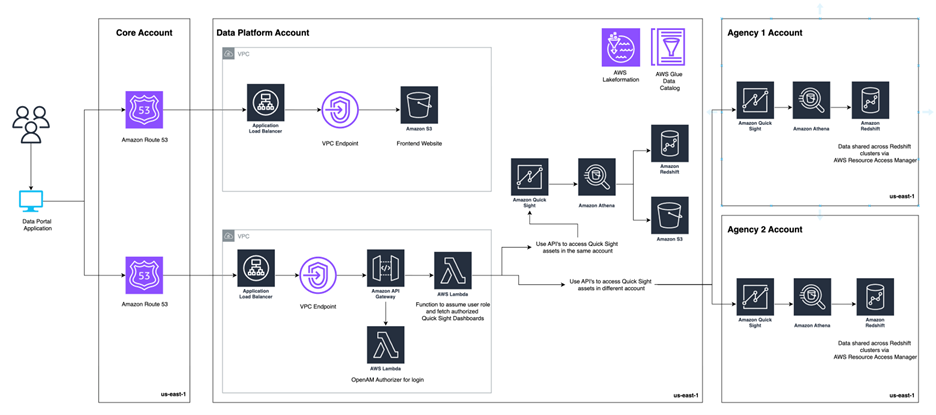
One of the key components of our implementation is the data portal. The data portal is a custom one-stop application for all reports and uses Quick Sight APIs and embedding capability. It serves as a central web infrastructure designed to empower business stakeholders and users with quick and efficient access to key performance indicators (KPIs), dashboards, and essential data. On top of that, it also provides additional capabilities such as:
- Users can access multiple Quick Sight accounts in the organization from a single interface
- Users can upload files from their local computers and visualize them using an open source tool called Apache Superset.
- Administrators can use an interface to migrate assets from development accounts to production by using the Quick Sight migrate assets API.
- Users can enforce row- and column-level security on datasets
- Users can favorite frequently used assets.
- Users can access Amazon Q in Quick Sight Q topics
- Single sign-on integration with existing Identity providers (IdP)
Individuals across the organization can now gain valuable insights seamlessly through the platform’s unified and user-friendly experience. To provide secure access, users connect to Quick Sight using single sign-on with the SAML protocol. For embedded dashboards on our data portal, we use the OAuth 2.0 Protocol with ForgeRock OpenAM, providing a seamless and secure user experience.
How we use Quick Sight
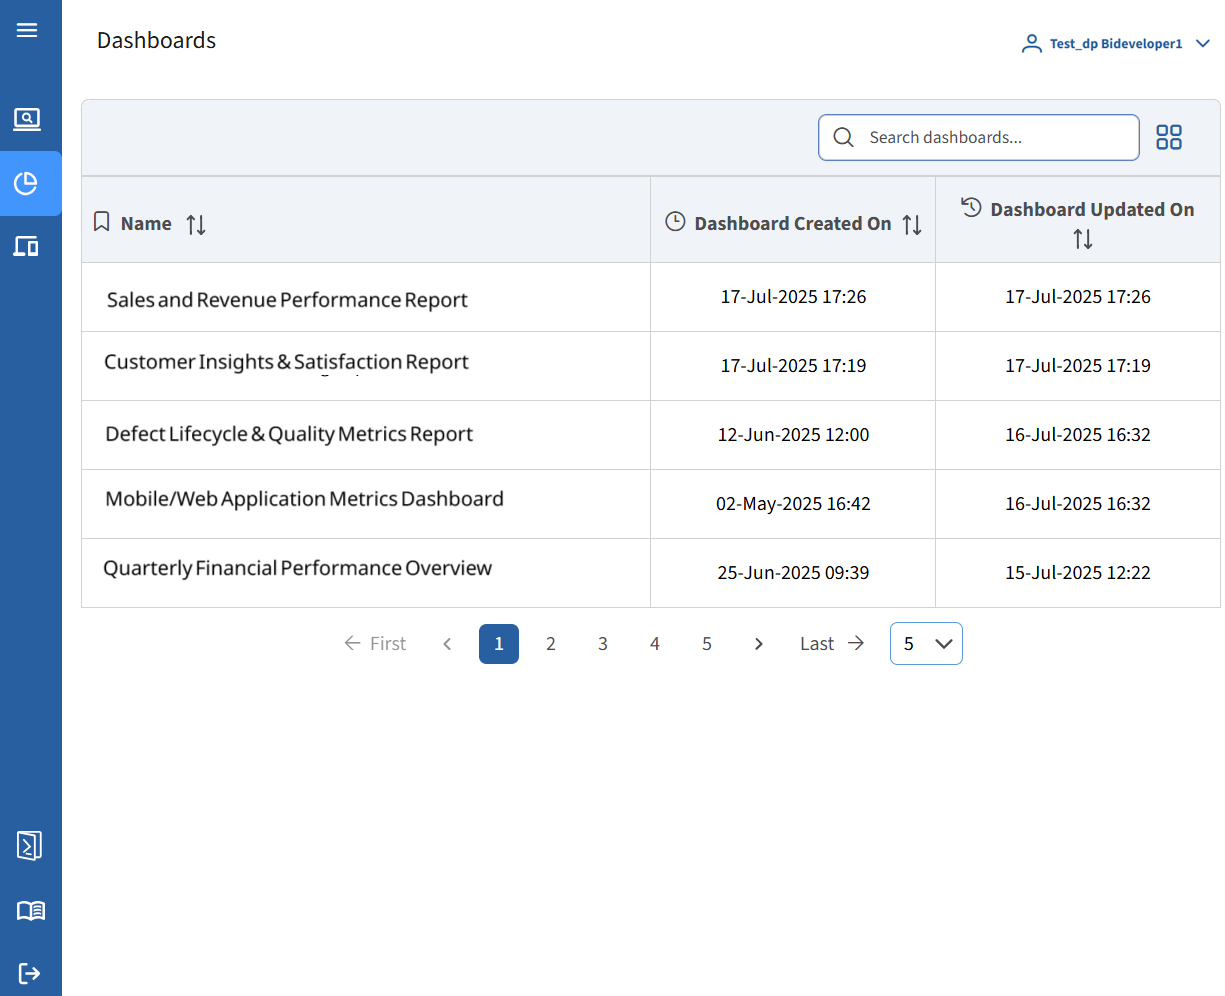
Today, our teams use Quick Sight for a variety of purposes that have transformed how we interact with and use data. The platform enables us to create visualizations that help in understanding key metrics and trends, generate regular reports for stakeholders to track performance, and facilitate collaboration by sharing dashboards and insights across teams. One of the most valuable aspects of Quick Sight is its ability to support one-time analysis. Users can perform immediate analyses, and teams can answer questions as they arise. This capability has significantly enhanced our data-driven decision-making process. We embedded Quick Sight dashboards into our internal applications, providing users with different views based on their roles and permissions. The following screenshot shows several role-based dashboards.
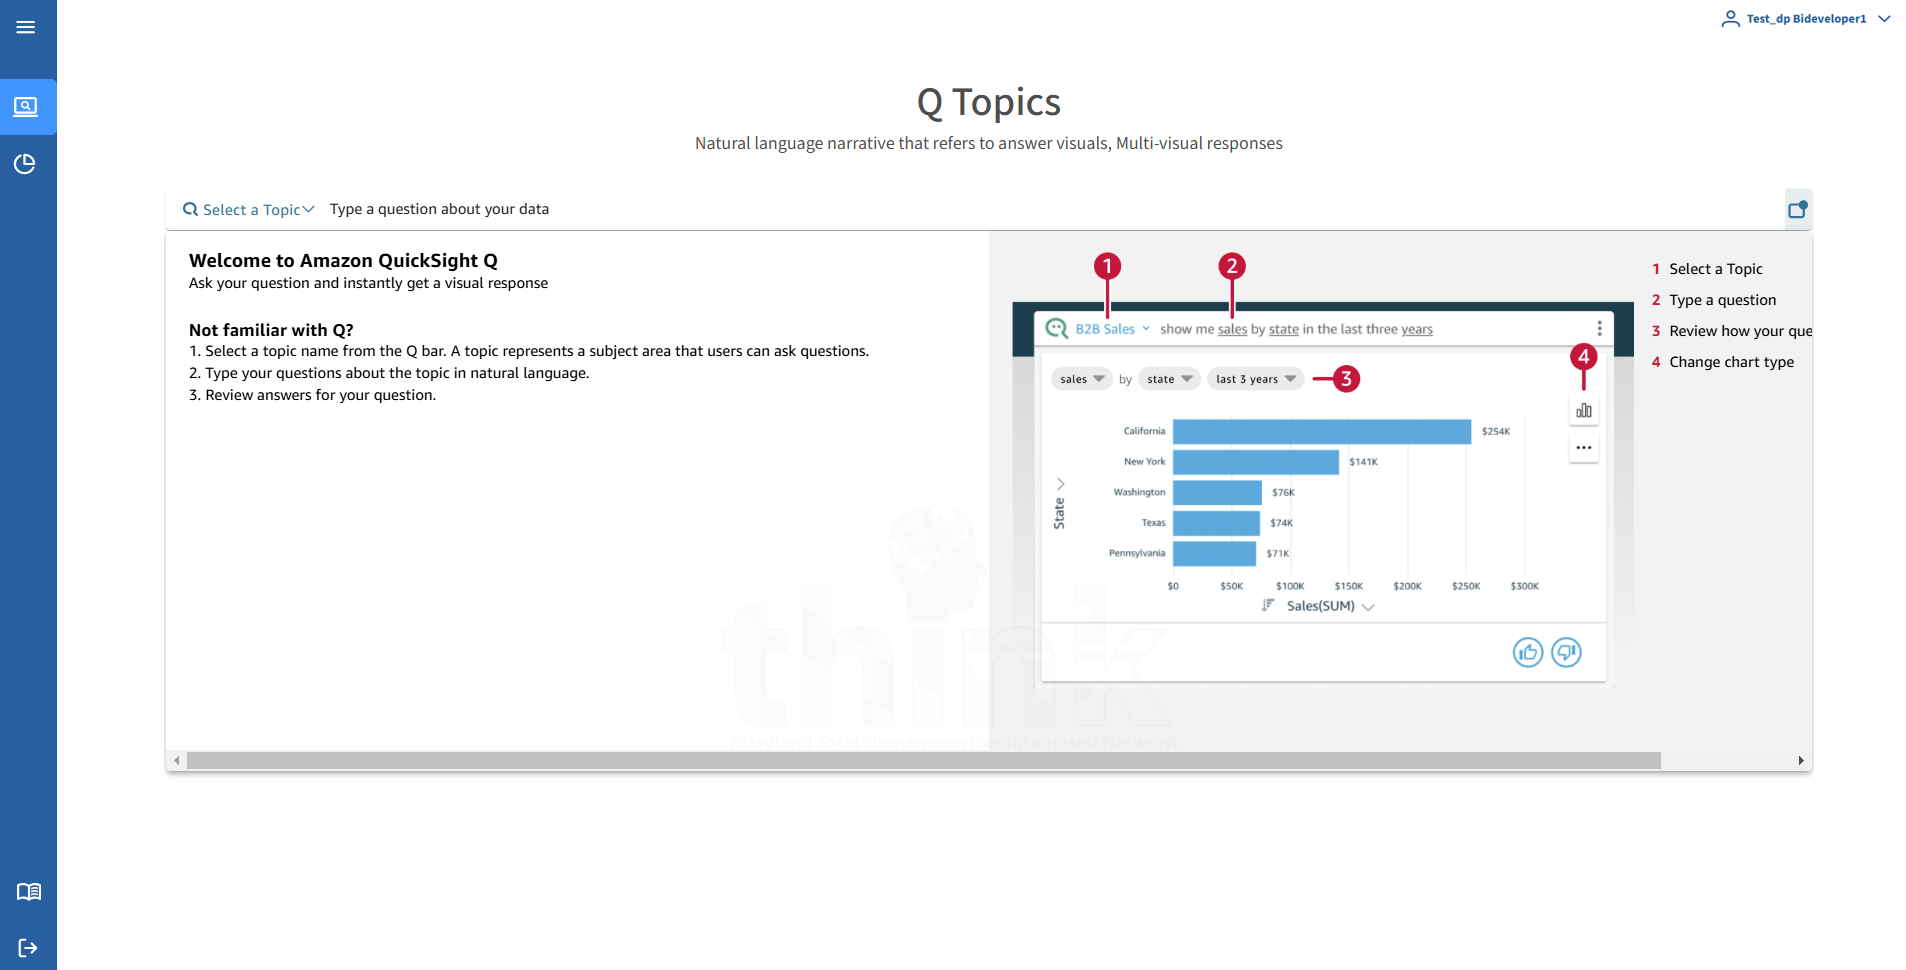
For users who prefer natural language queries, we implemented Q topics so they can ask questions about their data in plain language, as shown in the following screenshot.
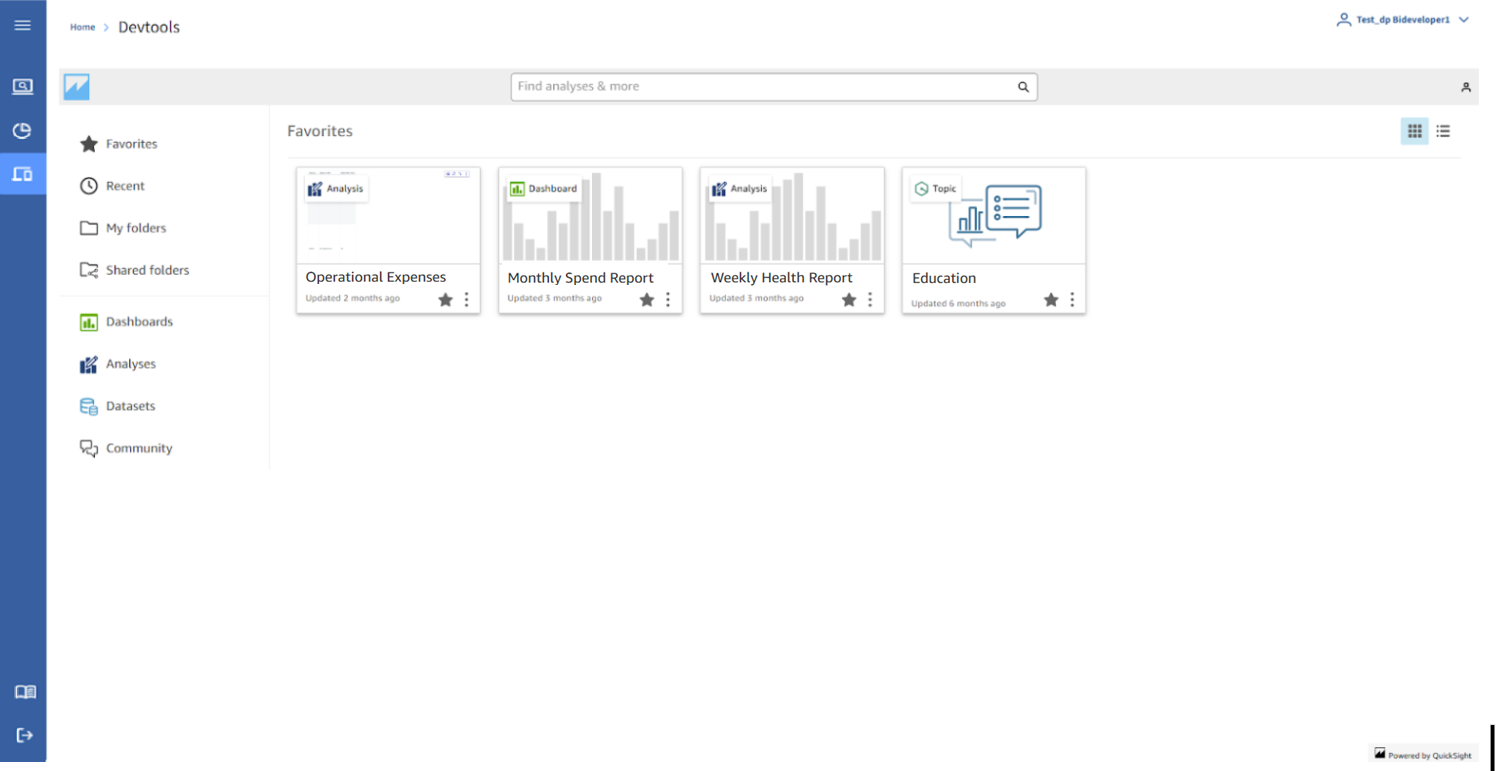
For our developers and data analysts, we provide access to the full authoring console where they can create and modify dashboards as needed, as shown in the following screenshot.
Currently, we have approximately 60 users accessing solutions in our production environment and about 100 users in our development environment. We anticipate this number to grow to approximately 2,000 users by July 2026 as we continue to expand our implementation.
Key benefits and results
The implementation of Quick Sight has delivered significant benefits across our organization, transforming how we approach data analytics and decision-making.
Improved efficiency and performance
One of the most notable improvements has been in reporting efficiency. We experienced a 40–50% reduction in time spent on report generation. This frees up time for teams to focus on more strategic tasks rather than manual data processing. This efficiency gain has directly contributed to a 20–30% improvement in decision-making speed, resulting in quicker responses to emerging trends and issues. The technical performance of Quick Sight has been equally impressive. The SPICE (Super-fast, Parallel, In-memory Calculation Engine) technology delivers query response times that are 3–5 times faster than our previous tools. As a result, we handle datasets 510 times larger without performance issues. This capability has been crucial as our data volumes continue to grow. Real-time data access with minimal latency has transformed how our teams operate, providing them with current information when they need it most. The simplified data integration process has reduced setup time for connecting to various data sources by 20–30%, streamlining our analytics workflows.
Cost optimization
From a financial perspective, the switch to Quick Sight has resulted in significant cost savings. We achieved a 10–20% reduction in data management and reporting costs, with potential total analytics cost savings of 10–60% compared to traditional BI solutions. These savings come from both direct and indirect sources. Direct savings include reduced licensing and infrastructure costs, which can account for 20–40% of the total cost reduction. Indirect savings result from improved reporting efficiency and decreasing data management time, leading to labor cost savings of 15–25%.The return on investment (ROI) has been substantial, with organizations typically seeing an ROI of 150–300% within the first year due to increased productivity. Additionally, we observed a 30–40% increase in BI tool adoption across teams, promoting better data-driven decision-making throughout the organization.
Enhanced collaboration and decision-making
Perhaps the most transformative benefit has been the democratization of data access across our organization. Technical and nontechnical users create dashboards and visualizations without extensive training with the user-friendly interface in Quick Sight. This accessibility has enhanced collaboration across teams and ensured that insights are available to stakeholders at all levels. Through the platform’s cloud-native, web-based interface, analysts and business teams quickly access data from anywhere, promoting faster collaboration and reducing bottlenecks in information sharing. This capability has been particularly valuable as our workforce has become more distributed.
Future plans
As we continue to evolve our data analytics capabilities, we have several initiatives planned to further take advantage of Quick Sight. We’re focused on enhancing our dashboards and topics to provide more insights for end users, as well as providing additional training to maximize the use of Quick Sight features across the organization. We’re working to integrate additional data sources to create a more comprehensive view of our business operations. As we scale our usage to more teams, we’ll continue to monitor performance metrics and user engagement to optimize resource utilization. One of our key priorities is to explore new features as they become available, driving development and efficiency through the use of the latest analytics capabilities. We’re particularly interested in expanding our use of natural language querying through Q topics to make insights even more accessible to nontechnical users.
Conclusion
The implementation of Quick Sight has transformed how Maryland Benefits approaches data analytics. We created a more data-driven culture across our organization. By using cost-effective, scalable, and user-friendly Quick Sight for data visualization and analysis, we overcame the limitations of our previous tools and unlocked new insights from our data.
The benefits we realized, including improved reporting efficiency, faster decision-making, and significant cost savings, validated our decision to adopt Quick Sight as our BI solution. As we continue to expand our implementation and explore new capabilities, we’re confident that Quick Sight will remain a cornerstone of our data strategy as we strive to better serve the citizens of Maryland through more effective and efficient human services delivery. Through our data portal, powered by Quick Sight, we’re creating a unified platform that promotes efficiency and collaboration, making data-driven insights accessible to all stakeholders who need them. This approach not only enhances our operational efficiency but also supports our broader mission of enabling a more integrated, client-centric approach to health and human services delivery and management.
The unique aspects of our Quick Sight implementation, including support for multiple domains and a user-centric design, have contributed to high engagement and adoption rates among diverse teams. By utilizing Quick Sight capabilities for real-time analytics and natural language queries, we made data insights accessible to users across a range of technical skill levels, fostering a culture of data-driven decision-making throughout our organization. As we look to the future, we’re excited about the possibilities that Quick Sight offers for further enhancing our data analytics capabilities and continuing to drive innovation in how we serve the citizens of Maryland.
About the authors
 Lingam Chockalingam is Chief Data Architect at Maryland Benefits, where he spearheads strategic data initiatives for enterprise-wide transformation. His work includes leading shared data platform initiatives, implementing the enterprise data strategy (EDS), and developing a modern data analytics and management framework. He is instrumental in fostering cross-agency collaboration to deliver cutting-edge data solutions, including those that leverage AI/ML, Generative AI, and Agentic AI, to enhance operational efficiency and informed decision-making.
 Karunakaran Muthusamy leads the design of scalable, secure, and high-performance enterprise-grade software solutions. He specializes in cloud-native applications, mobile applications, API design, microservices architecture, software development, and best practices. Collaborates closely with the leadership and business teams to design and develop robust solutions, including serverless models, to ensure application scalability. Outside of work, he is passionate about playing in professional leagues and enjoys embarking on adventure trips with family and friends.
 Sid Joshi is a Solutions Architect with Amazon Web Services, where he partners with public sector organizations to accelerate their cloud transformation journeys. For the past three years, he has served as a trusted advisor to the State of Maryland, guiding agencies through cloud adoption, large-scale migrations, and strategic modernization initiatives. With a passion for innovation and hands-on problem-solving, Sid thrives at the intersection of technology and impact, specializing in building scalable solutions in networking and observability while constantly experimenting with emerging tools and architectures to help his customers unlock the full potential of the cloud.