AWS Business Intelligence Blog
Transform and visualize your data preparation flow in Amazon Quick Sight without SQL
Amazon Quick Sight, a capability of Amazon Quick Suite, delivers AI-powered business intelligence (BI) capabilities that transform your scattered data into strategic insights for everyone, helping you make faster decisions and achieve better business outcomes.
Data preparation is often the most time-consuming part of analytics, especially when business users lack SQL expertise. Analysts typically spend most of their time preparing data rather than generating insights. This challenge is particularly critical in retail organizations, where data is often siloed across multiple systems and time periods.
In this post, we explore how AnyCompany (a fictional company for the purpose of this post), a mid-sized retail company, helps their business analysts transform complex data without writing a single line of SQL using the new Quick Sight data preparation experience. We see how analysts can use features like Append, Join, Unpivot, and Aggregate to solve complex data challenges through a simple point-and-click interface, and how datasets can be reused as sources for further transformations, enabling collaboration between teams.
Challenges with data preparation
AnyCompany sells a variety of consumer products, including USB hubs, wall clocks, storage boxes, and other home and office items. Their analytics team needs to combine historical sales data with forecasts to optimize marketing spend across regions.
The company faces several data challenges:
- Sales data is split across multiple tables by year (2023, 2024, 2025)
- Product and regional information exist in separate dimension tables
- Data format inconsistencies exist across sources (for example, zip code formats)
- Forecast data is stored in Excel files with a column-oriented structure
Previously, these challenges required SQL expertise or waiting for assistance from technical teams. With the new Quick Sight data preparation experience, AnyCompany’s business analysts can solve these problems independently.
Solution overview
AnyCompany implemented a collaborative data preparation workflow using Quick Sight:
- A global analyst creates a foundation dataset combining sales, product, and regional data.
- A regional analyst builds upon the foundation with region-specific analysis and forecasting.
- Visual data preparation experience enables analysts to perform advanced data transformations without writing complex SQL queries.
- SPICE (Super-fast, Parallel, In-memory Calculation Engine) powers the in-memory calculation engine for optimal performance.
The global analyst’s journey
AnyCompany’s global analyst needs to create a comprehensive sales dataset that combines multiple years of data with product and regional information. Despite having limited SQL knowledge, the analyst is able to build this foundation using the new Quick Sight data preparation experience.
Creating a multi-year sales foundation
The global analyst starts by examining the 2023 sales data, which contains order details including product_id, customer_id, order_date, ship_date, sales, quantity, and discount. The following screenshot shows an example of some of these columns.
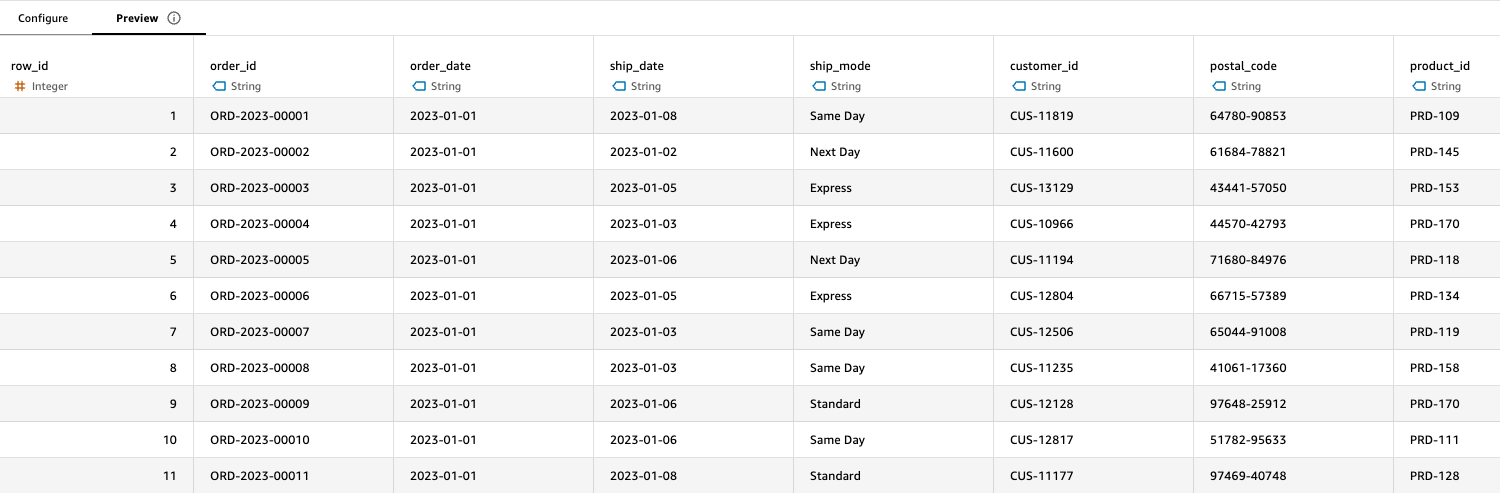
With the Append capability in Quick Sight, the analyst combines this with 2024 and 2025 sales data in just a few clicks. The Preview tab after each step helps the analyst immediately verify the data is being combined correctly, building confidence in the transformation process.
Enriching with dimensional data
With the combined sales data in place, the analyst joins it with the product dimension table. The Join operation in Quick Sight is straightforward—the analyst simply selects the tables to join and the common key (product_id), and the preview immediately shows the enriched dataset with product information alongside sales data.
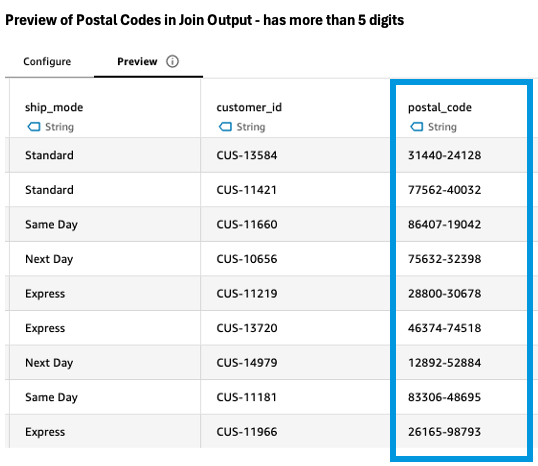
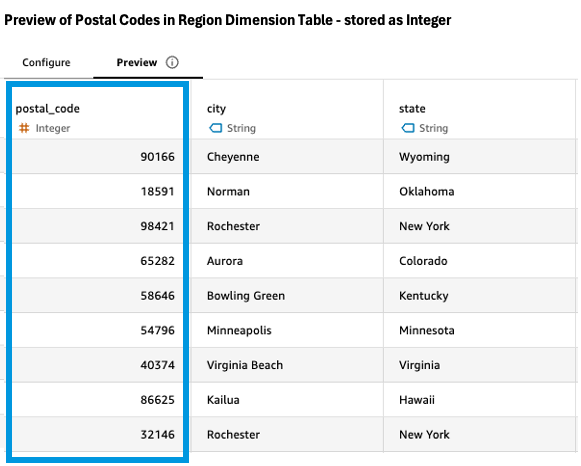
When attempting to join with the region dimension table, however, the analyst encounters a data quality challenge. The Preview tab reveals that zip codes in the sales data and region table don’t match. Some zip codes in the sales data have more than five digits, and the region table stores zip codes as integers rather than strings.
 |
 |
Solving data type inconsistencies
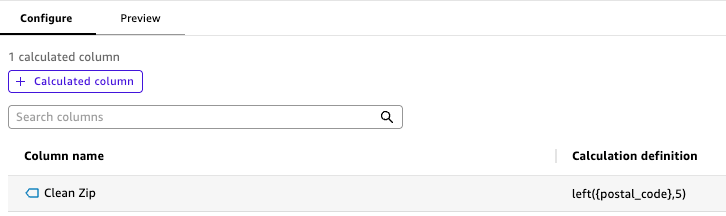
Quick Sight offers transformation capabilities to resolve these inconsistencies. In a single calculated column step, the analyst creates a Clean Zip column using the formula left({postal_code}, 5) to standardize zip code length. The Configure tab shows a preview of this calculation in real time.
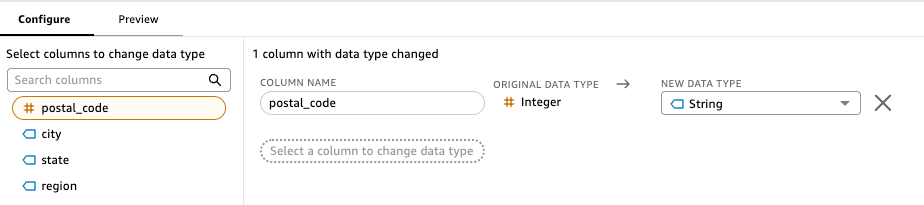
In another transformation, the analyst converts the integer zip codes to strings using a simple data type change. What would have required complex SQL CAST functions and string manipulations is accomplished through a few clicks in the visual interface.
With the zip codes now consistent across both tables, the analyst successfully joins with the region dimension table and then proceeds to join with the customer dimension table using customer_id as the key.
Finalizing the dataset
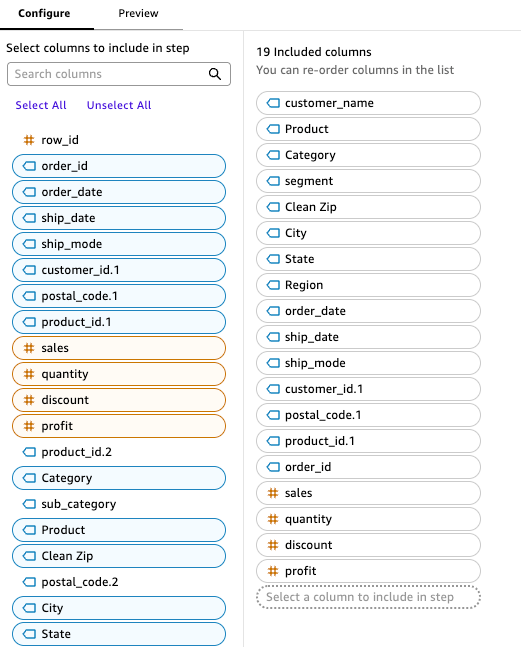
To make the dataset more user-friendly, the analyst uses the Rename columns step to give columns more descriptive names. Quick Sight allows renaming multiple columns in a single step, streamlining the process. The Select columns step provides an intuitive interface for including, excluding, and rearranging columns—the analyst simply drags columns to reorder them or excludes them with a single click.
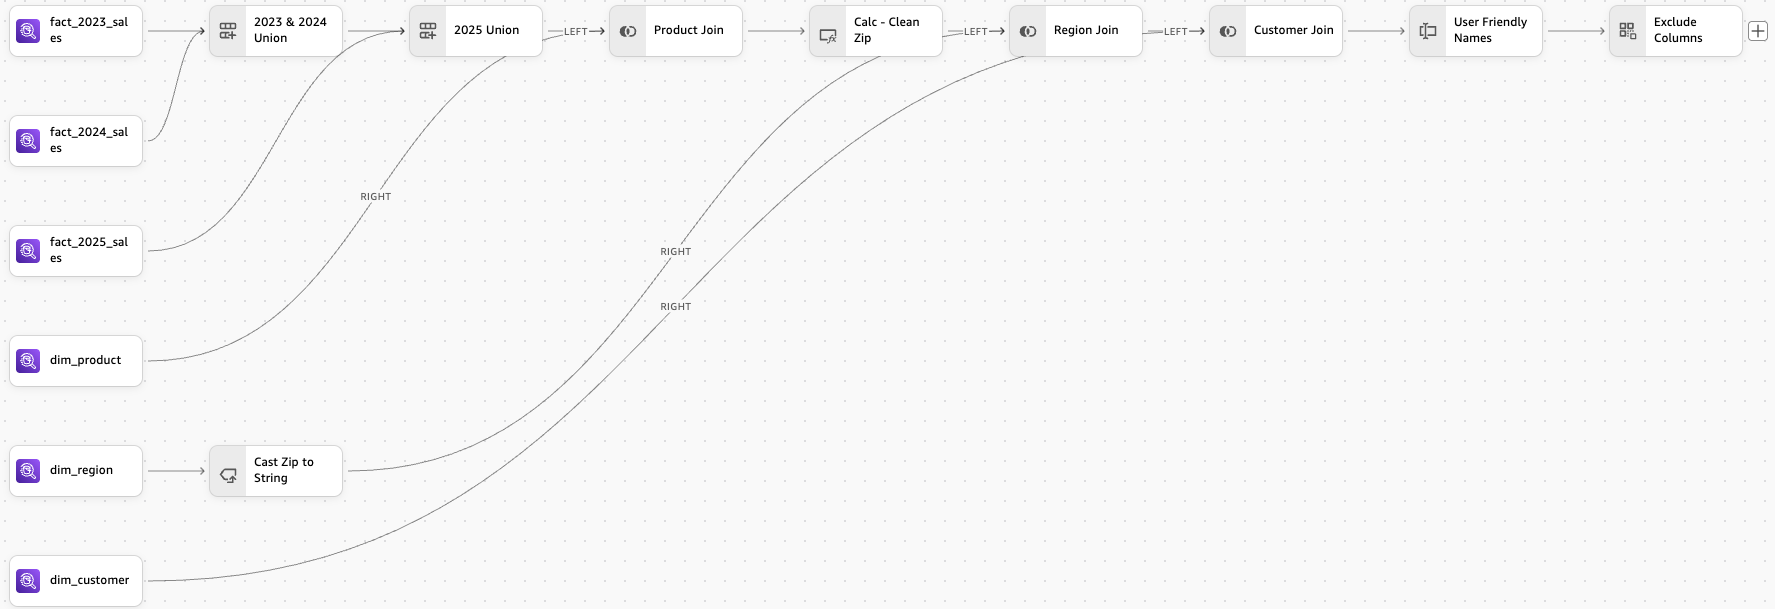
After finalizing the transformations, the analyst creates user-friendly step names like 2023 & 2024 Union, Product Join, Calc – Clean Zip, and Customer Join, making the data preparation process transparent and straightforward to understand. The analyst then saves and publishes the dataset as Sales Revenue Dataset, making it available for other analysts to build upon.
The following screenshot illustrates the final workflow of the global analyst.
The regional analyst’s journey
AnyCompany’s US-Central regional analyst needs to create year-over-year sales projections for their specific region. Instead of recreating the data preparation work already done by the global analyst, they can use the Sales Revenue Dataset as a foundation.
Building on a shared foundation
The regional analyst starts by creating a new dataset and selecting the Sales Revenue Dataset as the source. This approach offers significant advantages: the regional analyst doesn’t need to understand or recreate the logic that went into building the Sales Revenue Dataset, which will be maintained by the global analyst. Any updates to the source dataset will automatically flow through to the regional analyst’s work.
The regional analyst first applies appropriate date formatting using the Change data type step to facilitate consistent date handling throughout the analysis.
Focusing on regional data
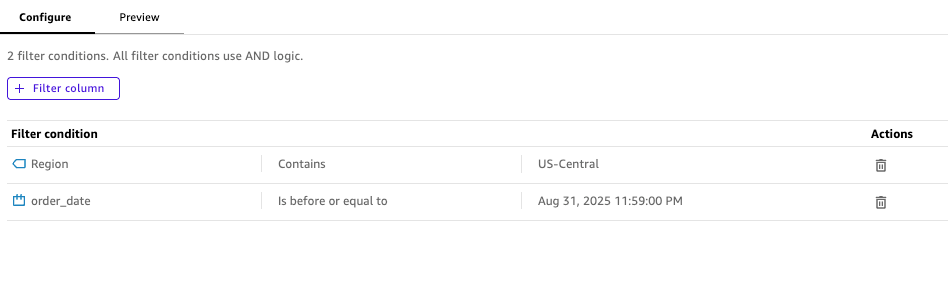
Next, the analyst uses the Filter step to focus only on the US-Central region, quickly narrowing down the dataset to their area of responsibility. The analyst also notices the sales data for the first few days in September 2025, which includes estimated sales (not the actual sales), so proceeds to apply the appropriate filters. The Configure tab helps the analyst preview the condition for multiple filters.
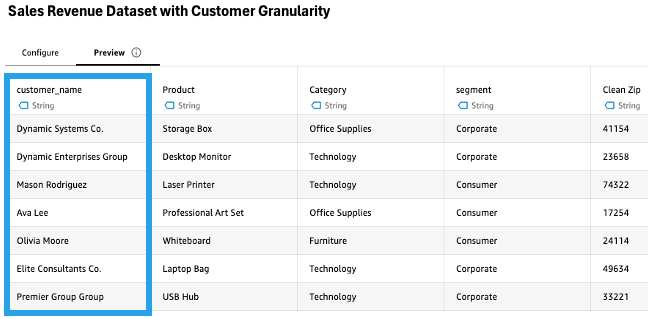
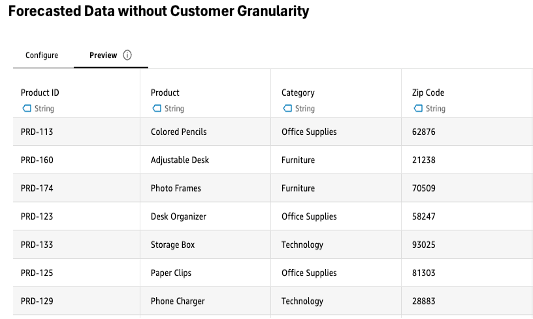
Handling different granularity levels
The analyst needs to combine the filtered Sales Revenue Dataset with forecast data, but there’s a granularity mismatch. The Sales Revenue Dataset includes customer information, whereas the forecast data is at the product category and month level.
 |
 |
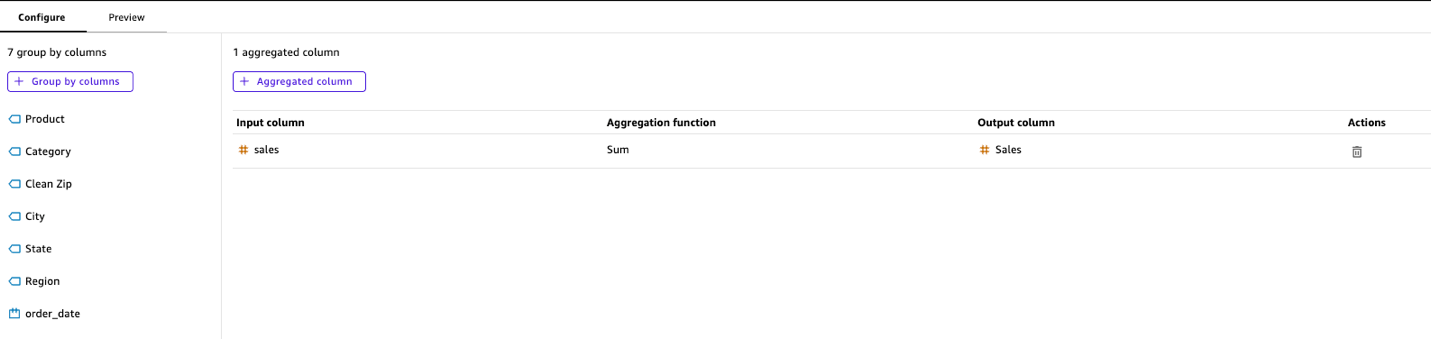
Using the Aggregate step, the analyst groups the data by columns like Product, Zip, Region, and Category, calculating the sum of Sales. This transformation adjusts the granularity to match the forecast data without requiring complex SQL GROUP BY statements.
Transforming column-oriented forecast data
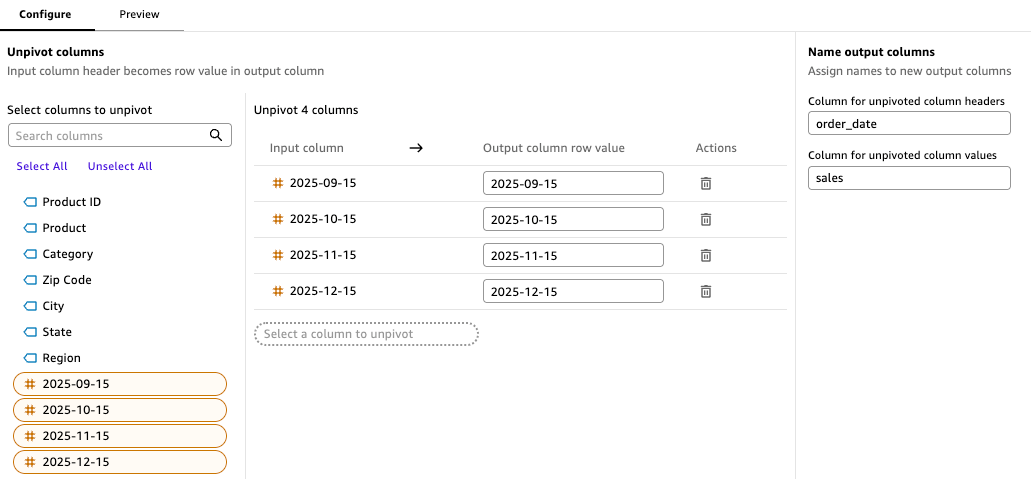
The regional analyst faces another challenge: the forecast data for September through December 2025 is stored in an Excel file with months as columns rather than rows. In traditional SQL, this would require a complex UNPIVOT operation.
 |
 |
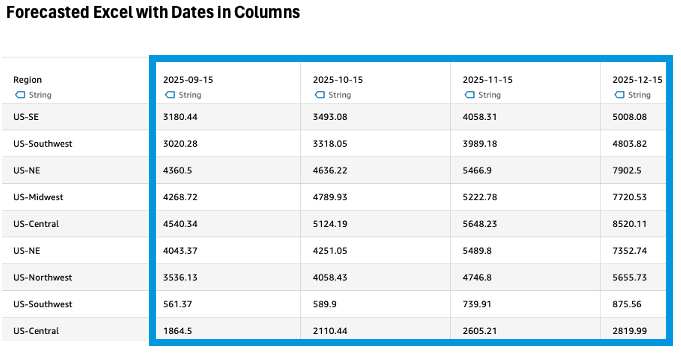 |
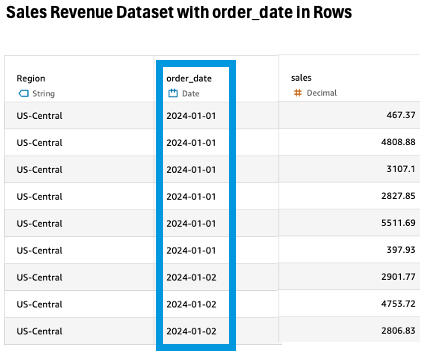
With the Unpivot transformation in Quick Sight, the analyst simply selects the month columns (for September, October, November, and December 2025) and specifies the output column names as order_date and sales to match the column names in the aggregated Sales Revenue Dataset. The transformation instantly converts the column-oriented data into a row-oriented format that can be combined with the historical data.
Before appending, the analyst uses a Change data type step to convert the order_date column from string to date format, supporting consistency with the date format in the Sales Revenue Dataset.
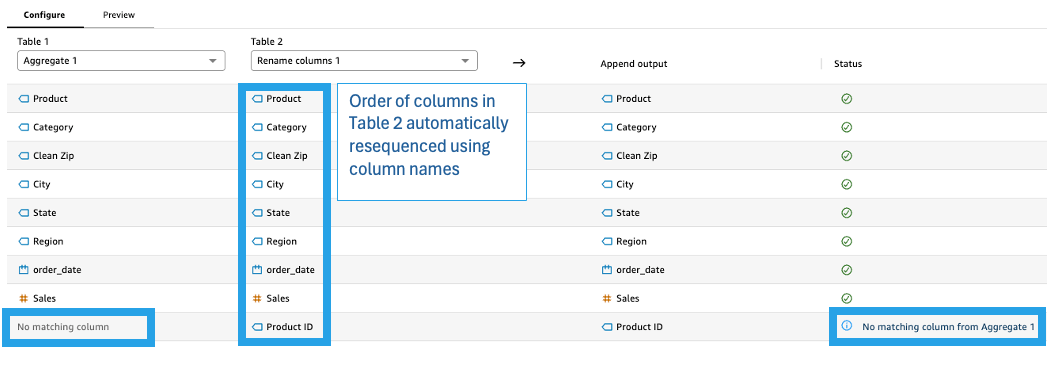
Combining historical and forecast data
With both datasets now in compatible formats, the regional analyst uses an Append step to combine the historical data through August 2025 with the forecast data for September through December 2025. The sequence of columns like Product and Category are completely different between the two tables, and the number of columns also differs. Quick Sight automatically handles the heavy lifting of aligning columns by name rather than position, providing appropriate output messages on the Configure tab. This saves the analyst significant time compared to writing complex SQL that would need to explicitly handle column alignment and potential mismatches.
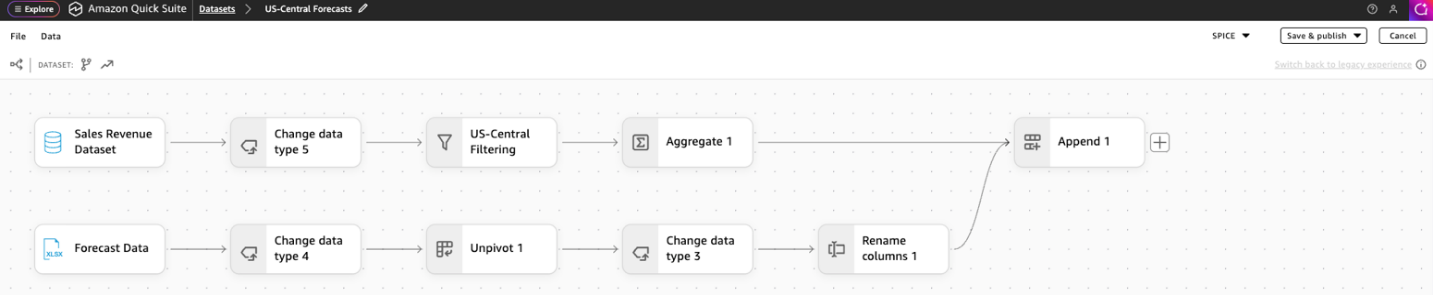
The result is a complete dataset spanning the entire year, with actual figures for past months (August 2025 and before) and projections for future months (starting September 2025).
The following screenshot illustrates the final workflow of the regional analyst.
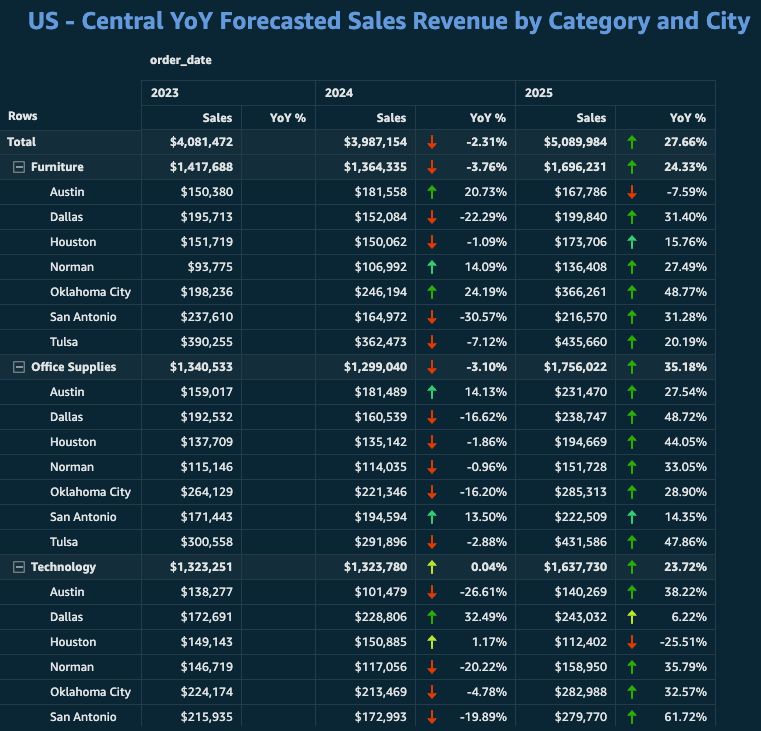
Creating year-over-year analysis
Now that the data has been prepared, the regional analyst can create year-over-year comparisons that include both actual and forecasted data. Using the analysis capabilities of Quick Sight, they create visualizations showing how sales are trending compared to previous years, with projections extending through the end of the year. This gives the regional team valuable insights for planning and resource allocation without requiring SQL expertise.
Benefits and results
With the new data preparation experience in Quick Sight, AnyCompany achieves significant improvements:
- Time savings – Data preparation tasks that previously could have taken days can now be completed in less than an hour
- Reduced technical dependencies – Business analysts can self-serve without requiring SQL expertise
- Improved collaboration – Global and regional analysts can build upon each other’s work
- Faster time-to-insight – The visual interface helps analysts quickly identify and resolve data quality issues
The step-by-step visual interface transforms how AnyCompany works with data. What used to require complex SQL queries can now be accomplished through simple clicks.
Conclusion
The new Quick Sight data preparation experience democratizes data transformation, helping users perform sophisticated operations without technical expertise. As AnyCompany’s story demonstrates, features like Append, Join, Unpivot, and Aggregate—combined with the ability to build composite datasets—help analysts solve real-world data challenges through an intuitive visual interface.
The ability to use existing datasets as sources for new transformations fosters collaboration between teams and facilitates consistency across the organization. By eliminating the complexities of data preparation for analysts, organizations can accelerate time-to-insight.
To get started with the new data preparation experience in Quick Sight, sign up for a Quick Suite account. Then you can create a new dataset and explore the step-by-step transformation capabilities.
About the authors
 Ramon Lopez is a Principal Solutions Architect for Amazon Quick Sight. With many years of experience building BI solutions and a background in accounting, he loves working with customers, creating solutions, and making world-class services. When not working, he prefers to be outdoors in the ocean or up on a mountain.
 Vignessh Baskaran is a Sr. Technical Product Manager owning Data Connectivity and Data Preparation domains in Amazon Quick Sight, a capability of Amazon Quick Suite. Leveraging his background in business intelligence and data warehousing, he led the product strategy and development of the new data preparation experience in Quick Sight, focusing on making complex data transformations accessible to all users. Outside of work, he enjoys watching cricket, playing racquetball, and exploring different cuisines in Seattle.