Containers
Full request and response compliance logging on Amazon EKS
Compliance logging on Amazon Elastic Kubernetes Service (Amazon EKS) reveals its biggest gap at exactly the moment that it matters most. An auditor asks for the actual request and response data behind a transaction, not only the metadata around it. Imagine your security team needs every API transaction involving patient health records from last Tuesday. You pull up your observability dashboard, and it shows HTTP status codes, latency metrics, and request counts. But the auditor shakes their head, explaining that they need to see the actual data that was transmitted.
This is the compliance gap that many enterprises running microservices on Amazon EKS face today. Service meshes like Istio and proxies like Envoy excel at capturing metadata, status codes, headers, and latency, but they don’t capture the actual request and response bodies. The very data that auditors, regulators, and compliance officers need to verify is the data that’s never recorded.
For enterprises with stringent data governance and audit requirements, this represents an operational gap. Failed audits, regulatory fines, and the inability to reconstruct what happened during a security event are real consequences of this gap.
In this post, we demonstrate how to use Envoy’s External Processing filter (ext_proc) to solve this challenge on Amazon EKS. This solution captures complete request and response data without modifying application code, providing the compliance-grade audit trails that regulators require.
Why enterprises need full request and response logging
Traditional observability tools are designed to answer, “what happened?” They tell you a request was made, how long it took, and whether it succeeded. But compliance requires answering a different question: “what was the actual data?”
Consider a few scenarios where this matters. A financial services firm needs to prove that sensitive cardholder data was handled appropriately across every API transaction, while a healthcare organization must demonstrate comprehensive audit trails showing exactly what protected health information (PHI) was exchanged between services. Similarly, an enterprise undergoing an audit needs to produce evidence that sensitive data was properly processed and that no unauthorized data left the network.
In each case, metadata alone falls short. Full request and response logging is what closes the gap between observability and auditability.
Alternative approaches to request and response logging
There are several ways organizations attempt to achieve full request and response logging, each with significant trade-offs:
- Application-level logging: Embedding logging logic directly into each microservice. This works initially but leads to duplicated code across dozens or hundreds of services, inconsistent implementations, and a maintenance burden that grows with every new service. It also means compliance logic is scattered across teams and codebases.
- Custom Envoy filters (C++): Writing native Envoy filters gives you full control, but requires compiling against the Envoy code base, maintaining a custom build pipeline, and finding engineers fluent in C++ and Envoy internals. For most organizations, this isn’t practical.
- Lua scripting in Envoy: A lighter-weight option, but Lua scripts become difficult to maintain, test, and scale as business logic grows. They also lack the ecosystem tooling and debugging support of mainstream languages.
- Dedicated API gateways with logging: Some API gateways offer request and response logging, but adding another layer introduces latency, cost, and operational complexity, and might not integrate cleanly with your existing service mesh.
Proxy-layer request and response capture with Envoy’s External Processing filter
This post demonstrates how to use Envoy’s External Processing filter (ext_proc) to solve this challenge on Amazon EKS. We walk through an end-to-end implementation that includes:
- Deploying an EKS cluster with an Istio service mesh using Terraform.
- Building a gRPC external processing service that captures complete request and response data.
- Configuring Envoy’s ext_proc filter to stream traffic to that service.
- Deploying and testing the full solution.
This approach provides several key benefits for compliance-focused organizations:
- Centralized compliance logic: One place to capture, audit, and control request and response logging across all services.
- Zero application code changes: Services remain untouched. Logging happens transparently at the proxy layer.
- Selective capture: Log full request and response data for compliance-sensitive endpoints while leaving others untouched.
- Redaction capabilities: Mask or remove sensitive fields, such as personally identifiable information (PII), PHI, and cardholder data, before data reaches your logging infrastructure. This turns a data governance risk into a data governance control.
High-level architecture
The following diagram shows the architecture for implementing full request and response compliance logging on Amazon EKS using Envoy’s External Processing (ext_proc) filter and Istio service mesh.
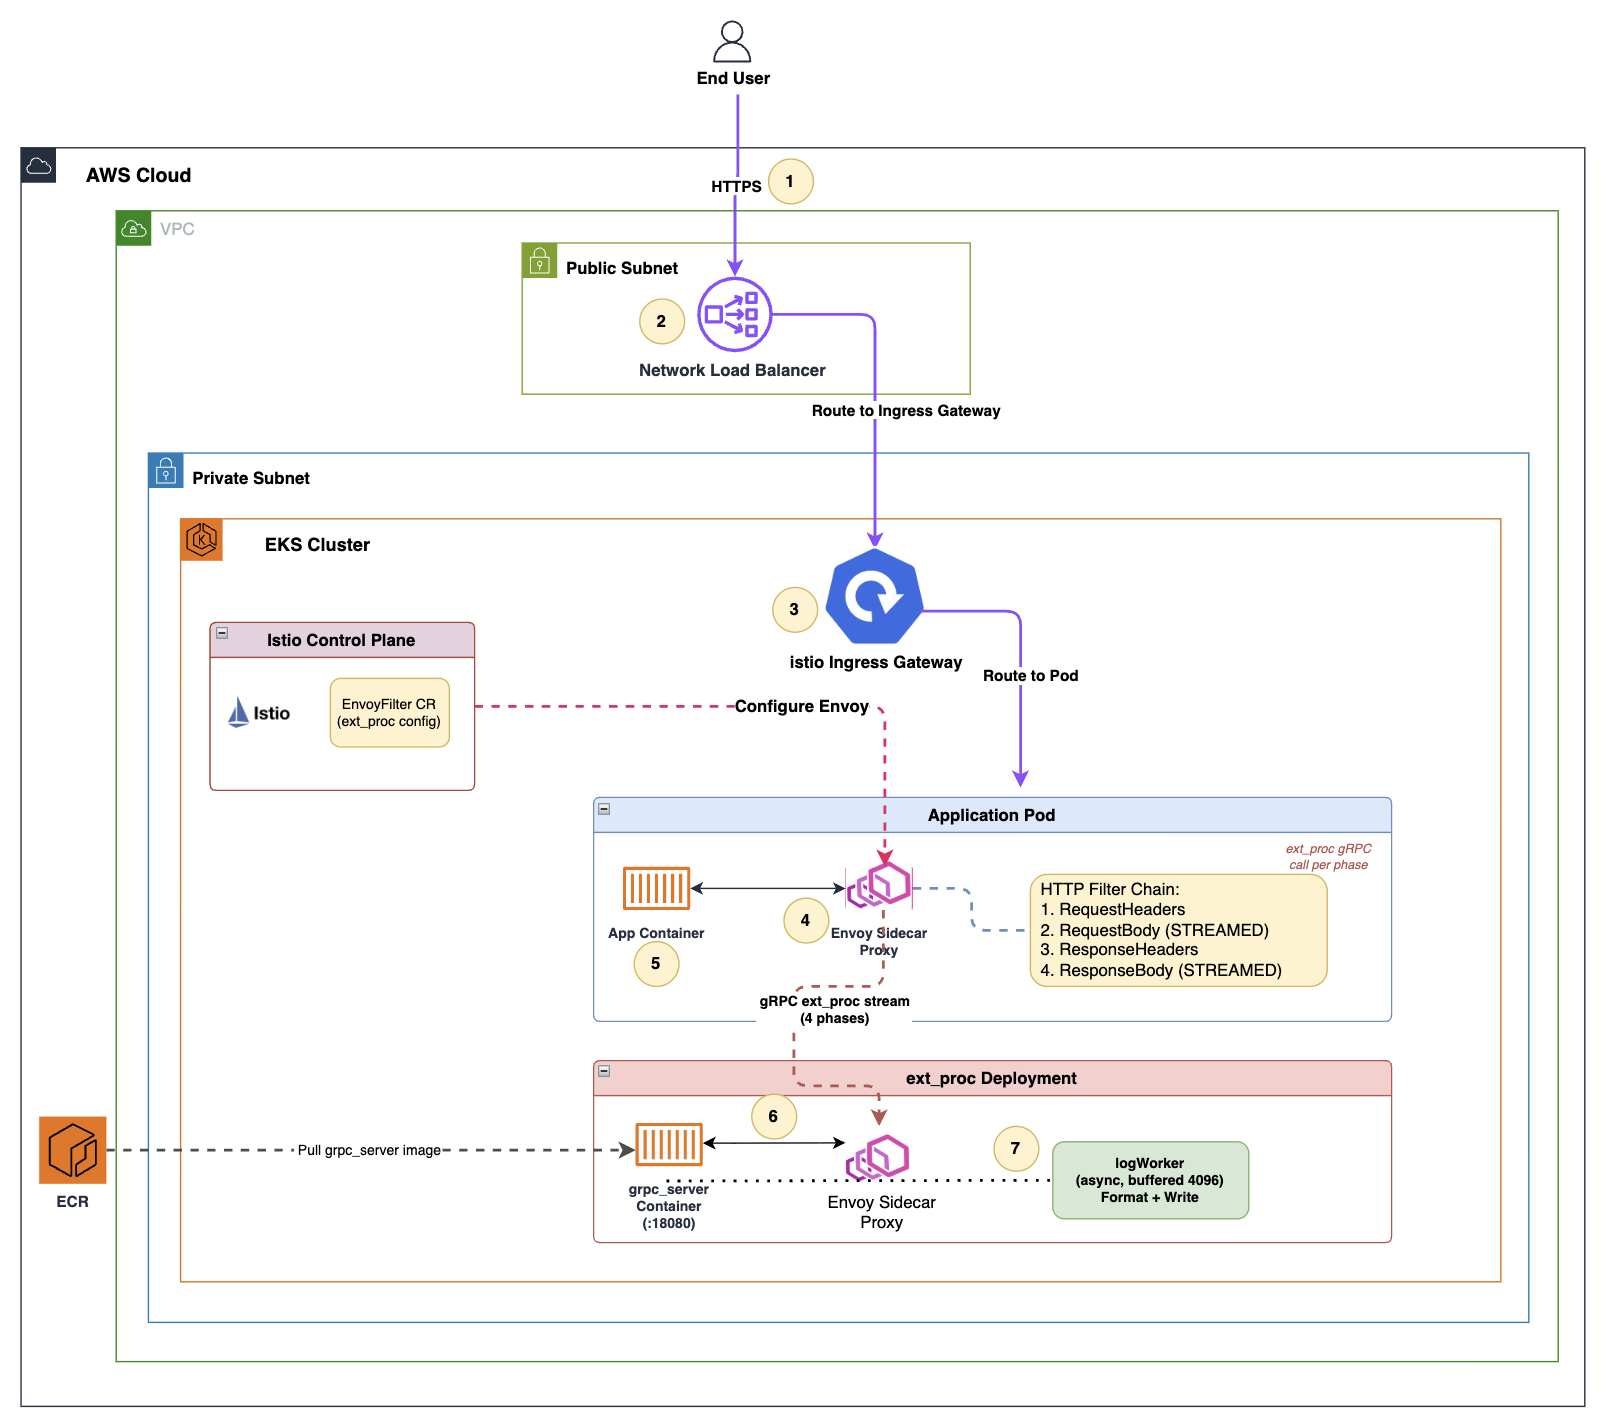
Figure 1: High-level architecture of the ext_proc filter on Amazon EKS
Request and response flow
When an HTTP request enters the system, it passes through the following stages. Each component is introduced as it participates in the flow.
- The client sends an HTTPS request to the application endpoint. Domain Name System (DNS) resolves to a Network Load Balancer (NLB) deployed in the public subnets of the virtual private cloud (VPC).
- The NLB forwards the request to the Istio Ingress Gateway, deployed in the Amazon EKS cluster. It receives inbound traffic and routes it into the service mesh based on Gateway and Virtual Service resources.
- The Ingress Gateway matches the request and routes it to the target application pods. Traffic arrives at the Envoy sidecar proxy, automatically injected into each pod by Istio.
- The Envoy sidecar opens a new bidirectional gRPC stream to the external processing service (ext_proc server), a standalone Kubernetes Deployment running a gRPC server that implements the Envoy External Processing API.
- After the ext_proc server approves both phases (Request headers, Request body), Envoy forwards the complete request to the application container, the backend service (httpbin in this walkthrough) that processes requests and returns responses.
- The application processes the request and returns a response to the Envoy sidecar.
- Envoy continues the gRPC stream with the ext_proc server for the response phases (Response headers, Response body). At this point, the server consolidates all four phases: request headers, request body, response headers, and response body, into a single audit log entry correlated by the x-request-id header.
How the gRPC stream works
A key detail of this architecture is how Envoy communicates with the ext_proc server. For each HTTP request, Envoy opens a dedicated bidirectional gRPC stream that is never shared across requests, which provides per-request isolation. Envoy sends Processing Request messages at each of the four phases and blocks until it receives a Processing Response before proceeding to the next phase.
Because Envoy blocks each phase, the ext_proc server response time directly impacts request latency. To minimize this overhead, the implementation in this walkthrough uses an asynchronous logging pattern. The gRPC handler extracts the message data, sends it to a buffered channel, and immediately returns CONTINUE to Envoy. A separate background worker drains the channel and writes the consolidated audit logs asynchronously. This design keeps the gRPC stream fast while confirming that no message data is lost.
Walkthrough
In this section, we cover the complete implementation from provisioning infrastructure to testing the full request and response logging solution. All code referenced in this walkthrough is available in the GitHub repository.
Prerequisites
Before proceeding, make sure you have the following tools installed on your local machine:
- AWS Command Line Interface (AWS CLI) (v2.x): Configured with credentials that have permissions to create EKS clusters, AWS Identity and Access Management (IAM) roles, Amazon Elastic Container Registry (Amazon ECR), and Amazon Virtual Private Cloud (Amazon VPC).
- Terraform (v1.5+): For provisioning infrastructure.
- eksctl: For EKS cluster operations.
- kubectl: For interacting with the Kubernetes API.
- Helm (v3.x): For installing Istio and the AWS Load Balancer Controller.
- Docker with buildx support: For building multi-architecture container images.
- jq: For parsing JSON output in setup scripts.
Step 1: Clone the repository
Start by cloning the repository that contains all the infrastructure code, Kubernetes manifests, and the ext_proc server implementation:
Step 2: Provision infrastructure with Terraform
The Terraform configuration provisions the following resources:
- A VPC with public and private subnets across three Availability Zones.
- An Amazon EKS 1.35 cluster in Auto Mode (AWS manages node provisioning and scaling).
- An Amazon ECR repository for the ext_proc container image.
- Istio service mesh (istio-base and istiod) installed by Helm.
Navigate to the Terraform directory and initialize:
Review the planned changes:
Apply the configuration (this takes approximately 15–20 minutes):
After the configuration is complete, terraform outputs several values including the EKS cluster name, ECR repository URL, and a kubectl configuration command.
Step 3: Configure kubectl
After Terraform completes, configure kubectl to communicate with your new EKS cluster:
Verify connectivity:
You see nodes in a Ready state. EKS Auto Mode provisions these automatically based on workload demand.
Step 4: Install the Istio Ingress Gateway
Create a dedicated namespace for the Istio Ingress Gateway and install it using Helm with annotations specific to AWS to provision a Network Load Balancer:
This creates a Kubernetes Service of type LoadBalancer, which provisions a Network Load Balancer on AWS. Verify the Ingress Gateway is running:
The Istio-ingress service displays with an EXTERNAL-IP showing the NLB DNS name.
Step 5: Enable Istio sidecar injection
Enable automatic sidecar injection for the default namespace where applications are deployed:
This instructs Istio to automatically inject an Envoy sidecar proxy into every pod created in the default namespace.
Step 6: Deploy the ext_proc server to Kubernetes
The ext_proc server runs as a standard Kubernetes Deployment with a Service exposing port 18080.
Before applying, update the image field with your ECR repository URL:
Verify the deployment:
The output shows two pods in Running state and a Cluster IP service.
Step 7: Configure Envoy with the EnvoyFilter
The EnvoyFilter resource tells Istio to inject the ext_proc filter into the Envoy configuration for all workloads in the mesh. Apply the EnvoyFilter:
Verify it was created:
Step 8: Deploy the test application
This step uses httpbin as the test backend, an HTTP request and response service that echoes back what you send it.
Step 9: Test the setup
Verify the deployment:
Testing the solution
With all components deployed, you can now send HTTP requests to the application and verify that the ext_proc server captures complete audit logs containing both request and response data.
Retrieve the Network Load Balancer DNS name that fronts the Istio Ingress Gateway:
Send a GET request:
Send a POST request with a JSON body:
Both requests complete successfully. Now verify that the ext_proc server captured the full request and response data.
Step 10: Verify audit logs
Tail the logs from the ext_proc server pods:
Consolidated log entries appear as follows.
For the POST request:
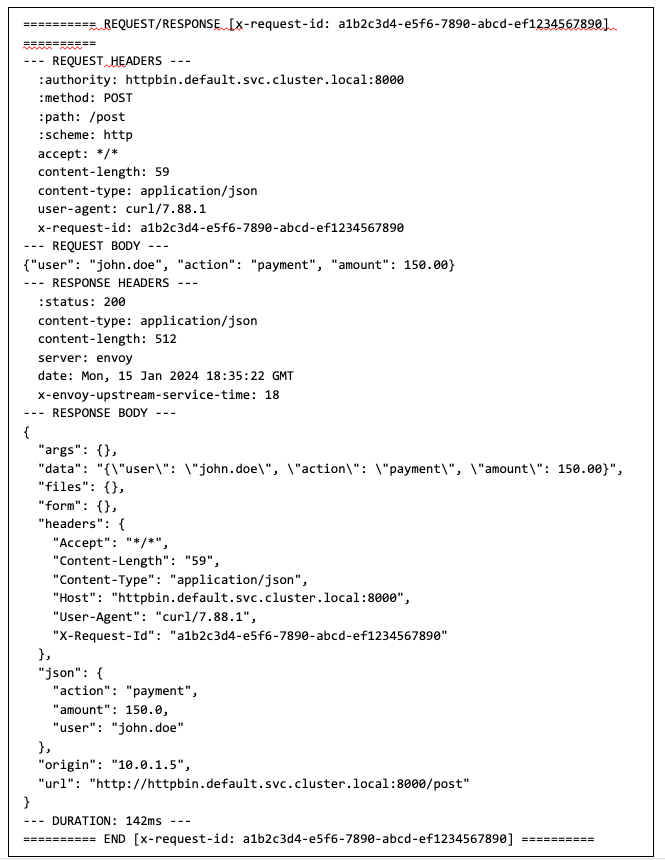
Each log entry contains the complete request headers, request body, response headers, and response body consolidated into a single record correlated by x-request-id. This is exactly the evidence that compliance frameworks require: a full auditable record of what data was transmitted in every transaction.
The httpbin application was completely unaware that payload logging occurred. The ext_proc server captured the exact bytes sent and received, and the x-request-id header tied all four phases together into a single logical transaction record. The asynchronous logging pattern kept the gRPC responses fast, minimizing impact on request latency.
Cleanup
To avoid ongoing charges, follow these steps to remove all resources created during this walkthrough.
Step 1: Delete application resources
Remove the test application, ext_proc server, and EnvoyFilter:
Step 2: Delete the Istio Ingress Gateway
Removing the Ingress Gateway deletes the Network Load Balancer. Complete this step before destroying the VPC:
Wait for the NLB to fully terminate (this can take 2–3 minutes).
Step 3: Destroy infrastructure with Terraform
Now that the application resources and dependencies managed by AWS are deleted, Terraform can cleanly destroy the remaining infrastructure:
This removes the EKS cluster and all associated IAM roles, the VPC with subnets, NAT gateways, and internet gateway, the ECR repository and container images, and the Istio Helm releases. The destroy process takes approximately 10–15 minutes.
Conclusion
In this post, we demonstrated how to achieve full request and response logging on Amazon EKS without modifying application code. By using Envoy’s External Processing filter and a custom gRPC service, this solution builds a compliance-grade audit trail that captures exactly what data was transmitted across your microservices architecture. This is the critical evidence that auditors and regulators require but traditional observability tools don’t provide.
The solution captures request and response headers and bodies in a single consolidated log entry correlated by request ID, making it straightforward to reconstruct any transaction. The architecture is non-invasive (applications remain unaware of the logging), centralized (one service handles all request and response capture), and extensible (the same pattern supports PII and PHI redaction, schema validation, and conditional request blocking).
If you have questions or feedback about this solution, leave a comment on this post. The complete code for this walkthrough is available in the GitHub repository. For more information on Envoy’s External Processing filter, see the Envoy documentation and the ext_proc proto definition.